
The Pollfish Survey Results Dashboard: Understanding its Functionality and How to Use it
The Pollfish Survey Results Dashboard: Understanding its Functionality and How to Use it
You’ll find the results of the survey you launched in the survey results dashboard on Pollfish. This page is your go-to source of survey data once the data of a survey is complete — that is — once all quotas from that survey are retrieved and the questionnaire has been fully filled out.
In order to properly analyze survey data and perform any sort of market analysis, whether macro or micro, you’ll need to have access to a clear and accurate set of survey results data.
Luckily, on Pollfish, the survey results page is easy to access, view and navigate. The data itself is of high quality, given the rigorous checks that the Pollfish platform facilitates to provide quality research data and avoid survey fraud.
This article delves into the ins and outs of the survey results dashboard, the page on the Pollfish online survey platform that contains all the survey results specific to the survey you run.
Understanding the Survey Results Dashboard on Pollfish
This dashboard is a page that contains all the results from the survey you conducted on the Pollfish market research platform, whether you ran the survey via the Distribution Link feature or randomly through our vast network of publishers.
The former method allows you to send surveys to specific people and on the specific digital properties you choose to insert your survey.
The latter refers to our Random Device Engagement (RDE) approach of survey distribution, which is a kind of organic sampling method that deploys the survey across a vast network and targets users where they exist voluntarily.
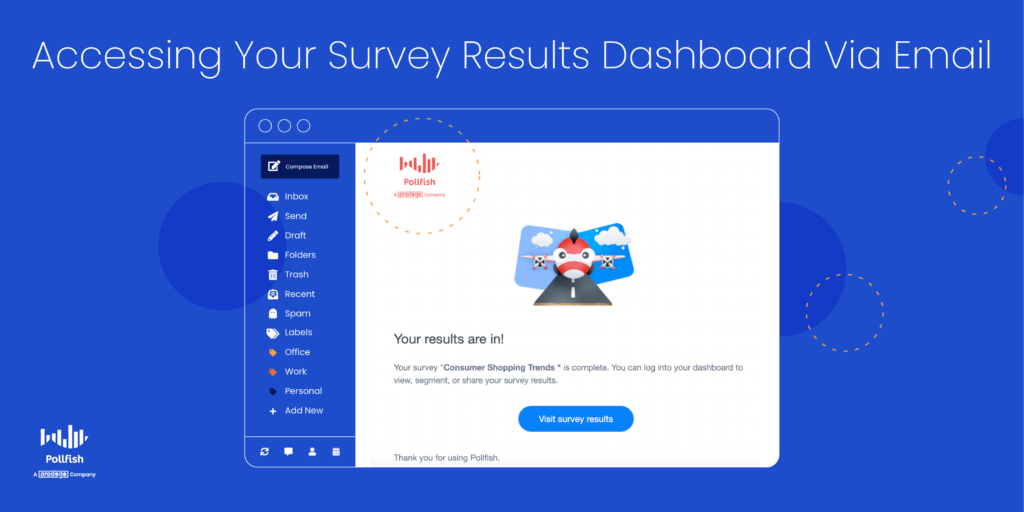
Each survey will have its own results page, meaning that each survey will have its own survey results dashboard. Whenever your survey collects all of its responses, it’ll be rendered complete and you’ll be sent an email prompting you to view your survey results.
Digging into the details of the survey results
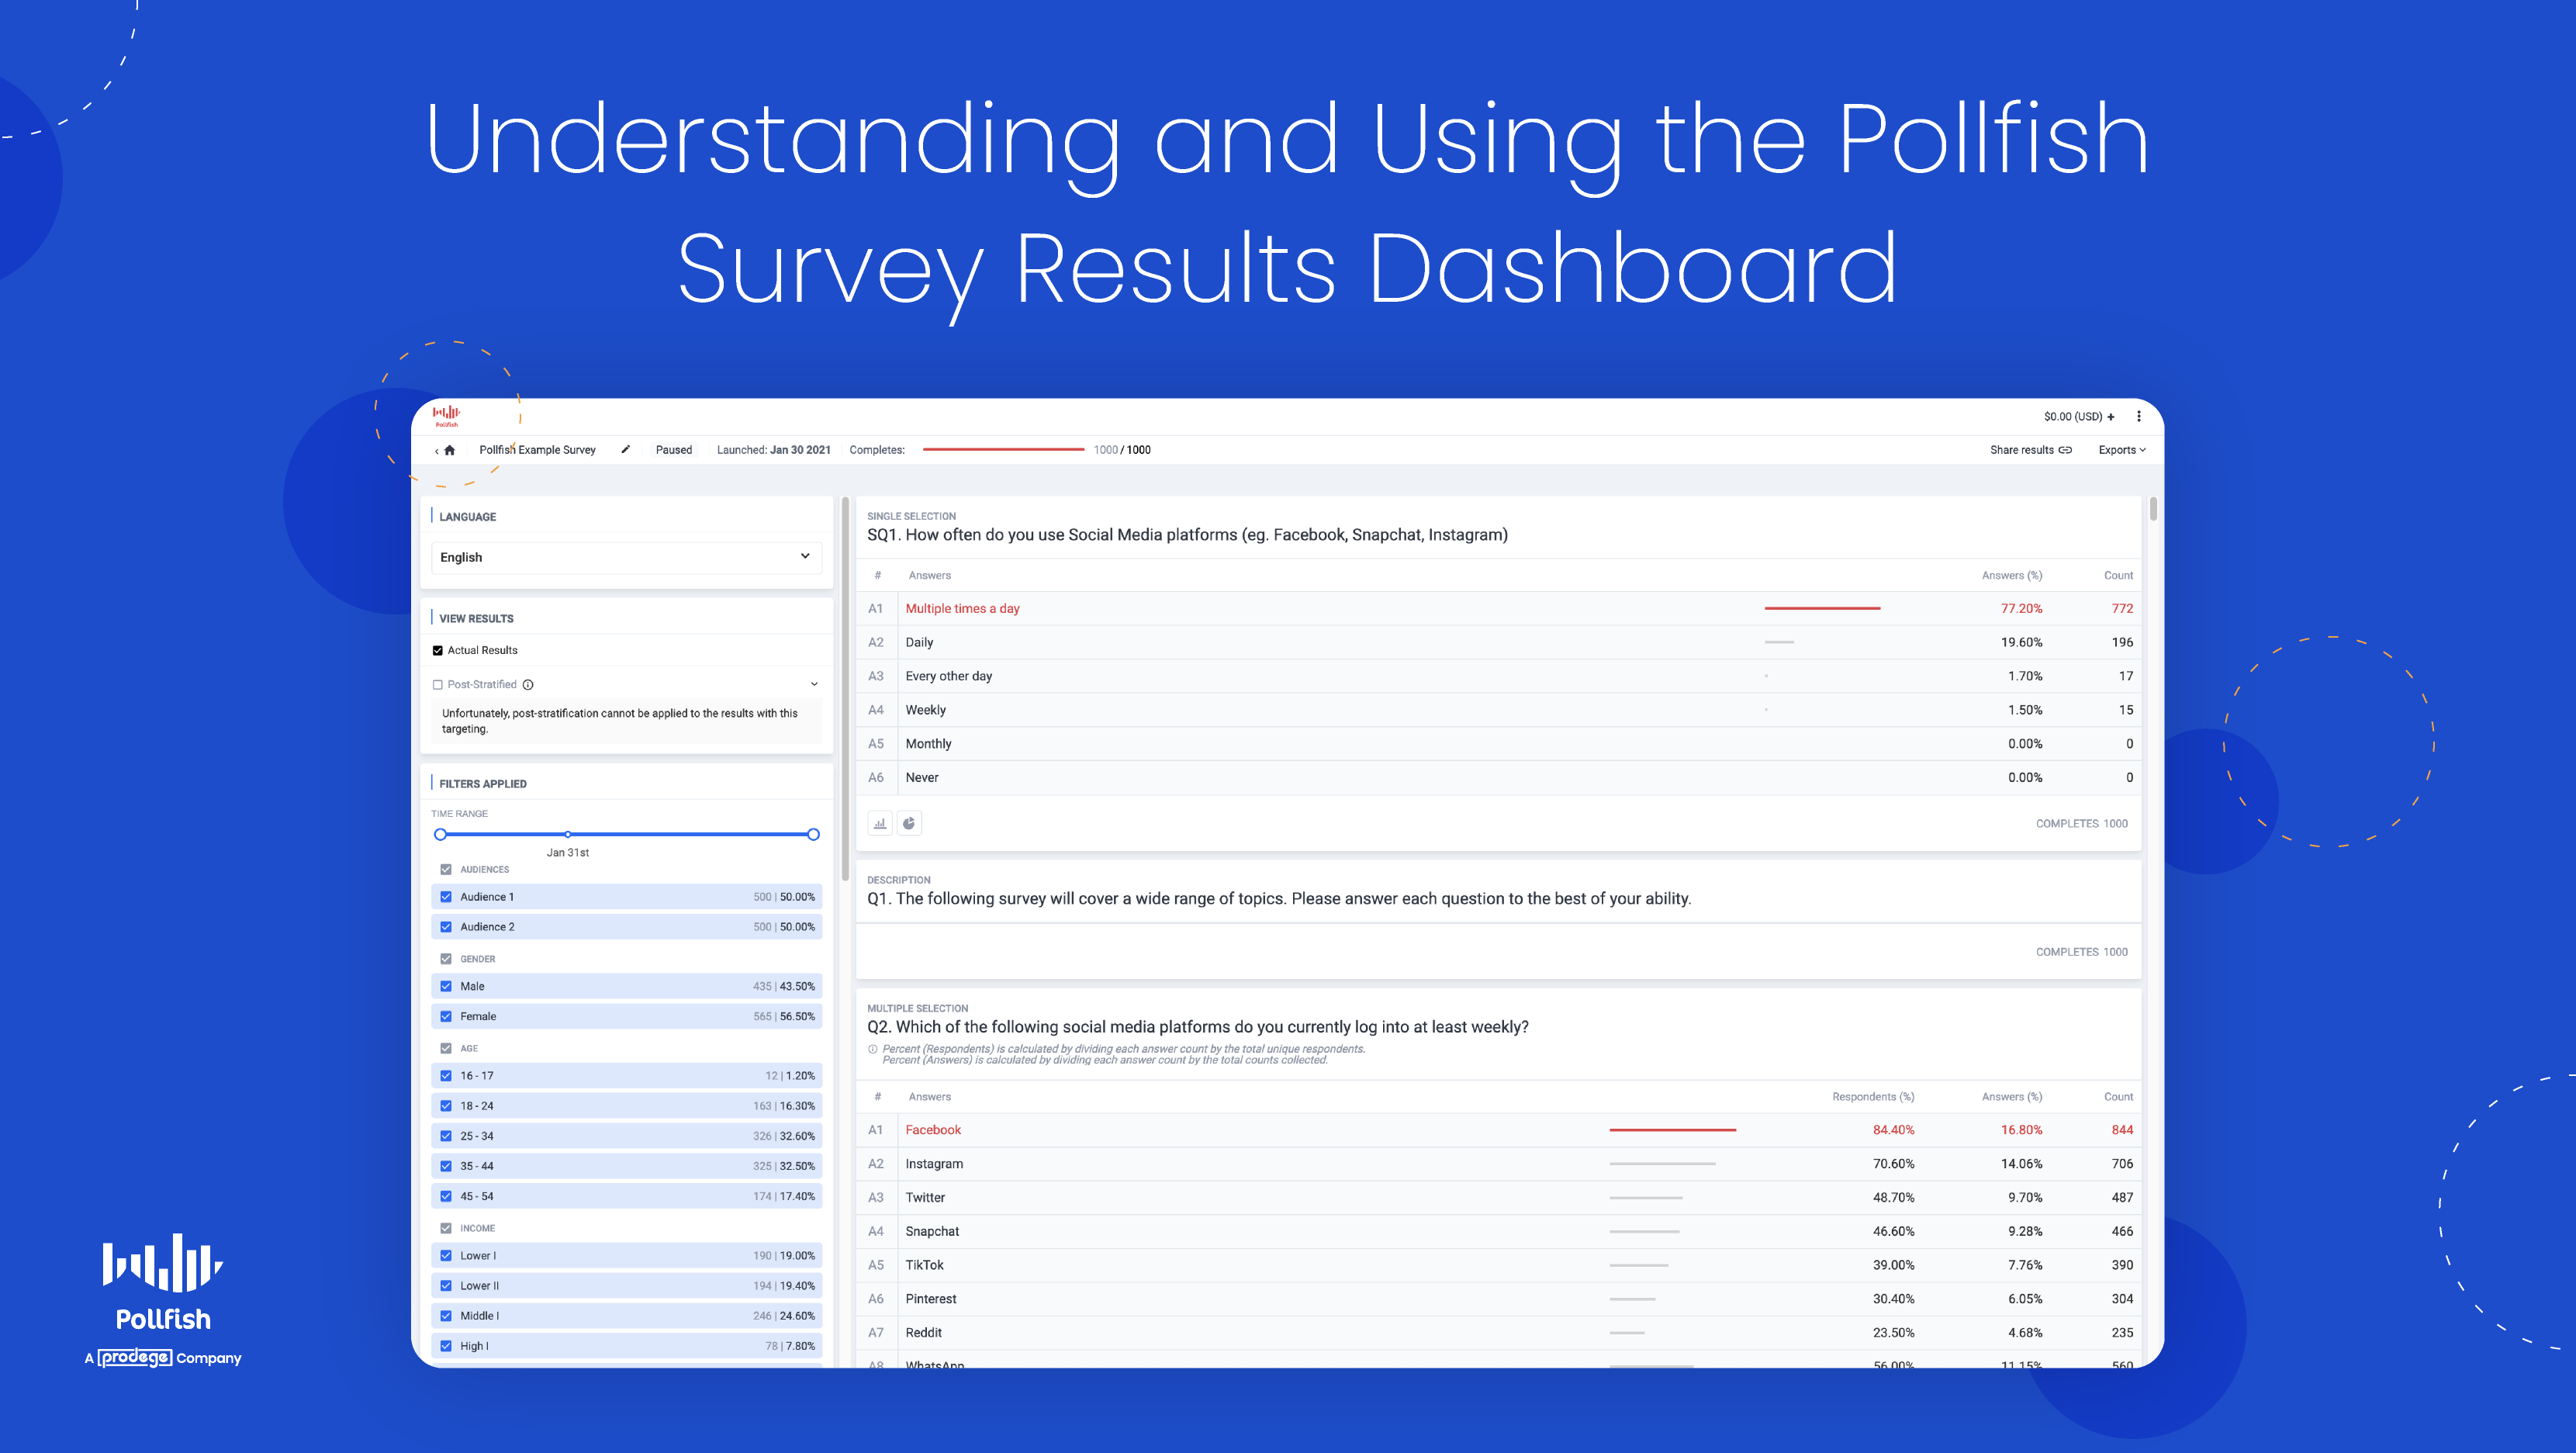
The survey results dashboard displays more than just the statistics of each question you ask. Instead, you’ll find a granular breakdown of both the answers and the audience targeting.
This dashboard contains several options to view your survey results. You can view them in basic table form, which displays the question, the answers and their respective count and percentage of respondents who selected each.
You can also view your results in more visual ways, such as by way of a column chart, filled with colorful bars, or through a pie chart, best suited for visual learners.
The survey results dashboard also provides several export options. These exports present additional ways in which you can view your survey data. Whether you want to download an Excel file with your survey data or analyze your data via Crosstabs, it can all be found on this page (on the upper right corner).
Remember, each such page displays all the data associated with one particular survey. However, there is a way to view all completed surveys in list form. (More on this in the How to Access the Survey Results Dashboard section below).
The Contents of the Survey Results Dashboard
We discussed the major aspects of the survey results page in the previous section. However, there’s more to consider, along with all the specific subcategories that come with the contents of this dashboard.
The following lists all the contents that you can find on the survey results dashboard:
- The launch date and number of completes (on the center top)
- The option to get a sharable link to the survey (on the upper right)
- Exports (on the upper right)


- Excel
- CSV
- Crosstabs
- SPSS
- The survey questions and answers
- The count of each answer & the percentage of respondents who chose it
- The ranking (if it’s a ranking question)
- Answer visualizations (aside from a table view)
- Column chart
- Pie chart
- 2 ways to view results
- Actual results
- Post stratified
- Post-stratification is a weighting method to achieve a distribution equal with that of known characteristics of a population. It can be applied to all supported categories, such as countries, ages, gender and income.
- A robust data filtering system
- Filter the results based on a wide variety of demographic/location/device filters. This allows you to learn how granular segments of the population answered your questions.
- Time range
- View results based on the time they came in
- Screening questions
- See how respondents answered based on their screening question
- Gender
- Filter by gender (male, female, nonbinary)
- Age
- Filter answers based on various age groups
- Location
- Filter results by country, county, state, US census region and more
- Employment status
- Filter answers based on respondents’ employment status
- Any other targeting filters you may have added
- Time range
- Filter the results based on a wide variety of demographic/location/device filters. This allows you to learn how granular segments of the population answered your questions.
- Visualizations based on respondent categories
- View tables, column charts and pie charts on specific categories such as ethnicity, language, marital status, income and other audience demographics.
How to Access the Survey Results Dashboard
There are two ways to access your survey results. We briefly explained the first way in the section on Understanding the Survey Results Dashboard. To reiterate in further detail, once your survey is complete, you will be notified via email.
This email contains a large blue button with the call out to “View survey results.” Simply click on this button and you’ll be taken directly to the survey results dashboard for the completed survey in question.
Here you’ll find all the contents of the dashboard, as laid out in the previous two sections. You can filter the results, view them in any of the supported visualizations and export them in your file of choice.
You can also access the results dashboard by visiting the general dashboard. Just go to https://www.pollfish.com/dashboard/. Here, you’ll get a bird’s eye view of all your projects. All your surveys will appear here in list form, by way of the name of each one.
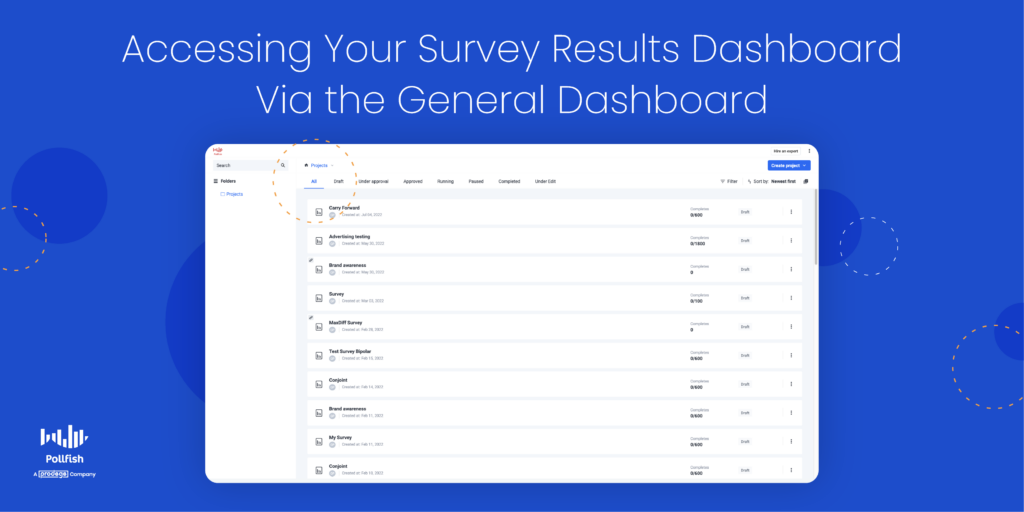
Notice that you’ll find the initials of the surveys’ creator(s) under each survey name. You’ll also see the date each survey was created, its number of completes (expressed as a number out of a preset total: 100/500), along with its status, such as draft or completed.
This page includes upper navigation in which you can view your list of surveys based on their status, for example, drafts, under approval, approved, paused, completed, etc. To view the surveys that have all their results in, click on the “Completed” tab.
This, in turn, will allow you to see a list of surveys that have been completed, meaning they have a survey results dashboard, which you can click on to view all your results data. By clicking one of these completed surveys, you’ll be taken directly to the survey results dashboard, which has all the information you’ll find by accessing it via email.
What You Can Do in the Survey Results Dashboard
By this point, we gathered that you can do five major things on this results page:
- View completed survey data
- Filter the data by demographics, time range, post-stratification and more
- Export the results in different formats
- Share the data through a link
- Quantify answers and draw conclusions
But there’s much more you can do with the survey results dashboard.
First off, you can conduct a survey data analysis and make observations with researchers, analysts and non-researchers and nonanalysts alike. After all, viewing and studying the data across tram members fosters a culture of data democratization.
You can conduct a market segmentation of your customers to categorize them into separate groups. Since your target market contains all the customers most likely to buy from you, it is often too broad to study on its own. Thus, you should segment your customers into smaller groups and personas.
Given that you can filter by demographics and screening questions, you can detect specific groups of customers and search for patterns in their behaviors and specific answers.
If you’d like to segment your customers even further, you can use your results dashboard to create an RFM analysis. An acronym for recency, frequency and monetary value, this kind of research method segments customers via these three customer behaviors.
In turn, market researchers and business owners can identify which customers are regulars, big spenders and which make one-time purchases. This allows you to distinguish between your customers, assign each customer numerical scores based on the three measures and grant an objective analysis of their value to your company.
Additionally, you can use the results dashboard to conduct research on your own organization, performing an internal assessment such as a SWOT analysis.
An acronym for strengths, weaknesses, opportunities and threats, this analysis allows you to identify these four aspects of your company, department or project, ideal for strategic planning and reducing any negative qualities.
It’s easy to do since all questions and answer data are clearly laid out and available to view in different formats.
Moreover, you can use your results dashboard to complete a market trend analysis, an important overview of your industry. Specifically, it is used to analyze trends in a niche market or an industry at large.
A market trend analysis is a method of analysis of past and current market behavior, featuring dominant patterns of a market and its consumers. It relies on examining statistical data and recorded market behavior over a defined period of time.
Your results dashboard is easy to access and view in different visualization, making it easy to compare market trends over a long period of time.
Finally, you can use your survey results dashboard to form a general customer behavior analysis.
This grants you insight into a swath of customer behaviors and their motivations, allowing you to understand how they tick and the reasons behind their purchases. You can delve deeper by studying their preferences among brands, brand loyalty and much more.
All in all, you can partake in numerous market research projects and perform various analyses thanks to the data filtering and visualization options available on the Pollfish results dashboard.
Getting the Most from Your Survey Results
Having access to a robust dashboard of survey results is key to performing a market research campaign and understanding your customers, or any population you seek to study, whether its your employees, students, readers, etc.
The Pollfish online survey platform is keen on optimizing both the respondent and researcher experience. Thus, it is designed to satisfy and ease the use of both parties.
Researchers can leverage a wide pool of insights in their survey results dashboard, which they can view in any way they please, whether it’s by studying the answers of certain demographics or viewing them in specific formats.
You should therefore opt for a platform like Pollfish, which offers artificial intelligence and machine learning to remove low-quality data and offer a broad range of survey and question types.
It also features advanced skip logic to route respondents to relevant follow-up questions based on their previous answers.
As a DIY survey platform, Pollfish puts you in full control of your survey campaign — from targeting, to deployment method, to the questionnaire and how your post-survey data is presented.
With a research platform containing all of these capabilities, you’ll be able to set up research campaigns your way, reap quality data and gauge consumers of any audience via a granular dashboard of survey results.
Discover the robust survey results dashboard on the Pollfish platform, a results page allowing you to view, filter and export survey results as granularly as you wish for a sublime research experience.

Market Research Panel Definition: All You Need to Know for Meaningful Market Research
Market Research Panel Definition: All You Need to Know for Meaningful Market Research
Have you ever considered using a market research panel to lead your research campaigns? This method is typically applied to market research, which is essential to understanding and satisfying your customers.
Market research is critical for all businesses, no matter how attuned you may consider yourself to be with your customers. The importance of market research cannot be understated; it helps you keep continuous tabs on your most important customers: your target market.
There are many routes you can take in the broad field of market research, as there are many market research techniques available. This includes primary and secondary methods of obtaining the research.
A market research panel is one such technique. This research method grants researchers participants who opt into a study, typically one that is conducted through multiple rounds of research, whether it is through surveys or other tools.
The panelists that make up the research panel are not randomly selected; instead, they are recruited and pre-screened.
Panels have various nuances that you ought to know about before selecting a research method, especially one that concerns how you’ll reach your target market. You should also compare panels with organic sampling, which is a different approach to identifying and gathering respondents for your research studies.
Luckily, this exhaustive guide allows you to do just that.
This guide explores the market research panel in full depth, delving into why it matters, how it is put together, their different types and much more. In addition, this article covers their drawbacks and how organic sampling is the better research method.
Table of Contents: How To Conduct A Survey That You Can Trust In 8 Steps
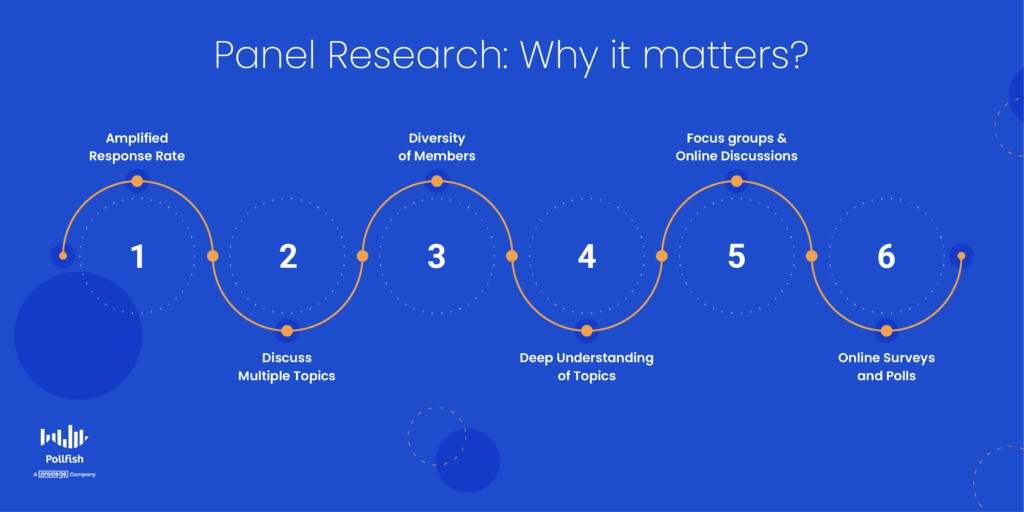
- Defining the Market Research Panel
- Market Research Panels: Why Do They Matter?
- How to Put Together Market Research Panels?
- The Need to First Identify Your Segmented Target Audience
- Market Research Providers and In-House Research Teams
- Determine your panel size
- Using Online Channels to Opt-In Potential Panelists
- Vetting Your Panelists
- Incentivize Your Panelists
- Carry Out Panel Research
- Maintain and Manage Your Survey Panel
- Are There Different Types of Market Research Panels?
- What Are the Advantages of Using a Market Research Panel?
- How Does an Online Market Research Panel Benefit Brands?
- Are There Drawbacks to Using an Online Market Research Panel?
- Combat Reduced Research Quality Using Organic Probability Sampling
- The Need for a Strong Market Research Platform to Leverage Organic Sampling and More
Defining the Market Research Panel
A market research panel can be defined as a selection of research participants, chosen specifically for market research purposes. But there’s much more to this.
A market research panel is a pre-recruited group of people who have agreed to take part in market research studies. These studies can be conducted through a variety of methods and tools.
The research tools and methods used with panels can include the following:
- Online surveys
- In-depth interviews (IDIs)
- Focus groups
- In-home use tests (IHUTs)
- Mobile ethnographies
- This involves studying customers in a natural environment but with the addition of technology to document and analyze real-time customer experiences.
- For example, it may use mobile ethnography app systems to conduct these studies. This allows you to remotely research human behaviors, journeys and experiences.
- Field research
Those selected to partake in a market research panel are usually used in more than just one research survey, even if they only enlist in one survey campaign. That means they can be expected to partake in several rounds of interviews, surveys, focus groups, etc.
This is why researchers who typically opt to reach participants via a research panel use the panelists to conduct longitudinal research. Longitudinal studies involve repeatedly examining the same individuals to detect any changes that might occur over a certain period.
Longitudinal studies are a kind of correlational research; researchers gather and observe data on a variety of variables without influencing the variables in any way.
This kind of research uses longitudinal surveys and can last years.
Despite being associated with the research of change and development, a market research panel can also be used in cross-sectional research. These kinds of studies deal with collecting research about a particular population at one fixed point in time. Due to the nature of this research, it is often referred to as a snapshot of a target population.
You can use a panel for this kind of research by using cross-sectional surveys.
A market research panel helps researchers better understand the strengths and weaknesses of – or sentiments towards – a particular product, service, brand, or message. Because researchers are often fact-finding on behalf of brands, these panels also can be known as brand research panels.
Market Research Panels: Why Do They Matter?
Market research panels matter for a variety of reasons.
First off, they provide both researchers and businesses who have no dedicated research personnel, with a go-to set of participants they can study firsthand continuously. This is critical, given that a major aspect of research is to target the correct audience in your study.
In market research, studying your target market is an absolute necessity. Panels provide easy and constant access to a target market sample, the pool of participants who represent your target market.

As such, the panelists are the research subjects, which is the crux of any research (unless you’re not studying humans). They are key to market research, as this research type is centered on understanding your customers to test the viability of any new product or service, and most importantly, sell to them.
Thus, the market research panel provides researchers et al. with a reliable group of research participants that they can turn to continuously.
This is a major convenience, given that it means researchers won’t have to scramble for research participants each time they need to conduct a research campaign. They also can rest assured that they’ll have research subjects to use in any ongoing research project, such as in longitudinal or prospective studies.
Aside from long-term research, panels can also be used in the aforementioned cross-sectional research studies as well.
In addition, panels provide businesses with a method to be more noticeable to their customers in an oversaturated market. Against the backdrop of social media and second screening, product owners, service providers and marketers are fighting tooth and nail to stand out in an increasingly crowded marketplace.
While some are becoming harder to differentiate, since many brands compete on similar price points and features, there is still one area up for grabs: a customer’s experience.
Thus, by designing a pleasant research experience and mentioning your business in the study, customers will associate their good memories during their research experience with your business.
In this scenario, the study itself serves as a marketing tactic to make your business resonate with its target market.
All in all, market research panels ensure you have constant access to your target market for your research study. They get to the heart of the matter of your area of study. The goal is to actively listen to and act upon the insights gleaned from your panelists.
Once you understand how your product or service makes your research panel feel, you can make the necessary changes to position your brand more effectively — irrespective of price or feature set.
How to Put Together Market Research Panels?
Today, market research panels are usually recruited via digital channels, as opposed to in-person scouting and interviewing. The latter is still possible, but not very common, given the ease, speed and prevalence of the Internet.
The following sections explain how to form, recruit and manage market research panels.
1. The Need to First Identify Your Segmented Target Audience
It’s important to ensure that you identify the target market segments you’ll need to include in your study before you recruit your panel. As such, we recommend conducting market segmentation first.
This way, you’ll know the distinct segments that make up your broader target market. In addition, performing segmentation allows you to identify your customer personas. These are fictional characters that represent unique members of your target market who fall under specific demographics, psychographics and the like.

You can conduct market segmentation with the help of market research software, particularly survey software. This will allow you to conduct surveys on any topic, including narrowing down your target market into segments.
Once you’ve segmented your target market and created various customer profiles, it is time to move on to determining the correct target audience.
Your survey target audience and your panel target audience specifically need to be determined before you recruit your panelists.
Your target market is not the same as your target panel audience
Keep in mind that neither your target market nor its segments are equivalent to the target audience of your panel. This is because a panel, like other research techniques, is centered on different topics.
Each topic may require different audiences.
You may have a survey campaign that relies on studying one market segment, or a few. Additionally, you may need to conduct another research campaign on another topic, one that involves different segments and customer personas.
Although you’ll be choosing from the same market segments, each segment will not satisfy or be appropriate for every panel study you conduct. Thus, your panel audience is separate from your market segments.
This is crucial and must be done before you reach out to your potential panelists.
2. Market Research Providers and In-House Research Teams
Once you’ve determined the panel audience you’ll need for your market research studies, you’ll then need to choose from one of two main options to put together your panel.

The first main option is to use market research panel providers that you have discovered and trust. Typically, this is done via the Internet. The panel provider would recruit and opt-in the panelists.
However, you and your team would still be involved in the process of targeting the panelists, as you would need to share your target market segments with the panel provider. Most importantly, you would need to inform them of your target panel audience.
As discussed in the previous section, these are not the same populations.
Alternatively, some businesses with in-house research teams find their panelists by releasing their ads and notices online. This is the second main option for creating a market research panel. You would need to enlist the panelists via your online platform of choice.
There are many options available for obtaining panelists in the digital space.
3. Determine your panel size
Before you recruit your panel, you’ll need to determine how many panelists you’ll need to participate in your research panel. To do so, you need to consider the following factors:
- Your ideal sample size,
- Your response rate
- The number of studies you intend to execute
For example, imagine you need 700 responses per survey; you have a response rate of 40%, and you’re seeking to run two studies each month. You’ll need to plug each variable into the following formula to find your panel size.
The panel size formula is:
(sample size per survey / (response rate) x (studies per month) ) x 100 = amount of panelists needed
(500 / 40% X 2 ) x 100 = 2500 panelists
Bear in mind that some people will not want to remain for the entirety of the study and will thereby leave. This is known as panel attrition. As a safety net for attrition, make sure to form a panel that consists of 10-20% more panelists than what the formula calculates as your ideal panel size.
Make sure you have all the requirements in hand before you start recruiting and aim to go 10-20% above your minimum number to cover you in case people opt out of your panel or you don’t hit your target response rate.
4. Using Online Channels to Opt-In Potential Panelists
There are a variety of online channels that you can choose from to obtain and opt-in your potential panelists.
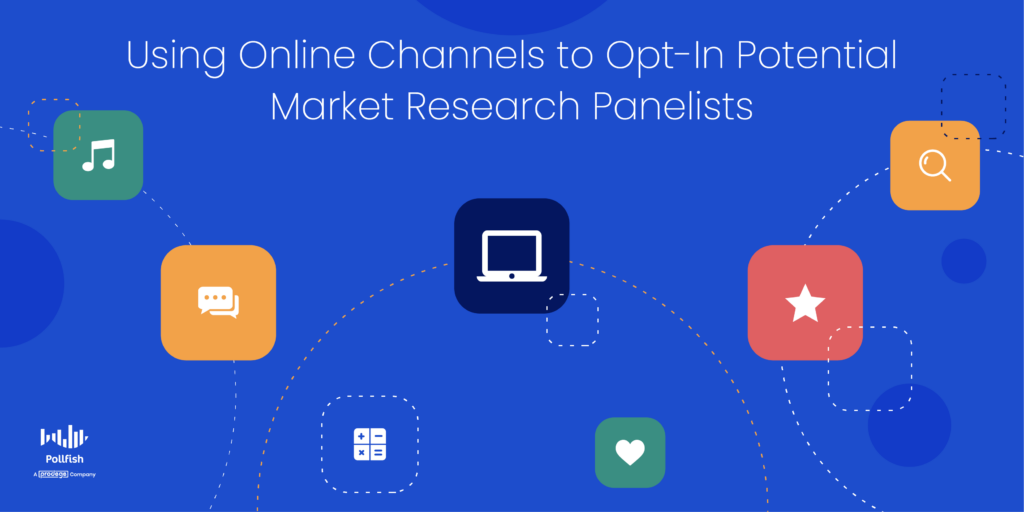
You can invite participants to join your panel through web ads, email lists, social media, website landing pages, homepages, or third-party app partners.
They would then be asked to opt in and complete an onboarding questionnaire, which helps to organize them based on certain distinguishable traits. such as age, gender, location, profession, and personal interests.
These can be — and oftentimes are — based on the potential panelists’ demographics, psychographics, behaviors and geographical locations.
5. Vetting Your Panelists
The questionnaire you use should vet your potential panelists on a wide range of traits and their subcategories. You wouldn’t want to enroll the wrong audience in your panel. In addition, you would want your panelists to align with all the requirements you determined for your panel audience in one of the previous sections.
As such, you should vet your potential panelists, those who opted in through any of the online channels you chose, with a rigorous set of panel criteria.

The following explains the criteria for choosing the correct research panel:
- Demographics
- This involves basic groupings based on the potential panelists’ gender, age, income levels, race, ethnicity, employment type, education, salary, etc.
- You can get as granular as you wish, provided you have the right tools to do so.
- Psychographics
- This involves the attitudes, interests, lifestyles, aspirations, values and other psychological criteria you would need to group your panelists by.
- It also involves whether they engage in particular customer behavior, such as frequency of purchases, brand preferences, consumer loyalty to certain brands, etc.
- Geographical locations
- This can include macro and micro-locations.
- As such, you may need to target panelists based on their country, state, territory, city, zip code and more.
- The granularity of targeting will depend on the kind of methods your panel provider or your in-house researcher team uses.
- Firmographics
- This category applies when you seek to form a panel of business personnel, which you will need for conducting B2B research.
- As such, it requires running B2B surveys.
- Assure that the company you aim to use panelists from matches the needs of your study.
- Demographics
6. Incentivize Your Panelists
Participation in a research panel is often incentivized. Few people would devote their time and efforts for free, not least for a continuous project, which most panels often are used for.
As such, remember to offer panel members rewards in exchange for their feedback and time. You’ll need to consult with your panel provider if you don’t recruit and work with your panelists yourself and are concerned about incentivizing them.
These rewards can vary from one vendor to the next but can be monetary or non-monetary. Thus, they can include cash, gift cards, vouchers, free subscriptions to a service and free products. You can also offer a points system in which panelists can redeem for goods and services.
7. Carry Out Panel Research
Now that you have formed a market research panel, it is time to use it for your various research purposes. You’ll want to first split your panelists into different market research campaigns and studies. As mentioned earlier, each panel study will require a different audience.
Therefore, before you begin conducting your research with your panel, make sure to assign it to its designated research campaign, its sub-campaign and its particular study. Once you do this, you can conduct your studies.
To reiterate, once you have put together your panel, you can choose from various research tools and methods. You can opt for surveys, focus groups, phone interviews, mobile ethnography, in-home use tests and more.
During your research sessions, make sure you record as much information from the panelists as possible. This is why using surveys is an ideal route, as they collect all the insights your panelists share, as opposed to experiments, product testing and focus groups.
8. Maintain and Manage Your Survey Panel
Managing your survey panel is not the same as recruiting it. It takes practice and best practices to ensure you maintain your panelists and build a strong relationship with them. They are people, after all, and not solely those who take your survey once.
As such, you should attempt to form strong connections with your panel. Whenever you reach out to them, whether it's over email or phone, be friendly and use language that makes your panelists feel important and appreciated.
Avoid sounding too generic and make your outreach personable — and personalized. Ask yourself, before you send any emails, if you would open the email, read it in its entirety and respond.
It’s crucial to ensure your research is easy to partake in, yet another reason to distribute surveys, as they take less time than field research, experiments and the like.
If you’re managing a panel in-house, you should consider assigning a designated person to manage the panel. Use someone from your business to keep in touch with the panel members and serve as the head of the panel.
Always keep your research promises to avoid panel attrition. This means, that if you’ve set a specific cadence of 1 study a month or 3 interviews per month, make sure to honor that cadence. Going above or below it will frustrate your panelists and make you untrustworthy.
It will therefore cause chaos in your study, which can easily lead to attention.
Are There Different Types of Market Research Panels?
Market research panels can be split into two main groups: B2B panels and B2C panels. There are many other subgroups within each category, but it is key to know their presence and differentiating qualities.
- B2B (business-to-business) panels are made up of business owners, professionals, industry experts, advisors and decision-makers.
- Panelists often respond to business-related surveys regarding industry type, segmentation, or market demographics.
- This kind of panel would require vetting members based on firmographics.
- B2C (business-to-consumer) panels comprise customers or end-users of a brand, product, or service.
- Businesses use these panels to access feedback from their target audiences.
What Are the Advantages of Using a Market Research Panel?
Online market research panels tend to be more popular than other, more traditional research methods. Often called legacy research methods, they usually take more time and effort to complete and don’t provide the same precision as a smart online survey platform does.
Take telephone interviews, for example. These require a lot of time and expense to run, and there’s no guarantee that the person answering the phone is 1) interested and available to speak, and 2) fits within the target demographic you wish to hear from.
Research panels, on the other hand, are made up of pre-screened individuals who have already opted-in to respond to surveys. This makes panels more cost-effective (and faster) to run.
Other advantages of market research panels include:
- Higher response rates: Respondents are motivated to take part in research and are less likely to be “caught cold” by a survey. This is usually because they’ve signed up themselves via an app or website, have subject matter knowledge they wish to share, or are incentivized by rewards, such as cash, vouchers, or points.
- Diverse viewpoints: A well-run, established research panel can be made up of any number of individuals from different backgrounds, professions, age groups, or locations. This level of variety allows you to mirror your specific audience during a research project.
- Reliable panel screening: The onboarding process of a panelist means their demographics are captured and categorized from the outset. This makes market segmentation easier and allows research panels to be convened quickly to gauge opinion or test the waters with a new product or service.

How Does an Online Market Research Panel Benefit Brands?
In addition to the advantages mentioned above, research panels have specific benefits for the brands and businesses that utilize them:
- It offers quicker research turnaround: If a brand has entered the final stretch of a product development initiative or marketing campaign, and wishes to check in with their target audience, pulling together a focus group at the last minute can be challenging – and expensive. Market research panels let brands access insights and feedback faster than other research methods.
- Multimedia elements can be included: Online market research panels can seamlessly include video, photographs, and sound clips to enrich the survey experience and provide a far better level of feedback. Using multimedia elements in other forms of market research can range from difficult to impossible.
- Products/services can be tested with real end-users: Before releasing products or launching services to the wider market, brands can test them with a facsimile of their target audience. Panels allow brands to gather actionable insights quickly, gauging sentiment and performance in the process.
Are There Drawbacks to Using an Online Market Research Panel?
While market research panels do benefit both analysts and brands alike, they’re not immune from some glaring pitfalls. You should be aware of them before selecting this method for conducting research.
- Limited to those with internet access: As the name suggests, an online market research panel requires internet access. This is fine if your target audience is from a country where the internet is easily affordable and accessible, but if you wish to learn more from an older and/or remote group of people, it’s perhaps not the best research method.
- Risk of duplicate respondents: People who enjoy participating in surveys (or are motivated to do so via incentives) will likely sign up for multiple survey vendors. This can result in the duplication of responses, skewing the data in the process. While some vendors will do their best to remove duplicate respondents, it’s still important that the data is scrutinized.
- Risk of poor data quality: Speaking of data, surveys can attract a range of less desirable respondents, motivated solely by incentives and with no interest in sharing considered opinions and feedback. Speeders, straight-liners, survey professionals, fake accounts, bots, and more, these types of panelists can quickly derail a survey.
- Acquiescence bias and other biases: Also called agreement bias, acquiescence bias occurs when panelists are inclined to provide only positive or agreeable answers. With this bias, respondents feel more social pressure to answer in a particular way, as their identities are known to your business or the panel provider.
- Longer recruitment and vetting periods: It doesn’t take a few minutes to vet and recruit a panel. That’s because you would first need to target its members, have them opt-in, review their self-identifying questionnaires to confirm their qualifications and ensure you have the required panel size before you even form the panel, let alone conduct the research with it.
Combat Reduced Research Quality Using Organic Probability Sampling
Although research panels can deliver a range of benefits, the market research panel definition we shared at the start of this article only tells part of the story.
While these panels are largely comprised of motivated research participants — survey participation has been on the wane. This means the quality of research panels is fast becoming compromised as traditional companies scramble for participants from anywhere and everywhere.
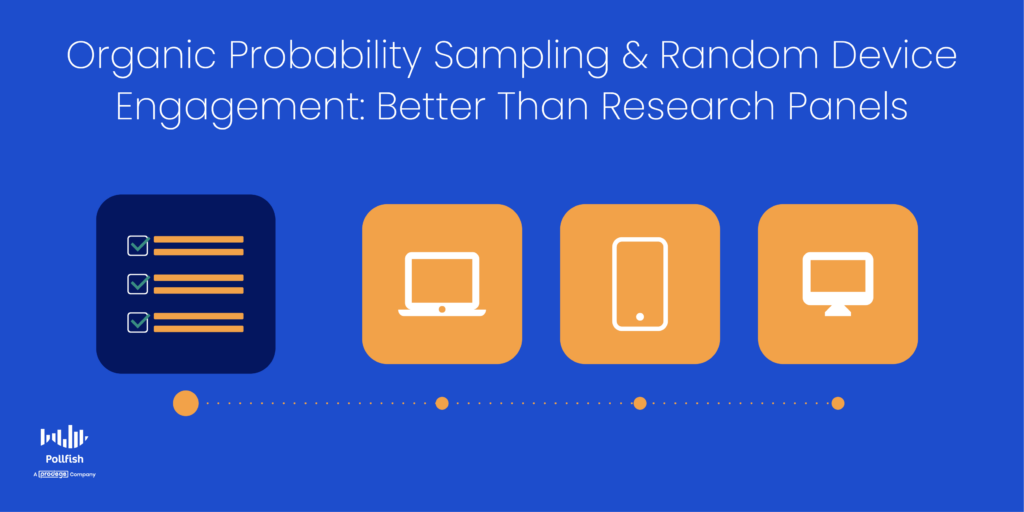
At Pollfish, we avoid using conventional panels for this very reason. Instead, we’ve developed our very own market research methodology called Organic Probability Sampling. This involves sourcing our audience of real consumers via partnerships with app publishers, which allows us to conduct randomized, yet highly targeted surveys to verified respondents.
Our unique process is known as Random Device Engagement, (RDE), which uses the organic sampling approach for finding and obtaining survey participants.
This randomized method of reaching respondents ensures you avoid acquiescence bias from respondents, due to the anonymous nature of this route.
In addition, it allows you to steer clear of the sampling bias, which occurs when the respondent selection process is not conducted at random, which then leads to under or overrepresentation of a certain market segment.
A kind of organic probability sampling, RDE polling relies on advertising networks and other digital platforms to engage potential respondents wherever they visit voluntarily. This includes a variety of digital platforms and properties, such as:
- Mobile sites
- Apps
- Website
- Mobile games
With over 250 people in our network, we never have to worry about data quality, delivering only the best, most authentic, and most useful insights to our clients.
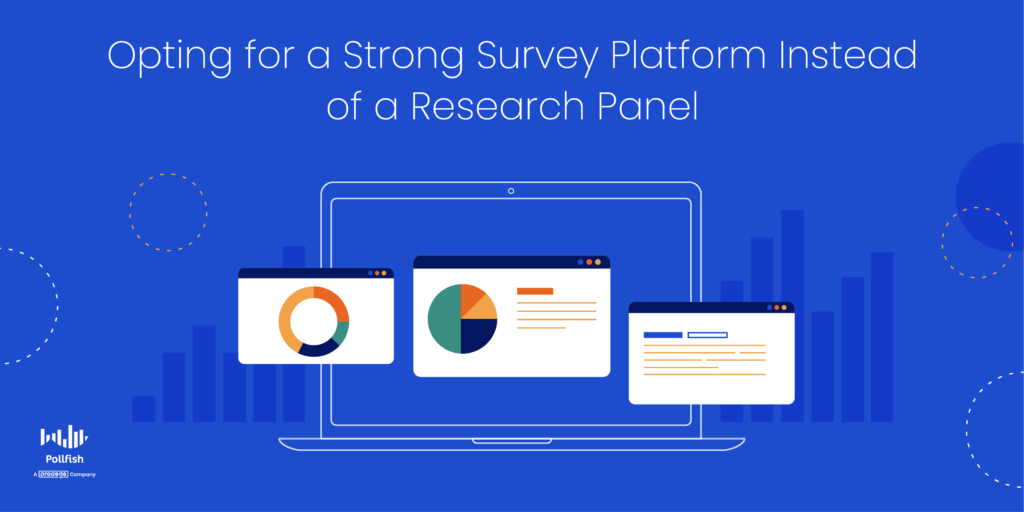
The Need for a Strong Market Research Platform to Leverage Organic Sampling and More
Our final word involves highlighting not merely the importance of organic sampling and RDE, but the need to leverage the right online survey platform to carry out your entire research campaign.
A potent online survey provider, one that offers enterprise survey software will do all the heavy lifting for your market research campaigns. That’s because such a platform doesn’t simply facilitate creating surveys.
Instead, it allows you to hyper-target your survey audience, set quotes, reach populations from far and wide and ensure your survey gathers the exact amount of respondents as you input into your audience requirements section.
It would enable you to target respondents based on screening questions, along with inputting a large swath of respondent qualifications, including the four main categories of demographic, psychographic, geographic and firmographic identifiers.
In addition, a strong survey provider grants you options aside from the Random Device Engemanet method of reaching respondents. Instead, it should also afford you the option to survey specific people, via the channels you specifically choose to deploy your surveys through.
This includes using channels such as via email, or whichever digital channel you seek to use. Fortunately, we offer the Distribution Link feature, which allows you to do just that.
All in all, a strong survey platform that offers random sampling through RDE and a variety of market research features and tools trumps market research panels.
Luckily, the Pollfish platform uses the RDE method and offers a variety of market research features such as A/B testing, conjoint analysis and much more to ensure a quality research campaign and avoid survey biases and fraud.
A market research panel is a group of individuals who have been recruited to take part in market research, which may include surveys, online panels, or in-person panels. B2B (business-to-business) panels focus on the relationship between two businesses and may consist of business owners, industry experts, and other professionals. B2C (business-to-consumer) panels focus on the relationship between the business and their target market (the consumer). B2C panels will consist of members who represent that target market. Online market research panels are more popular than their traditional counterparts for several reasons. Online market research panels are most cost-effective, faster to deploy, have higher response rates, provide better data sampling, and allow for diverse viewpoints to be heard. Online surveys can attract individuals who participate in surveys solely for the incentive or reward. These respondents are less motivated to share genuine opinions. There is also the risk that fake accounts and bots could be used to game the system. The results gathered through online market research panels can be improved by using organic probably sampling, a market research methodology developed by Pollfish. This approach sources survey respondents who are motivated to participate for genuine reasons.Frequently asked questions
What is a market research panel?
How do B2B market research panels differ from B2C panels?
What are the advantages of an online market research panel?
Why is poor data quality a risk of online market research panels?
How can you improve data quality of online market research panels?

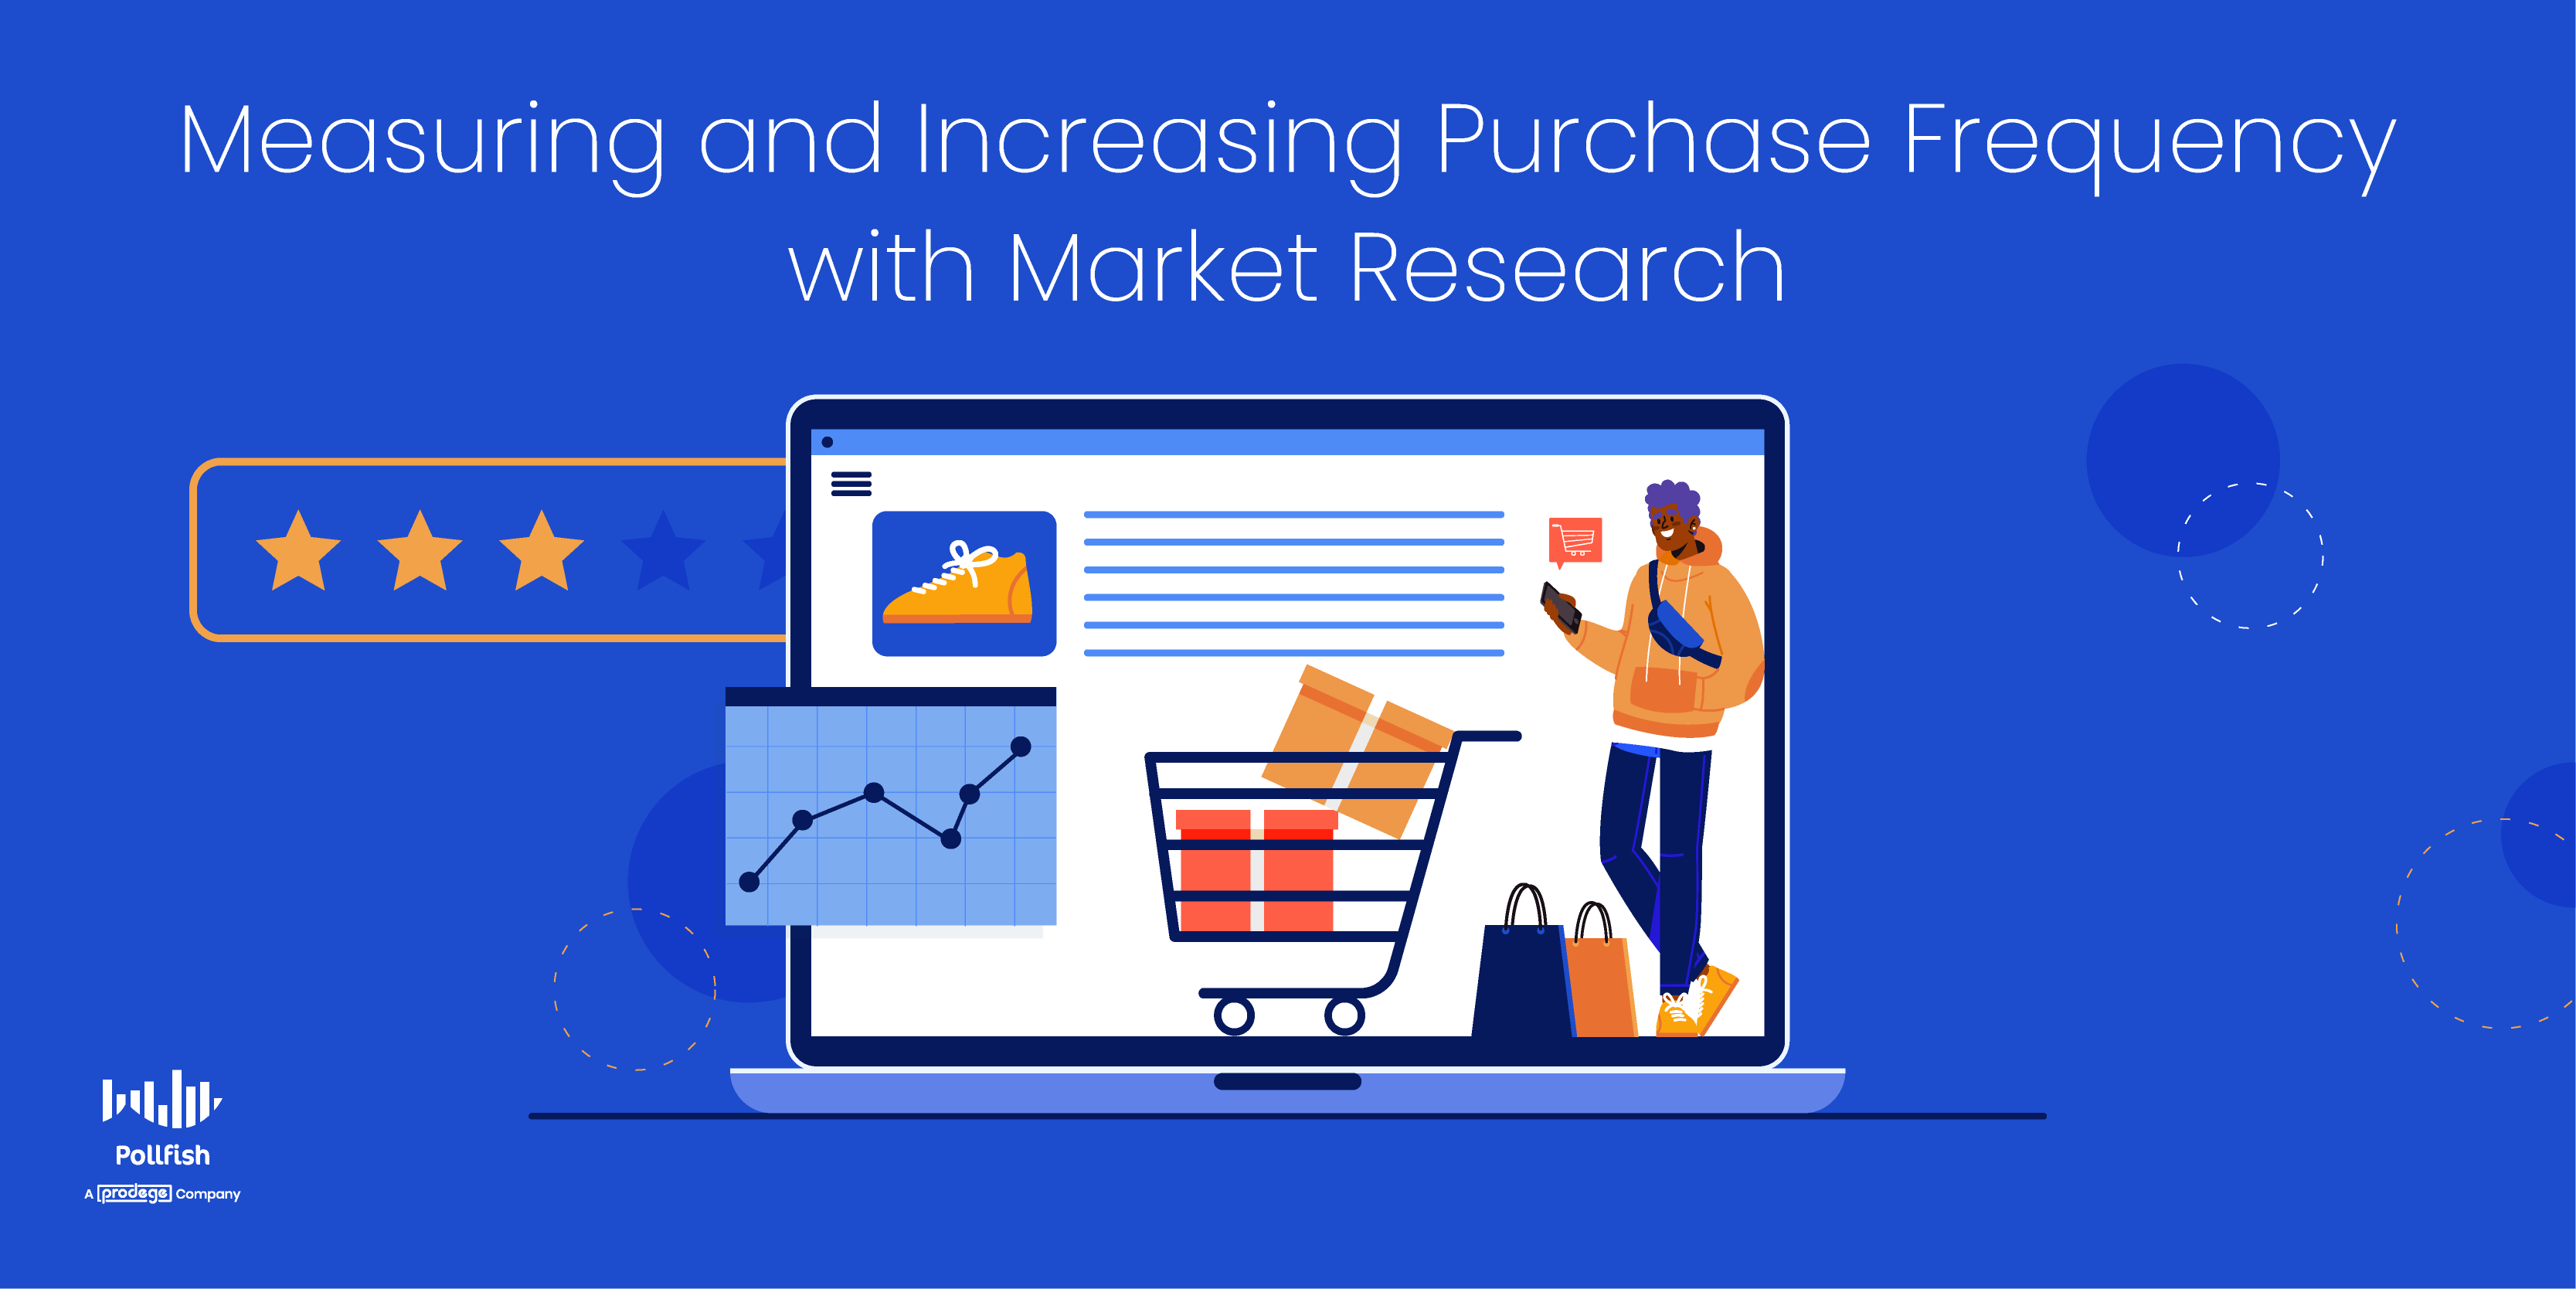
Measuring and Increasing Purchase Frequency with Market Research
Measuring and Increasing Purchase Frequency with Market Research
It’s essential to measure purchase frequency and its associated metrics, as these grant insights beyond their obvious measurement. That’s because evaluating this frequency allows businesses to evaluate and even track the intangible concept of consumer loyalty.
The importance of consumer loyalty cannot be stressed enough; it should be the ground rule of any business to build a base of loyal customers, as they buy from a company longer and provide a higher customer lifetime value.
In fact, 65% of a company’s business comes from existing customers. This represents the bulk of a company’s business, proving the value of customer retention. In addition, 43% of consumers spend more money on brands they’re loyal to.
As such, brands should be keen on keeping track of their purchase frequency and attempt to raise it to build customer loyalty and profitability.
This article expounds on purchase frequency, how to measure it and its key associated metric, and how to use market research to not simply measure it but increase it.
Understanding Purchase Frequency
Purchase frequency is a metric denoting the number of times an average customer buys a product or service from a single seller in a given period of time. It is one of the three key metrics that make up an RFM analysis, a technique used to estimate and analyze the value of customers based on the three data points of RFM.
RFM is an acronym for recency, frequency and monetary value. A kind of consumer analysis, it is used to segment customers based on these three factors that make up customer buying behavior. It allows market researchers to segment their customers to identify big spenders and infrequent buyers.
Purchase frequency helps businesses understand the success of their products and services, along with mapping out customer loyalty and its underpinning rate: customer retention rate. This is because loyal, aka retained customers, tend to buy more.
Not all sectors and their respective offerings have a fixed purchase frequency. Some consumer packaged goods, such as laundry detergent or mustard, have a relatively fixed purchase frequency. For example, some people buy lunch every day or soap weekly.
Products that are made to last for long periods of time, on the other hand, tend to have an intentionally lower frequency rate. This is self-explanatory, whether you are cash strapped or wealthy, it would be unwise to regularly buy something built to last years. (Take a refrigerator, for example).
In all, purchase frequency determines, on average, how many times a customer makes a purchase from a business and can be used for various purposes.
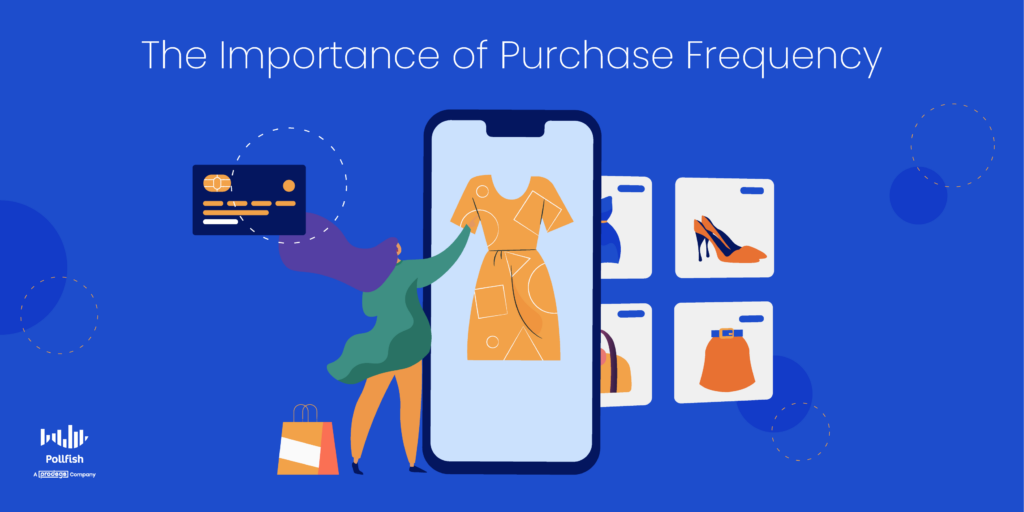
The Importance of Purchase Frequency
Purchase frequency is crucial to measure, keep track of and increase.
First off, purchase frequency ties directly into profits and the higher your frequency, the higher your profits will be. But the importance of this metric goes beyond its self-evident reasons.
The frequency of purchases is directly related to customer retention, since those who continue buying from you are the customers you can count as regulars, or repeat customers. Retention is important for maintaining continuous profit and consistent growth.
This is in part due to the fact that repeat customers spend 300% more than new customers. Aside from being more valuable, retaining your customers is also more cost-efficient, as it costs 5 times less to retain a customer than to acquire a new customer. As such, it is key to measure and sustain a high purchase frequency, as it is an indication of customer retention.
Piggybacking off of customer retention is the fact that a high purchase frequency is a marker of consumer loyalty. After all, why would any customer continue buying from the same brand if they were dissatisfied with its products, services or general CX? While they may continue buying the same product due to their needs, they would certainly switch brands if they experience a bad CX, or are generally dissatisfied.
Switching brands is a customer habit, which leads to another reason behind the importance of this metric. This is because determining this frequency is a part of market segmentation, the practice of segmenting consumers into distinct groups based on various shared characteristics. This is key, as it helps you organize and understand the makeup of your target market.
As such, you’ll be able to determine how often certain segments and customer personas make purchases from your brand and whether they use other brands to fulfill their needs. This enables you to form your marketing strategy around your segments’ habits.
In market research, understanding how often a consumer makes purchases within a given category gives a sense of their engagement with a brand. This will let you know where they stand in the sales funnel and how much nurturing they’ll need to purchase more.
Finally, purchase frequency data shows you critical insights into the timing of your purchases. This is because by examining it, you’ll understand the exact days and times of the day in which the most purchases occur.
This kind of data is especially necessary for logistics, inventory management and supply chain processes, as these aspects of business and their employees would need to know this information to ensure you never run out of items and can operate smoothly.
You can identify the customers that purchase the most and develop rewards programs in order to retain them.
How to Calculate Purchase Frequency
You can calculate the purchase frequency of your existing customers via two calculations, which represent different variations of purchase frequency. The first is the general purchase frequency formula; the second is the repeat purchase rate. Although they both reveal the regularity of customer buying, they represent two distinct concepts. The following explains their key distinctions.
Purchase Frequency Versus Repeat Purchase Rate
Purchase frequency
- Called a “laggy metric” because customers often make frequent purchases over a longer interval of time.
- This can be calculated from existing customers.
- This means that It is typically more accurate to measure purchase frequency over long periods of time, such as up to 12 months.
- Purchase Frequency Formula
- Customer purchase frequency = Number of orders ÷ Number of unique customers
- Remember to first calculate both of your variables. The former is the total number of processed purchase orders for your company.
Repeat Purchase Rate
- In contrast, to the above, the repeat purchase rate shows you the proportion of your customers that have purchased from you at least twice.
- This can be tracked more regularly, such as bi-weekly, weekly or even daily.
- An increase in the repeat purchase rate is always good news.
- It points to an improvement in customer retention, signifying that you’re providing your customers with great value.
- Repeat Purchase Rate Formula
- Repeat Purchase Rate = Number of customers who have purchased more than once in a year ÷ Total number of customers in a year
- There’s no definite rule to determine whether your repeat purchase rate is good or not; that depends on your industry and niche.
- Low-cost products tend to have a higher repeat purchase rate than high-value items intended to last.
- If you sell expensive goods, you should still aim to increase the repeat purchase rate for your sector.
How to Use Market Research to Measure and Increase Purchase Frequency
Calculating the purchase frequency and repeat purchase rate is far from enough when it comes to context. Although it is important to calculate the purchase frequency, it is not the end all be all when it comes to understanding this frequency and the habits and situations underpinning it.
This is because as metrics, these two calculations will show you the quantitative what, but not the qualitative why and how.
As such, you may learn how often certain customers shop from you, but not any of their reasons for doing so. This includes a swath of factors behind the frequency of their purchases, such as personal consumer preferences, purchasing power, financial environment, employment status, usage of the product, and various others.

Conducting market research is the answer to this lack of context. You can begin by first conducting secondary research on the typical members of your target market. This is useful, however, not all sources are accurate specifically to your consumers. In addition, some secondary sources may be outdated and don’t answer the specific questions you need for your business.
The most valuable form of market research is primary market research, as it allows you to extract all the information that’s most relevant to your business and market research study, yourself. When you’re mulling over syndicated research versus custom research, you ought to opt for custom research, specifically a market research platform, as it grants you complete control and ownership of your study.
An online survey platform specifically allows you to both measure and increase your purchase frequency. In regards to the former, all you have to do is ask the question of how often your customers make purchases. You can frame an entire survey on this, asking questions on the frequency that differ by specificity.
As for the latter, you can increase both your purchase frequency and repeat purchase rate with an online survey platform. This is because surveys provide a convenient and timely way to study your customers. They provide you with quick access to all of their needs, wants, aversions, expectations, preferences and opinions.
This allows you to innovate your products, structure your marketing campaigns better and improve your overall customer experience. When you optimize across all of these areas, you will improve your customer satisfaction, thereby developing brand trust and customer loyalty.
Increasing Purchases with Polling Software
Since surveys empower you with critical customer intelligence, you’ll be able to effectively measure and increase your purchase frequency. But you’ll need to be selective of the polling software you use for this campaign and all other market research campaigns.
Opt for an online survey platform that makes it easy to create, deploy and consumer surveys. Such a platform should offer random device engagement (RDE) sampling to reach customers in their natural digital environments instead of pre-recruiting them.
Your platform should have a mobile-first design since mobile dominates the digital space and nobody wants to take surveys in a poorly-built mobile environment.
Your online survey platform should also offer artificial intelligence and machine learning to remove low-quality data, disqualify low-quality data and offer a broad range of survey and question types.
The survey platform should offer advanced skip logic to route respondents to relevant follow-up questions based on their previous answers. It should also make it easy to form a customer journey survey to survey your respondents across their customer journeys.
Additionally, it should also allow you to survey anyone. You’ll need a platform with a reach to millions of consumers, along with one that offers the Distribution Link feature. This feature will allow you to send your survey to specific customers, instead of only deploying them across a vast network.
With an online survey platform featuring all of these capabilities, you’ll be able to adequately measure and increase your purchase frequency.

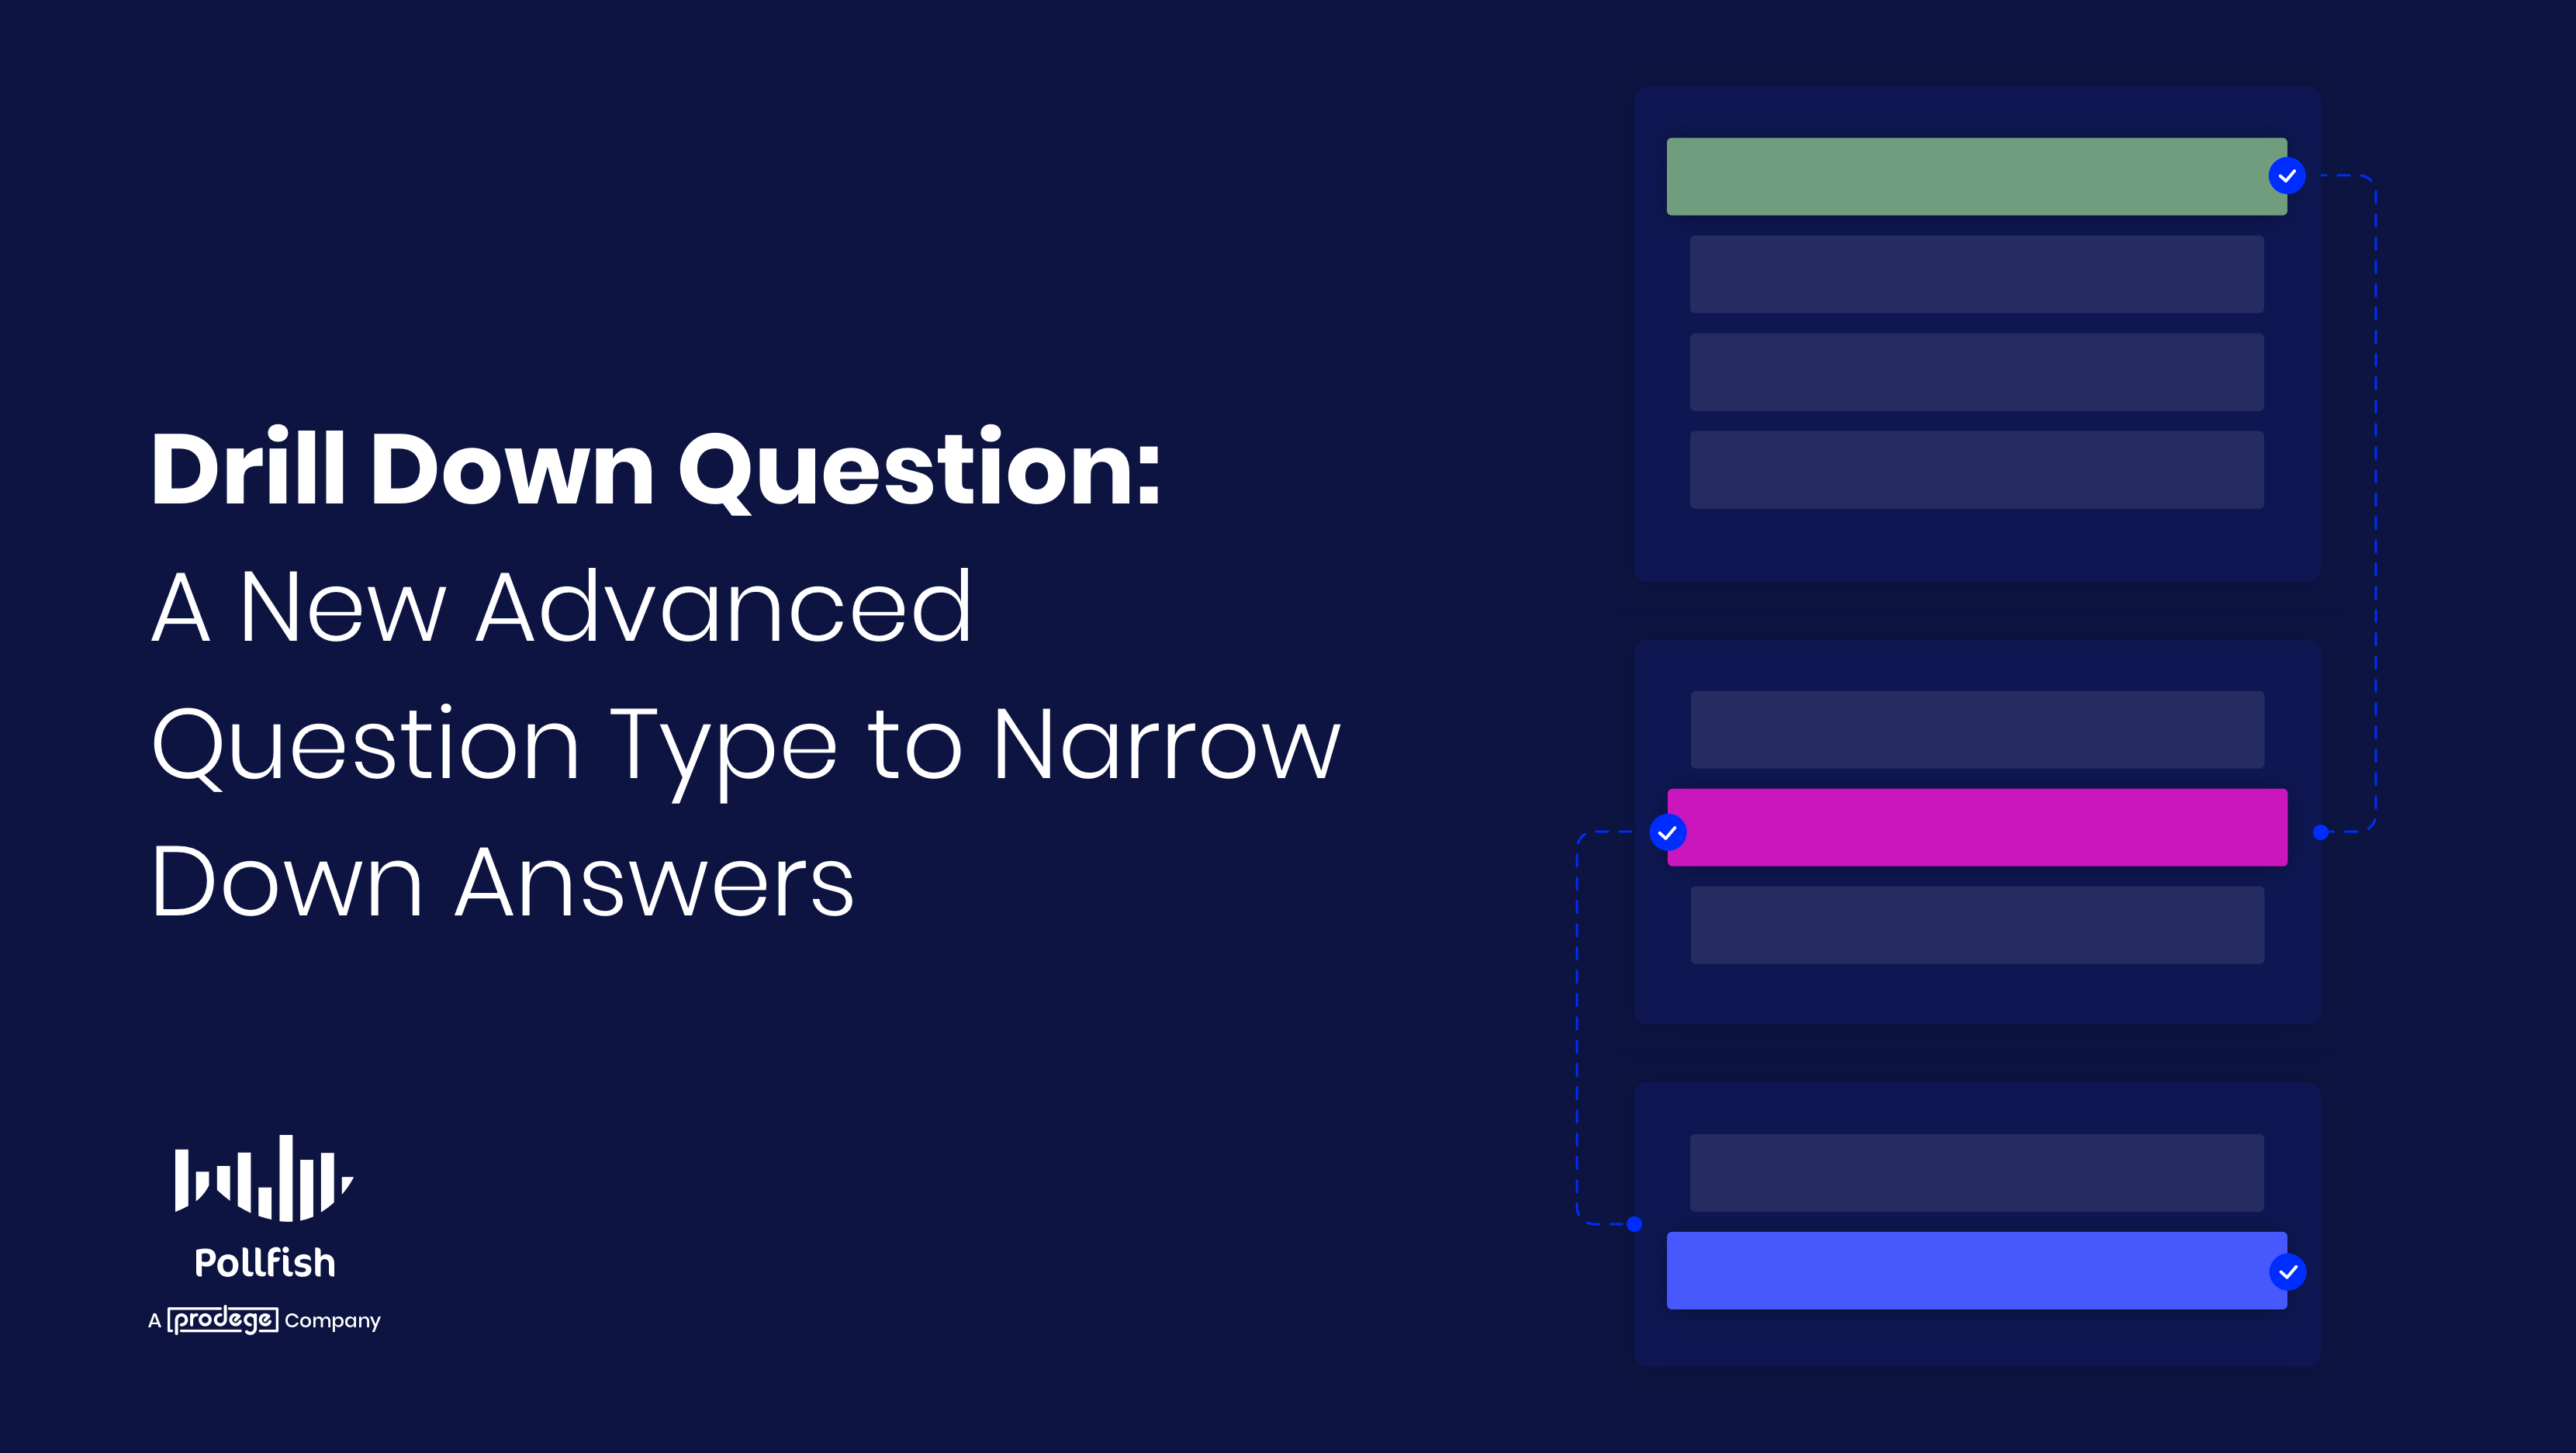
New Question Type: Drill Down Questions to Improve Respondent Experience and Data Quality
New Question Type: Drill Down Questions to Improve Respondent Experience and Data Quality
Drill down questions are useful for instances in which you want to ask your target market or target population a question that includes multiple options. This does not necessarily entail a large number of multiple choice answers, but rather multiple prompts that relate to one question topic.
This allows you to include various inquiries into one question, without needing to worry about the relevance of the questions. As such, you can dig deeply into one topic with one question, by adding multiple relevant follow-up questions.
This method is not simply useful to collect better data, but to improve the survey respondent experience. 49% of consumers have left a brand in the past year due to poor customer experience. You should therefore always strive to provide a good CX for your customers.
Given that you’ll be largely studying your customers, surveys grant you an opportunity to give your customers a good CX on yet another touchpoint.
This article explains drill down questions, their importance, examples and how they appear on the Pollfish online survey platform.
Understanding the Drill Down Question
The drill down question is used to help respondents choose from a list of options, with each option existing as a kind of prompt. Usually, respondents answer the prompt by selecting from a drop-down menu.
That is to say that the drill-down is not a primary question with follow-up questions, but a set of dropdown selection menus hierarchically defined.
As such, the drill-down question is a question type used to narrow down a respondent’s choice from a broad to a specific answer. Therefore, it involves multiple prompts, which exist as relevant follow-up questions, each presented with its drop-down menu.
With each following question (or prompt), the topic under investigation, i.e., the one that is originally asked about, gets more and more narrow. In this way, the researcher gets to drill down on the topic, hence the name of this question type.
First, your respondents choose from a general drop-down list. Then, based on their answers, they are presented with specific follow-up prompts with lists as a means to “drill down” their answer. In this way, the respondent is providing data that starts at the general level and becomes more specific with each follow-up prompt or list.
For example, you could first have respondents select a car brand, then they would select a car model and finally, they would choose the year of the car’s manufacture.
The Importance of the Drill Down Question
This kind of question is important for a variety of reasons.
First off, the drill down question type should be used when you need your survey participants to respond to multiple interdependent questions. This is important as it not only organizes and sets up your questionnaire in a more logical (and relevant) way, but it also allows you to ask multiple relevant follow-up questions right under one question.
This will ward off boredom and frustration from repetition, as some respondents may grow tired of seeing what’s essentially the same topic being asked of them continually in the questionnaire.
Instead, you can group that topic under one question, by setting up different follow-up drop-down lists (or prompts) in it.
In addition, you’ll be able to evade different types of survey bias, namely the survey scope error. This bias arises when a survey does not include important items required to fully answer the topic of study. Failing to ask important questions on certain aspects or sub-topics will result in respondents giving incomplete or inaccurate answers.
This will tarnish your survey campaign and your overall research study. While the survey scope error may appear daunting to avoid, it can be done with drill down questions, as they allow you to include a variety of follow-up questions relevant to the main topic at hand and its various subtopics.
This makes it easy to include all essential survey questions while curbing the length of the survey. Regarding the latter, this is possible, as these follow-up prompts exist as drop-down lists, which are easy to select.
What’s more, is that these questions are essentially another major way to include relevant follow-up questions. Thus, they can be used as an alternative to advanced skip logic. This survey method routes respondents to proper follow-up questions, based on their answers to a previous question.
Drill down questions grant you the same capability, the only difference being adding follow-up lists per a single major question. Skip logic instead redirects respondents to new questions, those that are not bound under one main question.
The drill down questions also make for a more engaging survey experience for your respondents, who, as aforementioned, are usually going to be your customers.
Rather than setting up questions in a boring multiple-choice setup, drill down questions to create a more visual and simple way to answer a question.
They are also more inclusive in terms of answer options, as you can add a long list of answers per each drop-down menu in each follow-up prompt. Because of this, these questions help you build customer convenience while gathering critical data on consumer preferences.
All in all, this new question type will provide you with a strong means to collect relevant survey data and improve your survey respondent experience.
Drill Down Questions on Pollfish
This question type brings a new interface to the Pollfish platform. That’s where drill down questions can play a pivotal role.
To reiterate, the drill down question type helps you gain more in-depth data from your respondents. An advanced question type, it is powered with built-in logic to allow you to retrieve answers quickly.
Instead of presenting respondents with a long list of options, drill down questions include a functionality that lets you narrow down the options through a step-by-step way, or rather, by way of multiple prompts.
How to Use Drill Down Questions on the Pollfish Platform
To use this kind of question, you must first go to the questionnaire section of the dashboard. On the left-hand panel or by using the “Add new question” button, choose the Drill Down question option.
Pollfish offers 2 ways to add the drill down values, either by uploading from an Excel/CSV file or by adding the values manually. Pollfish demands the values to be added in a row-like format delimited by columns (in the Excel) or by commas (in CSV or manual).
Importing via Excel or a CSV file
- In the Excel editor, add a column for each dropdown to add to the question. The 1st row must contain the dropdown labels, which you can later edit if needed on the questionnaire page. In the following example, the drill down question will contain 3 dropdowns, narrowing down from the country level to the city one.


- Then, include rows that represent each possible combination of the dropdown values. Some of the values can be repeated, eg. in the following screenshot. For example, since we need to add different states and cities of France, the country category “France” is repeated 4 times.

- (Important) Consider checking the structure of the file before uploading, as any malformed rows (containing a fewer number of values than the number of labels) will result in an error.


- You can save the file as an Excel or CSV and then upload it to the Pollfish questionnaire. Click on the drill down question.


- Select to upload via the “Upload a file with pre-filled options of drill down” and proceed with uploading the file you previously created.


- Once uploaded you can both check the number of different unique values added per dropdown and preview the flow of the question.


- Once the survey has gone running, the drill down question dropdown values cannot be edited, only the labels are editable.
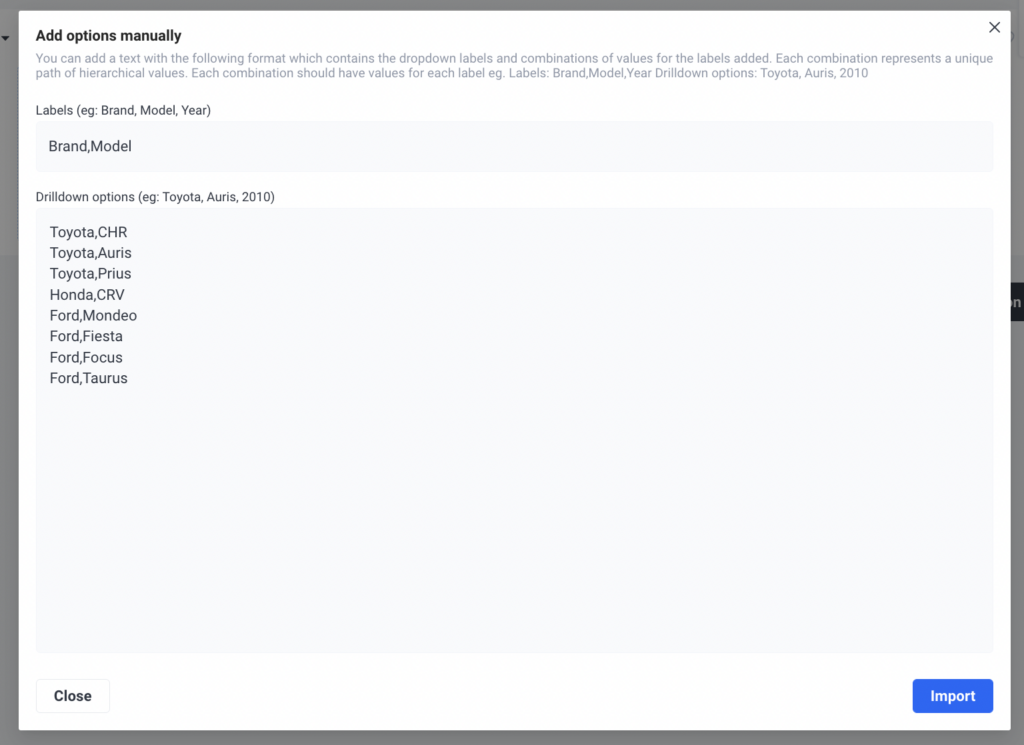
Manually adding values
You can also manually add all the possible combinations for the hierarchy of dropdown levels. In the screen opened you should enter the labels of the dropdowns and the values that they will contain.
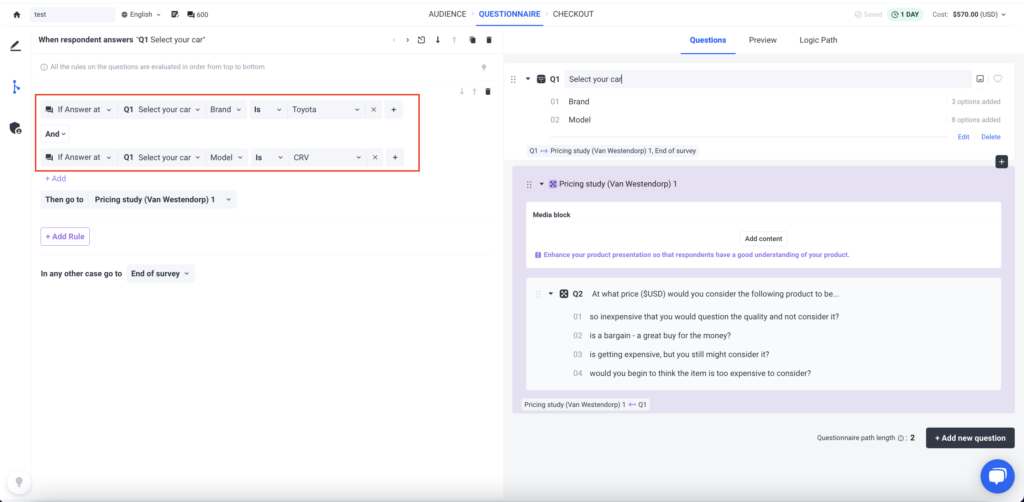
Using logic and recall with the drill down question
Display logic based on a drill down question allows you to hide or display questions based on any level or combination of levels, for example, create a logic rule based on the exact car brand and model type to display a follow-up question, like in the example below.
You can also recall the drill down answer in a following question.
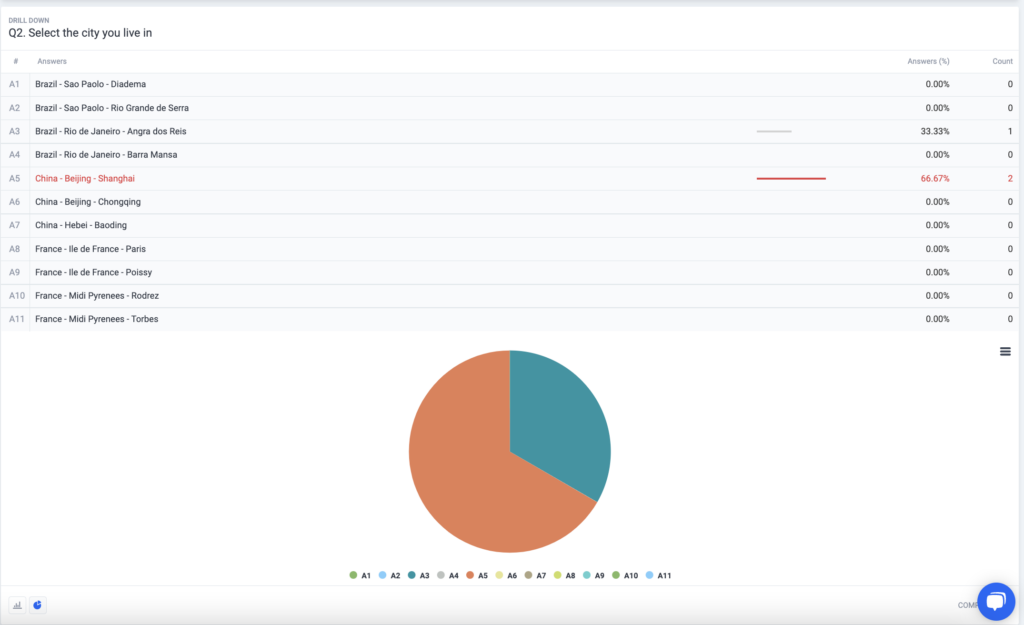
Drilldown results & exports
Once responses have been collected at the survey, the drill down question has the format of a single selection question, where the count and percentage of responses are displayed for each combination of levels provided. You can also switch between the tabular, bar chart view, or pie chart view for the answers.
Curious about how to build your ideal survey? You can learn how to make your own survey in just three easy steps on the Pollfish online survey platform.
The Benefits of Drill Down Questions
This new question type has various advantages along with their aforesaid importance. Take your survey to the next level by applying this question type to one or more questions. But first, let’s learn about its specific benefits.
The following lays out the advantages of using drill-down questions:
- Allows you to get very specific customer data under just one question
- This is because each follow-up prompt gets more specific, based on the answer to the previous one.
- Easy to answer
- It aids the respondents in selecting their answer option without going through a long list of answers.
- Great for those with short attention spans
- This question avoids using long and highly detailed answers.
- Garners highly refined responses
- It allows you to add multiple follow-up prompts, allowing you to get to the nitty-gritty of any subtopic or aspect you’d like to explore.
- As the respondents get to select every option based on previously listed questions, the drilled down answers come out to be highly refined.
- Creates an engaging survey experience
- This question provides more stimulation by getting respondents to answer in a kind of step-by-step way that’s slightly more visual.
- Uncovers more customer personas
- Given that interrelated questions occur at every level, you can use this question type to uncover your customer personas in further detail.
- Speeds up the survey process
- With built-in logic, this question type allows you to reap answers more quickly from respondents and avoid having to apply logic yourself.
Forming the Ideal Survey
Virtually no respondent wants to answer long and detailed questions. That’s where the drill down question comes in, allowing you to collect drilled down information without boring or tiring your respondents with long-winded questions.
Instead, you can quicken the process of answering surveys by helping respondents find the relevant answers they’re looking for, without going through a single endless list. As such, form your ideal survey by opting for an online survey platform that offers this question type.
But there’s more when it comes to choosing the right online survey provider. You should go for a platform that enables you to survey anyone. As such, you’ll need a platform with a reach to millions of consumers, along with one that offers the Distribution Link feature.
The former works by way of Random Device Engagement, which targets and gathers respondents where they voluntarily exist in different digital channels. It distributes surveys randomly, across a wide network of digital properties. This includes websites, mobile sites and mobile apps, making for a randomized survey deployment.
The latter feature (Distribution Link) empowers you to send your survey to specific customers, instead of only deploying them across a vast network. Thus, you can target respondents you know to be your customers via email and social media or drop your link across digital channels of your choosing, such as landing pages, homepages, etc.
It is also important to use a mobile-first platform, as mobile dominates the digital space and no one wants to take surveys in a shoddy mobile environment.
The online survey platform you opt for should also offer artificial intelligence and machine learning to remove low-quality data, offer a broad range of survey and question types and disqualify low-quality data.
With an online survey platform with all of these capabilities, you’ll be able to form your ideal survey, one that garners key customer data while providing a good CX.

Understanding User Research Methods to Improve Your UX and Usability
Understanding User Research Methods to Improve Your UX and Usability

There are all kinds of user research methods you can deploy to round out your user research campaigns. These methods open doors into the minds of your users along with potential customers.
UX is a major component of the overall customer experience, and with the expansion of the digital and mobile spaces, it is critical to create optimal user experiences.
However user research does not solely involve digital experiences; as such, it is crucial to both study and improve on various instances in the customer buying journey that involve UX.
On average, every $1 invested in UX brings $100 in return, which represents an ROI of 9,900%. Moreover, companies that lead in UX outperformed companies in the S&P by 228%.
However, despite the proven benefits of providing good UX, only 55% of companies are currently conducting any UX research methods. Neglecting user research incurs issues such as bad UX and much more.
This article explains user research methods, their importance, their variations and examples and how to use market research to complement them.
Understanding User Research Methods
Also called UX research and design research, user research, is a branch of research that studies target users, particularly their needs, pain points and other experiences while using a product or service, be it physical or digital.
To conduct user research, there are various user research methods available. These allow you to understand how your users explore and rate products, services and experiences, along with what they would change about them.
User research methods are used to expose design problems and opportunities, along with finding vital information for UX designers and web developers to use in their design process. As such, these methods provide sharp insights into the user experience, so that it is possible to optimize all design projects.
There is a wide range of user research methods, as effective usability is contextual and depends on a broad understanding of human behavior if it is going to work. The methods best suited for your UX research depend on the type of product, system, digital experience, or app you are developing, along with your timeline and your target market.
What all user research methods have in common is placing the users at the center of a design process and its products. Researchers can use these methods to inspire UX design, evaluate their solutions and measure impact.
The Three Main Types of UX Research Methods
User research methods can be organized into a framework of three main types, or dimensions:
- Attitudinal versus behavioral
- Quantitative versus qualitative
- The context of product use
Understanding all three UX research dimensions will allow you to be better acquainted with the various methods available, their associations, and which aspects of the UX they help improve.
Attitudinal Vs Behavioral
In attitudinal versus behavioral research methods, researchers study, compare and contrast what users say with what users do, respectively. Attitudinal research is used to understand and gauge the stated beliefs and opinions of your users. As such, attitudinal research is often the focus of marketing departments.
Behavioral research methods involve studying user behavior as a means of understanding what your users do with the product or service under examination. Behavioral research heavily informs UX designers and developers about the functionality of their products/services. It gives them a vicarious and sometimes firsthand view of how their offerings are experienced.
Quantitative Versus Qualitative
In quantitative versus qualitative research methods, UX is studied and compared by examining it by frequency and occurrence, along with deeper scrutiny that seeks to find the why behind the occurrences and their frequencies. But there’s a deeper distinction.
Traditionally, qualitative research has gathered data about behaviors or attitudes via direct observation, whereas quantitative research extracted this data indirectly, such as with an analytics or market research tool, such as polling software. However, such tools can be applied to both qualitative market research and quantitative market research, depending on their capabilities in targeting and extracting the data.
Qualitative research is usually not mathematical, whereas quantitative research methods rely on mathematical means and analysis. This is because quantitative data garners large amounts of data that is easy to record numerically and then parse based on the figures alone.
Qualitative methods are equipped to answer questions about why something occurs or how to fix a problem. On the contrary, quantitative methods answer how many and how much. Having such numbers helps prioritize resources, for example, to focus on issues with the biggest impact.
The Context of Product Use
The third dimension involves investigating whether the participants in your user research study are using the product or service, as well as how they are using it. This involves studying the following:
- Natural or near-natural use of the product
- The goal is to keep interference at a minimum so that you can study the behavior and attitudes of your users in a natural, nearly realistic setting.
- It involves less control but more validity over the topics being studied.
- This is common in ethnographic research and quantitative research.
- Scripted use of the product
- This focuses on a specific aspect of usage, such as a new or enhanced feature.
- The amount of scripting used tends to vary.
- For example, in a benchmark study, there is heavy scripting and quantitative analysis for trustworthy usability metrics.
- No use of the product during the study
- This kind of study is used to understand issues beyond usage and usability.
- This involves studying broader cultural behaviors and brand tracking.
- A hybrid of the above
- This involves dual or multiple approaches to the study, using a mix of the above study types.
- This kind of study is a more creative form of product usage.
- For example, some studies involve participants in the design process, such as rearranging elements that can later be used in a product experience.
The Importance of User Research Methods
User research methods are important to implement in all stages of the design process. This includes pre-production, preliminary innovation, early testing, customer development, launch and post-launch.

First off, user research methods help unearth significant insights about the end-users and their needs. You won’t be able to deliver a satisfying user experience until you understand your users and their unique needs, emotions, feelings, struggles, etc. You certainly won’t be able to optimize your UX without studying how your users interact with your products and services.
Next, these methods allow you to create relevant designs. When you understand your users, you can produce designs that are relevant to them for a variety of reasons and contexts. But if you don’t have a clear understanding of your user experience, then you won’t have any way of knowing if your designs will be relevant. An irrelevant design will disappoint your target market, leading them to bounce from your site and increase your bounce rate.
UX research methods also foster UX design that is easy and enjoyable to use. This is especially important for satisfying your customers. This involves creating products with a high level of usability (also called user-friendliness). This is where user tests and studying the context of product use is advantageous.
Additionally, products with a high level of usability make work processes faster, safer and more efficient.
User research methods also remove bias by learning about the users from their perspectives, experiences, knowledge and mindset. As such, it measures, proves, or disproves assumptions. As such, user research methods work to provide evidence for making design decisions based on an understanding of user needs.
Consumers expect products to be easy to learn and use. They don’t ever wish to think about how to use the products. If your products aren’t intuitive and easy to use, your customers will switch to your competitors. They will result in a reduction in commercial success, as well as damage customer happiness.
On the contrary, when your customers are consistently satisfied, they will commit to long-term relationships with your business, thus increasing their customer lifetime value (CLV). A high CLV is the desired end goal when it comes to amassing consumer loyalty.
Finally, user research methods help you understand the ROI of your UX design. A great UX forms emotional connections between users and products. As such, they will continue to use your products, thereby increasing your customer retention rate.
The Different UX Research Methods
The following provides examples of user research methods, along with where they fall under the three main categories, as discussed in a previous section.
- A/B Testing
- This presents changes to a site's design to a random sampling of site visitors while holding all else constant as a means to see the effect of different site-design choices on behavior.
- It can also show iterations of products and services.
- Type of method: Behavioral
- This includes monadic A/B testing and sequential A/B testing.
- Eye-tracking
- This method works to understand how users visually interact with interface designs.
- It can reveal how users sometimes only pay attention to a single element on a webpage, as it is all that interests them or all that they need.
- Type of method: Behavioral
- This can also give insight into cognitive processes that support various human behaviors.
- Usability Testing
- This is a method of testing the functionality of a website, app, or other digital property by observing users as they complete tasks on it.
- The users are regularly observed by market researchers.
- Type of method: Context of product — Natural/ near-natural use of the product
- The goal of usability testing is to determine areas of confusion and reveal opportunities to improve the UX.
- First Click Testing
- This technique analyzes what a test participant would click on first upon seeing a first interface, as part of completing an intended task.
- It can be performed on the front end of a website, a prototype, or a wireframe.
- Type of method: Context of product — Natural/ near-natural use of the product
- It seeks to find out how easy it is to complete a given task.

- Card Sorting
- This method provides insights into users' mental model of an information space.
- They help uncover the best information architecture for your product, service, application, website or other digital experience.
- Type of method: Attitudinal
- In a card sorting session, participants organize topics into categories that make sense to them and help you label these groups.
- You can use actual cards, pieces of paper, or online card-sorting software tools.
- Surveys
- The key tool for market research.
- Businesses can use a market research survey and a myriad of other types of surveys to glean user experience insights.
- These tools collect and help you make sense of a wide range of attitudes and opinions that consumers have about your UX.
- Type of method: Attitudinal, qualitative and quantitative
- You can apply user testing surveys to zero in on the UX aspect of any market research study.
Pleasing All Your Consumers
All businesses need to conduct user research methods to optimize the UX of all of their offerings, not just those of the digital variety.
It is key to carry out these methods at various stages of the UX design process, from pre-production to post-launch. This way, you can always keep an eye on your UX from the point of view of your end-users.
To comprehensively implement user research methods, you’ll need to use a strong market research tool, such as a survey platform, one that facilitates targeting a precise target market sample, an easy-to-use questionnaire and more.
Use an online survey platform that makes it easy to create and deploy consumer surveys. It should offer random device engagement (RDE) sampling to reach customers in their natural digital environments.
You should also use a mobile-first platform since mobile dominates the digital space and nobody wants to take surveys on a poorly-built mobile.
Your online survey platform should also offer artificial intelligence and machine learning to remove low-quality data, disqualify low-quality data and offer a broad range of survey and question types.
The survey platform should offer advanced skip logic to route respondents to relevant follow-up questions based on their previous answers. It should also make it easy to form a customer journey survey to survey your respondents across their customer journeys.
Additionally, it should also allow you to survey anyone. You’ll need a platform with a reach to millions of consumers, along with one that offers the Distribution Link feature. This feature will allow you to send your survey to specific customers, instead of only deploying them across a vast network.
With an online survey platform featuring all of these capabilities, you’ll be able to adequately deploy various user research methods.

What is a Focus Group and How to Use it in Your Market Research
What is a Focus Group and How to Use it in Your Market Research
Chances are, you’ve come across focus groups if you’ve looked into market research or other forms of research.
The term focus group is often used as one of the key methods to gather qualitative research, in the market research sphere. Although not quite an interview, this hands-on approach spurs discussions between research participants, which have the potential to go into great depth on a subject of study.
As such, using this technique allows businesses to gain critical insights into their target market, along with all of its segments.
These insights help you hone in on your marketing, branding, advertising and other business processes.
Focus groups can be conducted with other research methods, such as survey research and more.
That’s why you ought to familiarize yourself with this type of research technique. Luckily, this lengthy guide goes into the weeds of this form of research, allowing you to gain an exhaustive understanding and decide whether you should carry out this kind of research method.
This thorough guide explains what a focus group is, how to use it, how it works, its advantages and shortcomings, how it ranks against survey research and more.
Table of Contents: What is a Focus Group and How to Use it in Your Market Research
- Defining Focus Groups
- Post-Focus Group Research
- How Focus Groups Work
- The Pros and Cons of Focus Groups
- The Types of Questions Used in Focus Groups
- When to Use a Focus Group
- Focus Groups Vs Online Surveys
- Focus Groups vs. an Online Survey Platform: The Verdict
Defining Focus Groups
Let's begin with the heart of the matter: what is a focus group? A focus group is a small group of people selected based on their specific shared characteristics, to take part in a discussion for market research, or other types of research.
Focus groups are a kind of primary research. Unlike market research software, which is one of the most popular tools for conducting research in the present day, a focus group does not take place digitally—not before Covid, that is. Now, many events, whether they are research-related or otherwise, take place via online meetings.
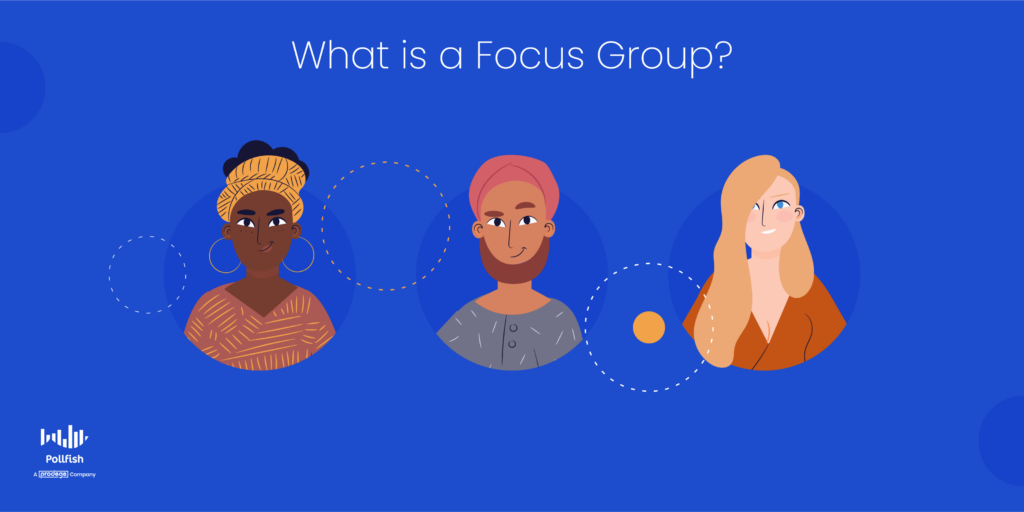
At any rate, focus groups occur with all members in one conjoint session, whether it’s in-person or over the internet. Researchers can opt to include a single or multiple focus group sessions, should they require further studies on the same topic or group of participants.
Focus groups are one of the main techniques of qualitative research, which delves into a wide variety of phenomena. These include:
- Motivations
- Attitudes
- Reasoning behind actions
- Opinions
- Sentiments
- Beliefs
All of these aspects and topics of discussion can focus on the participants about various stimuli, such as current events, past events, plans, fears, culture, etc.
Unlike quantitative data, which works to find the “what” and generate statistics, qualitative data aims at understanding a topic in greater depth.
Focus groups are composed of a small number of people who take part in a studied conversation alongside a moderator. The moderator is one of the main researchers assigned to this kind of study.
The Role of the Moderator
The role of the moderator is to ask questions, manage the discussion, make sure everyone speaks up and take notes on the discourse, which are later used to analyze it. Essentially, the moderator is a kind of host in this scenario.

Their role is multi-pronged, as they wear different hats in the study. The degree of their involvement in the study may depend on the other actors involved, typically other researchers who are part of the focus group or the larger research study.
In addition, their roles may differ based on the other market research techniques their organization uses, whether it includes survey research, concept testing, experimental research, or others.
The following lists the different aspects of the role of the focus group moderator:
- Observer
- Recorder
- Discussion driver
- Interviewer
- Post-session and on-site analyst
Focus Group Size
The typical size of a focus group ranges between 5-10 people. 5-7 is the ideal amount of focus group participants, as these groups are purposely kept small.
That’s because when there are more than seven people present, it is difficult for every member to speak about a topic, or issue, and especially, to answer a specific question. It would also be difficult for the moderator to control a larger group and ensure everyone provides their insights. Additionally, some topics become irrelevant to continue discussing after the seventh person weighs in.
The Focus Group Approach
This method provides an interactive approach for research participants to share their viewpoints and experiences and for researchers to collect critical data on their subjects.
In direct opposition to quantitative market research, focus groups do not involve crunching large numbers or making assumptions based on large quantities. Instead, they focus on a small group of participants who represent different market segments and customer personas.
In keeping with the qualitative research approach, the moderator uses open-ended questions. The moderator may also use multiple-choice questions, but those are almost always followed up with questions to explain the reasoning behind choosing a particular answer.
Thus, these discussions are typically filled with questions that delve into the “why” and “how,” as they seek to uncover context and motivations.
Participant Discussions
The purpose of this qualitative research methodology is to gain a wealth of insights into customer behavior, customer preferences, attitudes, beliefs and more, by way of a hands-on approach.
As such, the focus group method is intended to reap key insights from the discussion generated among participants. During the discussion, the participants are not solely encouraged to respond to questions the moderator asks but to engage in conversations with other participants.
In doing so, participants are prompted to reflect on their memories and draw from their own experiences.
The discussion of the focus is based on a pre-selected topic. This is usually tied to a larger market research campaign, which may be part of another business campaign, such as the strategic planning process, a marketing objective, a consumer insights campaign and more.
Focus Group Participants
In market research specifically, the participants of a focus group are members of a business’s or in broader studies, an industry’s target market. This is the broad range of customers who are most likely to buy from a business and are typically the targets of marketing campaigns.
The shared characteristics of the study can be based on demographics, psychographics, geographic location and firmographics. Firmographics characteristics are those that involve business, as such, they would be included in a B2B focus group. This is a study on other businesses, typically those who are clients of a business.
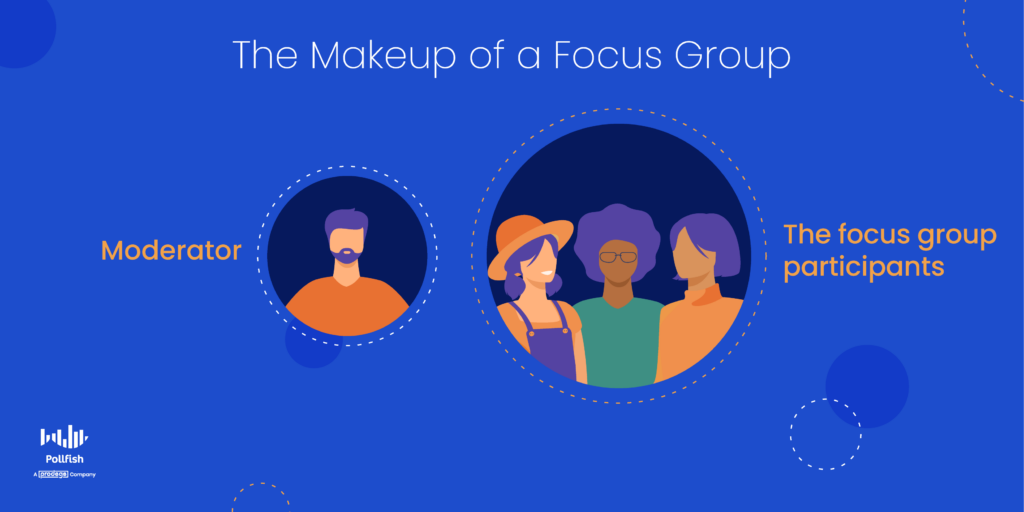
Demographic factors include characteristics such as gender, age range, ethnicity, income, education level, marital status, number of children and other such factors. These can include geographic locations, although geographical factors are considered a separate category in market segmentation.
Post-Focus Group Research
After the interview or set of interviews in this study, the moderator gathers the research and summarizes it. They may conduct their analysis or consult with other researchers on their team.
It is usually the other researchers who are better suited to understand and explain certain communication styles, and body language as well as to conduct further descriptive research. As such, there may be several rounds of analyses on the data from the focus group
Thus, in post-focus group research, which refers to post-interview research, there is usually a team of researchers involved in analyzing the group’s discussion and the data it produced.
Post-Research Document of Findings
After conducting an analysis, the researchers, including the moderator, will consult with one another to turn the raw data and analyzed research into a presentable document. This document should include the following:
- The purpose of the focus group study
- The participants’ profiles
- This should include the characteristics of all major segments of a population, such as:
- Demographics
- Psychographics
- Geographies
- Firmographics (if business personnel were studied)
- This should include the characteristics of all major segments of a population, such as:
- A summary
- Key findings
- Explanations of key beliefs, sentiments, opinions, or thoughts
- Comparisons and contrasts between different members
- This should include comparing them on a higher level, as each participant can represent a different segment of a target market.
- Statistics (although not very common)
- These can include statistics drawn from other market research methods, such as using an online survey tool, other non-focus group interviews and even sources of secondary research.
- Plan of action
- This should include what the researchers plan to do next with the data, especially about other team members.
- After all, most data and research campaigns should be actionable. You wouldn’t want your efforts and highly-coveted data to sit idly and gather dust.
- A conclusion
- This should be concise and round off the study.
- It should include a few of the most important findings, along with the plan of action and next steps.
They would then share it with other members of their organization. This often depends on the purpose of the focus group study.
For example, if it was for marketing purposes, the research would be primarily shared with the marketing team. If it was for customer development, it would be shared with the product team and so on.
Data Democratization in Post-Focus Group Research
There are going to be some cases in which the topic scrutinized in this kind of study doesn’t neatly correlate with a single department. This is perfectly fine, as certain business practices can be conducted cross-departmentally, or for the business at large.
This is where the democratization of data comes in. This concept refers to the practice and condition in which everybody in an organization has access to data. In such an environment there are no team members hindering access to the data. As such, there should be no bottlenecks preventing people from either using the data or understanding it.
This points to the need for the data to be both highly accessible and understandable. This underscores the importance of creating the post-research document mentioned in the previous section.
It is this document that serves as the go-to source for examining a business’s focus group study, and most importantly, putting the study to good use. This means the actions the focus group yields will go beyond those outlined in the plan of action section in the study’s main document.
Instead, in a democratized data environment, other team members, those who aren’t researchers or analysts, can analyze the data as well. This ability allows them to partake in the data for the decision-making process.
This is important for all companies, as data goes unused in too many businesses. Even though more companies are investing in customer data, up to 80% of all data goes unused. You wouldn’t want to waste your money and efforts on churning out data that goes unused.
As such, data democratization is a must in all market research campaigns, including docs groups.
How Focus Groups Work
Focus groups use a specific methodology to clear away any ambiguity. As aforementioned, the small group that makes up a focus group comprises 5-7 people.
The participants are pre-recruited, similar to the mechanism for gaining research participants used in survey panels. They are enlisted based on shared characteristics, which are considered the subject of market research.

To reiterate, these characteristics include demographics, psychographics, purchase history, shopping behaviors, and other factors.
The qualifications that researchers use to recruit participants often bind the participants to a brand’s target market. However, brands can also study people outside their target market to learn how other consumers think and possibly gain them as customers.
Focus group discussions vary; they can involve feedback on a product, experience, or marketing campaign. They can also be used to discuss consumers’ opinions on different matters, such as pop culture, news and politics, especially if they relate to a brand’s industry.
The discussions are led by a moderator, who prompts questions and talking points. The moderator sets the conversation in motion, along with acting as the researcher. As such, the moderator also notes their observations.
How long does a focus group last?
The length, both in terms of questions and the discussion of the interviews themselves will vary. It is up to the moderator to decide whether they’ve gleaned enough information from the participants or not before moving on to another question or topic or ending the session.
Typically, these discussions involve using 10-12 questions to draw out responses on key topics that underpin the overall market research campaign. The discussion takes about 30 to 90 minutes.
The environment of the study
A focus group environment should be open-minded as participants can have varying and even oppositional opinions. No one should be made to feel threatened or silenced, as every insight matters.
Focus groups are NOT to be conducted in the same way as interviews. They are far more interactive, but most importantly, they are not carried out on a one-on-one basis. Instead, they are group-focused activities, in which participants speak with each other instead of solely with an interviewer.
As such, the participants may influence each other, possibly swaying the minds of some members, or reinforcing someone’s opinions. Some participants will draw opposition or even aversion to their responses from others, possibly from the moderators themselves.
This is because they’re in the same broader target market, they are all individuals who hold their own opinions and convictions.
Regardless, the moderator should not input any of their opinions or beliefs into the discussion and be as neutral as possible. They should assume this neutrality even if they severely disagree with any of the participants.
Since focus groups are small, researchers often conduct several (3-4) of them, which includes hosting several interviews per focus group, across different geographic locations. This way they can reap the maximum amount of insights and satisfy all of their research campaigns.
The Pros and Cons of Focus Groups
This market research method offers several advantages. These will help propel you to understand your customer base or subject matter much better. They will also help carry your research to completion. But, they have a few drawbacks as well. Researchers and businesses ought to consider both before choosing this research method.

The Pros
- Researchers can probe the deep feelings, perceptions and beliefs of their intended subjects.
- When members are engaged, they provide invaluable information that removes any obscurities surrounding a topic.
- They generate results fairly quickly, as each session lasts no more than 90 minutes.
- Researchers can study body language, facial expressions and other non-verbal signs.
- Not all questions need to be premeditated, as they can be produced based on the direction of the conversation.
- Given that this is a discussion, you may discover even more insights than you had originally planned, including on other adjacent topics.
The Cons
- The thoughts of a small group that fits a target market are useful but are not representative of a larger population.
- Recruitment will take a significant portion of the time.
- Traversing different geographic areas, if need be, is also time-consuming.
- Some members will be dominant while others will contribute less to the discussion.
- Certain participants can sway the discussion, even making it veer towards irrelevant territories.
- They can’t be used for quantitative research.
- Given that this is often done face-to-face, or at the very least, with everyone’s identity known (at least to the researcher), some participants may shy away from expressing their true thoughts.
- They are therefore subject to social pressures and acquiescence bias, in which respondents tend to select positive responses or those with positive connotations.
- As such, there is a lack of accuracy, as these groups are not anonymous.
The Types of Questions Used in Focus Groups
The moderator of a focus group should ask specialized questions to reap as much intelligence as possible. While this format is generally flexible, there are still certain question types that you should incorporate. These will help you hatch the questions you’ll need.
Here are the four types of questions that are most applicable to a focus group, along with question examples:
- Engagement questions
- These questions are designed to ease participants into the discussion by introducing themselves,
- These are easy questions posed early on to introduce the participants to each other, to make them more at ease, and to acquaint them with the main topic at hand.
- Questions include:
- Tell us a bit about yourself.
- What do you generally think about ads in this industry?
- What do you think of this ad campaign?
- Exploration questions
- These questions probe deeper into the topic to get a feel of the participants’ feelings about it.
- These questions are to be asked after participants begin to ease into the conversation and become more active in it.
- Questions include:
- Why do you feel that way?
- Have you seen better examples of this type of ad campaign?
- What would be a better way to go about it?
- Why do you feel this way about this [social] issue?
- Follow-up questions
- These are used to gain a better understanding of a previous question answered, or a previous topic addressed.
- These allow the moderator to get into the nitty-gritty of participants’ feelings and motivations.
- Questions include:
- How do you go about this issue?
- Why do you feel this way?
- Is there anything that would change your mind about [this issue, method, way, etc]?
- How can this brand improve on serving [you, releasing a campaign, etc]?
- Exit questions
- These questions help conclude the session and should be asked when the moderator is certain that the group has expressed everything they can on the topic.
- They should be used to get confirmation on certain notions.
- Questions include:
- Are you sure these are the best approaches?
- Is there anything else on this topic you’d like to add?
When to Use a Focus Group
Do you need a focus group? If you do, you’ll need to know when to use them, which is rooted in the reason behind conducting them in the first place. As such, the when is closely tied to the why and how.
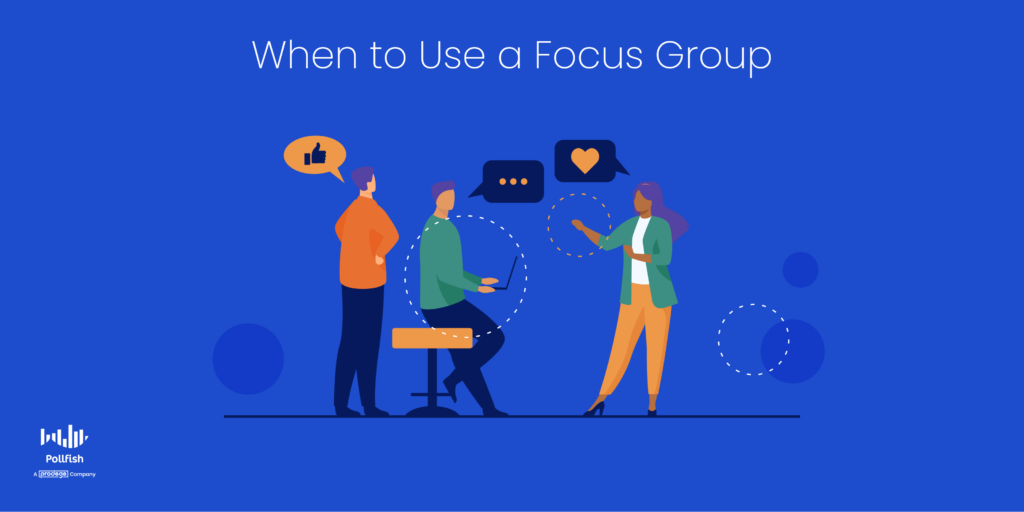
In short, knowing when to use a focus group depends on what you need it for. This will require you to turn to your research campaigns and needs. The following presents a few key moments and reasonings for when you should use this kind of research technique:
- To better understand the results of primary quantitative research or secondary quantitative data about qualitative aspects.
- Whenever you need to gain an explanation of something, whether it’s a phenomenon, a thing of the past, something current, something you still don’t understand.
- When you seek a more interactive research method as opposed to a textual or digitally-based one.
- When you require information about behaviors, motivations and other phenomena that are too complex for a questionnaire alone to reveal.
- To understand the thoughts and opinions of people who are already in your orbit, you don’t need to conduct a deep recruitment process. For example:
- You’d like to know how the members of a senior center feel about its programs, hours and service.
- In this case, the senior center already has a batch of possible participants to choose from, being the members of the center.
- A college club seeks to learn how students feel about their classes, workloads and schedules.
- In this case, the club can choose from a wide range of students at the college. They can promote their group via signs, a booth, email, etc.
- You’d like to know how the members of a senior center feel about its programs, hours and service.
Focus Groups Vs Online Surveys
Now that you’ve learned about the ins and outs of focus groups, it’s time to see how they stack up with another research method: online surveys. It’s key to compare them closely when you decide on the best research method you wish to conduct.
A focus group is a suitable method to garner qualitative research. It is far more interactive than seeking and providing written responses. So how do focus groups measure up against online surveys?
This method is useful for finding deep insights into a topic. It allows researchers to get as granular as possible, since they are speaking with the research subjects themselves and can ask anything that they didn’t include in a survey.
How Online Surveys Are Superior
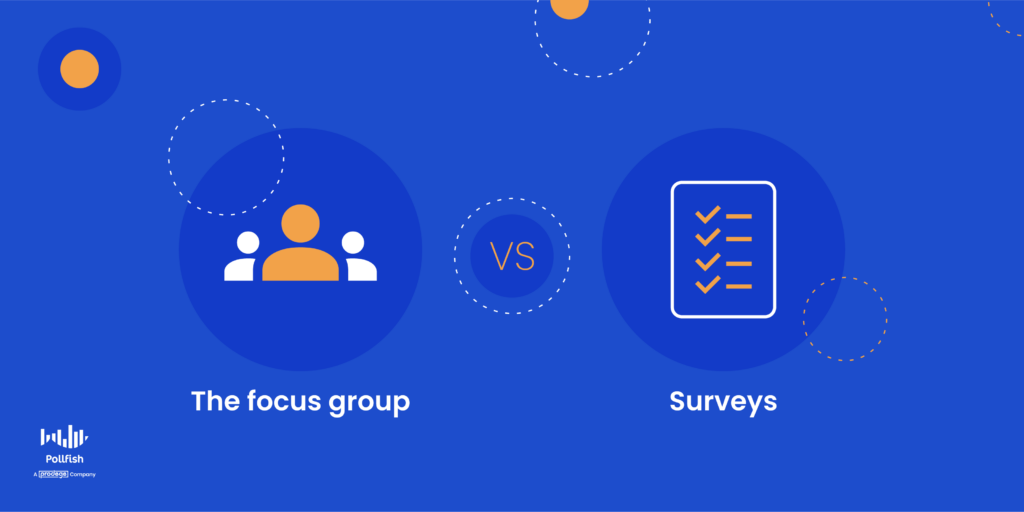
The following expounds on why online surveys provide researchers with more meaningful results and a more comprehensive market research experience. Use these insights to compare with the benefits of focus groups to determine the better option for your research needs.
Benefits that are second to none
An online survey platform, however, offers benefits that are second to no other market research method. That is because surveys offer more definitive results about a population since they are not limited to 10 or fewer research participants.
Reach the Masses and Conduct Quantitative Research
A potent online survey tool allows you to reach thousands of people — in just one survey alone.
This means surveys are the most apt tool for conducting quantitative research, something that a focus group cannot do.
Quantitative + Qualitative Data = A Complete Market Research Experience
What’s more, is that surveys can include open-ended questions and follow-up questions (depending on the online survey platform you use). This proves that surveys can also forge qualitative market research.
Thus, online survey platforms grant you the power to conduct both quantitative and qualitative research, giving you the most holistic research experience possible.
No need to worry about recruitment
Additionally, there is no recruitment element. The survey platform is the recruiter in this case, as it allows only qualified respondents to take part in a survey.
Granular respondent targeting
You can create respondent requirements that are as granular as you wish, covering every minute detail of a customer profile and reaching any population.
This is because a strong online survey platform enables researchers to select precise respondent criteria, the kind that goes far beyond demographic selections alone.
That is because the screener portion of an online survey allows you to ask specific questions and only permits respondents who chose particular answers to take the survey.
Anonymity, privacy and no social pressures
When taking an online survey, respondents cannot be swayed by other participants as they would in a focus group as surveys are lone activities. Therefore, respondents take them in privacy.
Most importantly, survey software grants responders anonymity. There is no anonymity in a focus group, so more reserved members will feel less inclined to speak about certain things.
Additionally, when domineering respondents are present, it adds another layer of difficulty to the reticent participants, especially when it comes to speaking about views that are contrary to those of a dominant member.
However, with the anonymity of a survey, respondents are free to speak their minds. As such, surveys too can provide qualitative details — so long as researchers include open-ended questions.
Focus Groups vs. an Online Survey Platform: The Verdict
So which is the better research technique? The answer is, it depends on your needs. Most often a focus group is used in tandem with other market research methods. As such, we recommend using both online surveys and focus groups for your research campaigns.
Here’s why:
Researchers can use a focus group to their advantage when they seek deeper insights into the perceptions and thoughts of various business matters.
Whether you’re testing out a new product idea, seeking the sentiment on an ad campaign, trying out new messaging, or seeking insights for any other purpose, a focus group is a useful method. However, they are but one market research method; as such they can and often are used with other market research techniques.
However, survey research is one of the most powerful forms of research, in that it empowers researchers to probe into anything and reach relatively anyone (should the survey platform allow it).
A strong online survey tool will deploy your survey to the most popular websites and apps, and take no more than 2 days to gather the number of respondents you input. In addition, it can send your survey to specific individuals through specific online channels, such as social media, email, or landing pages. Your survey platform would need to offer the Distribution Link feature to do this.
In addition, the online survey platform you choose should allow you to create logic in your survey, that is, to route respondents to appropriate follow-up questions based on the answer they provide to a question. Choose a platform that offers advanced skip logic to do this.
All in all, researchers who are serious about conducting market research campaigns should use surveys alongside any other research method, including that of a focus group. It provides quantitative data, which focus groups do not, along with a wide breadth of key features and capabilities to complete any market research campaign.
A focus group is a small group of survey research subjects, typically composed of 6-10 participants who take part in a moderated discussion about a particular topic. The participants are chosen based upon similar characteristics. The moderator of a focus group leads the discussion by asking questions, proposing talking points, studying the responses and taking notes on the findings. The moderator keeps the conversion flowing and ensures that the discussion remains amicable, even when discussing sensitive topics or opposing opinions. Focus groups are used in qualitative research to help gain a deeper understanding of the motivations behind the behavior, attitudes, or feelings of a group of people. By directly addressing a portion of the sample population, researchers can delve into the “why” or “how” behind data that has already been collected. Focus groups allow for the exploration of deep feelings and opinions, can provoke thoughtful insights, provide quick results, allow researchers to study non-verbal signals that accompany the discussion, and can result in unexpected information. Focus groups are conducted with a smaller group of people, therefore the recruitment phase can take longer and the thoughts of the group may not represent the larger population. In addition, it is possible that stronger voices can dominate the conversation and influence or obscure the findings.Frequently asked questions
What is a focus group?
What is the moderator’s role in a focus group?
How can focus groups support a qualitative research project?
What are some of the benefits of a focus group?What are some of the disadvantages of focus groups? Focus groups are conducted with a smaller group of people, therefore the recruitment phase can take longer and the thoughts of the group may not represent the larger population. In addition, it is possible that stronger voices can dominate the conversation and influence or obscure the findings.
What are some of the disadvantages of focus groups?

The New Bipolar Question: A Matrix Question Type
The New Bipolar Question: A Matrix Question Type
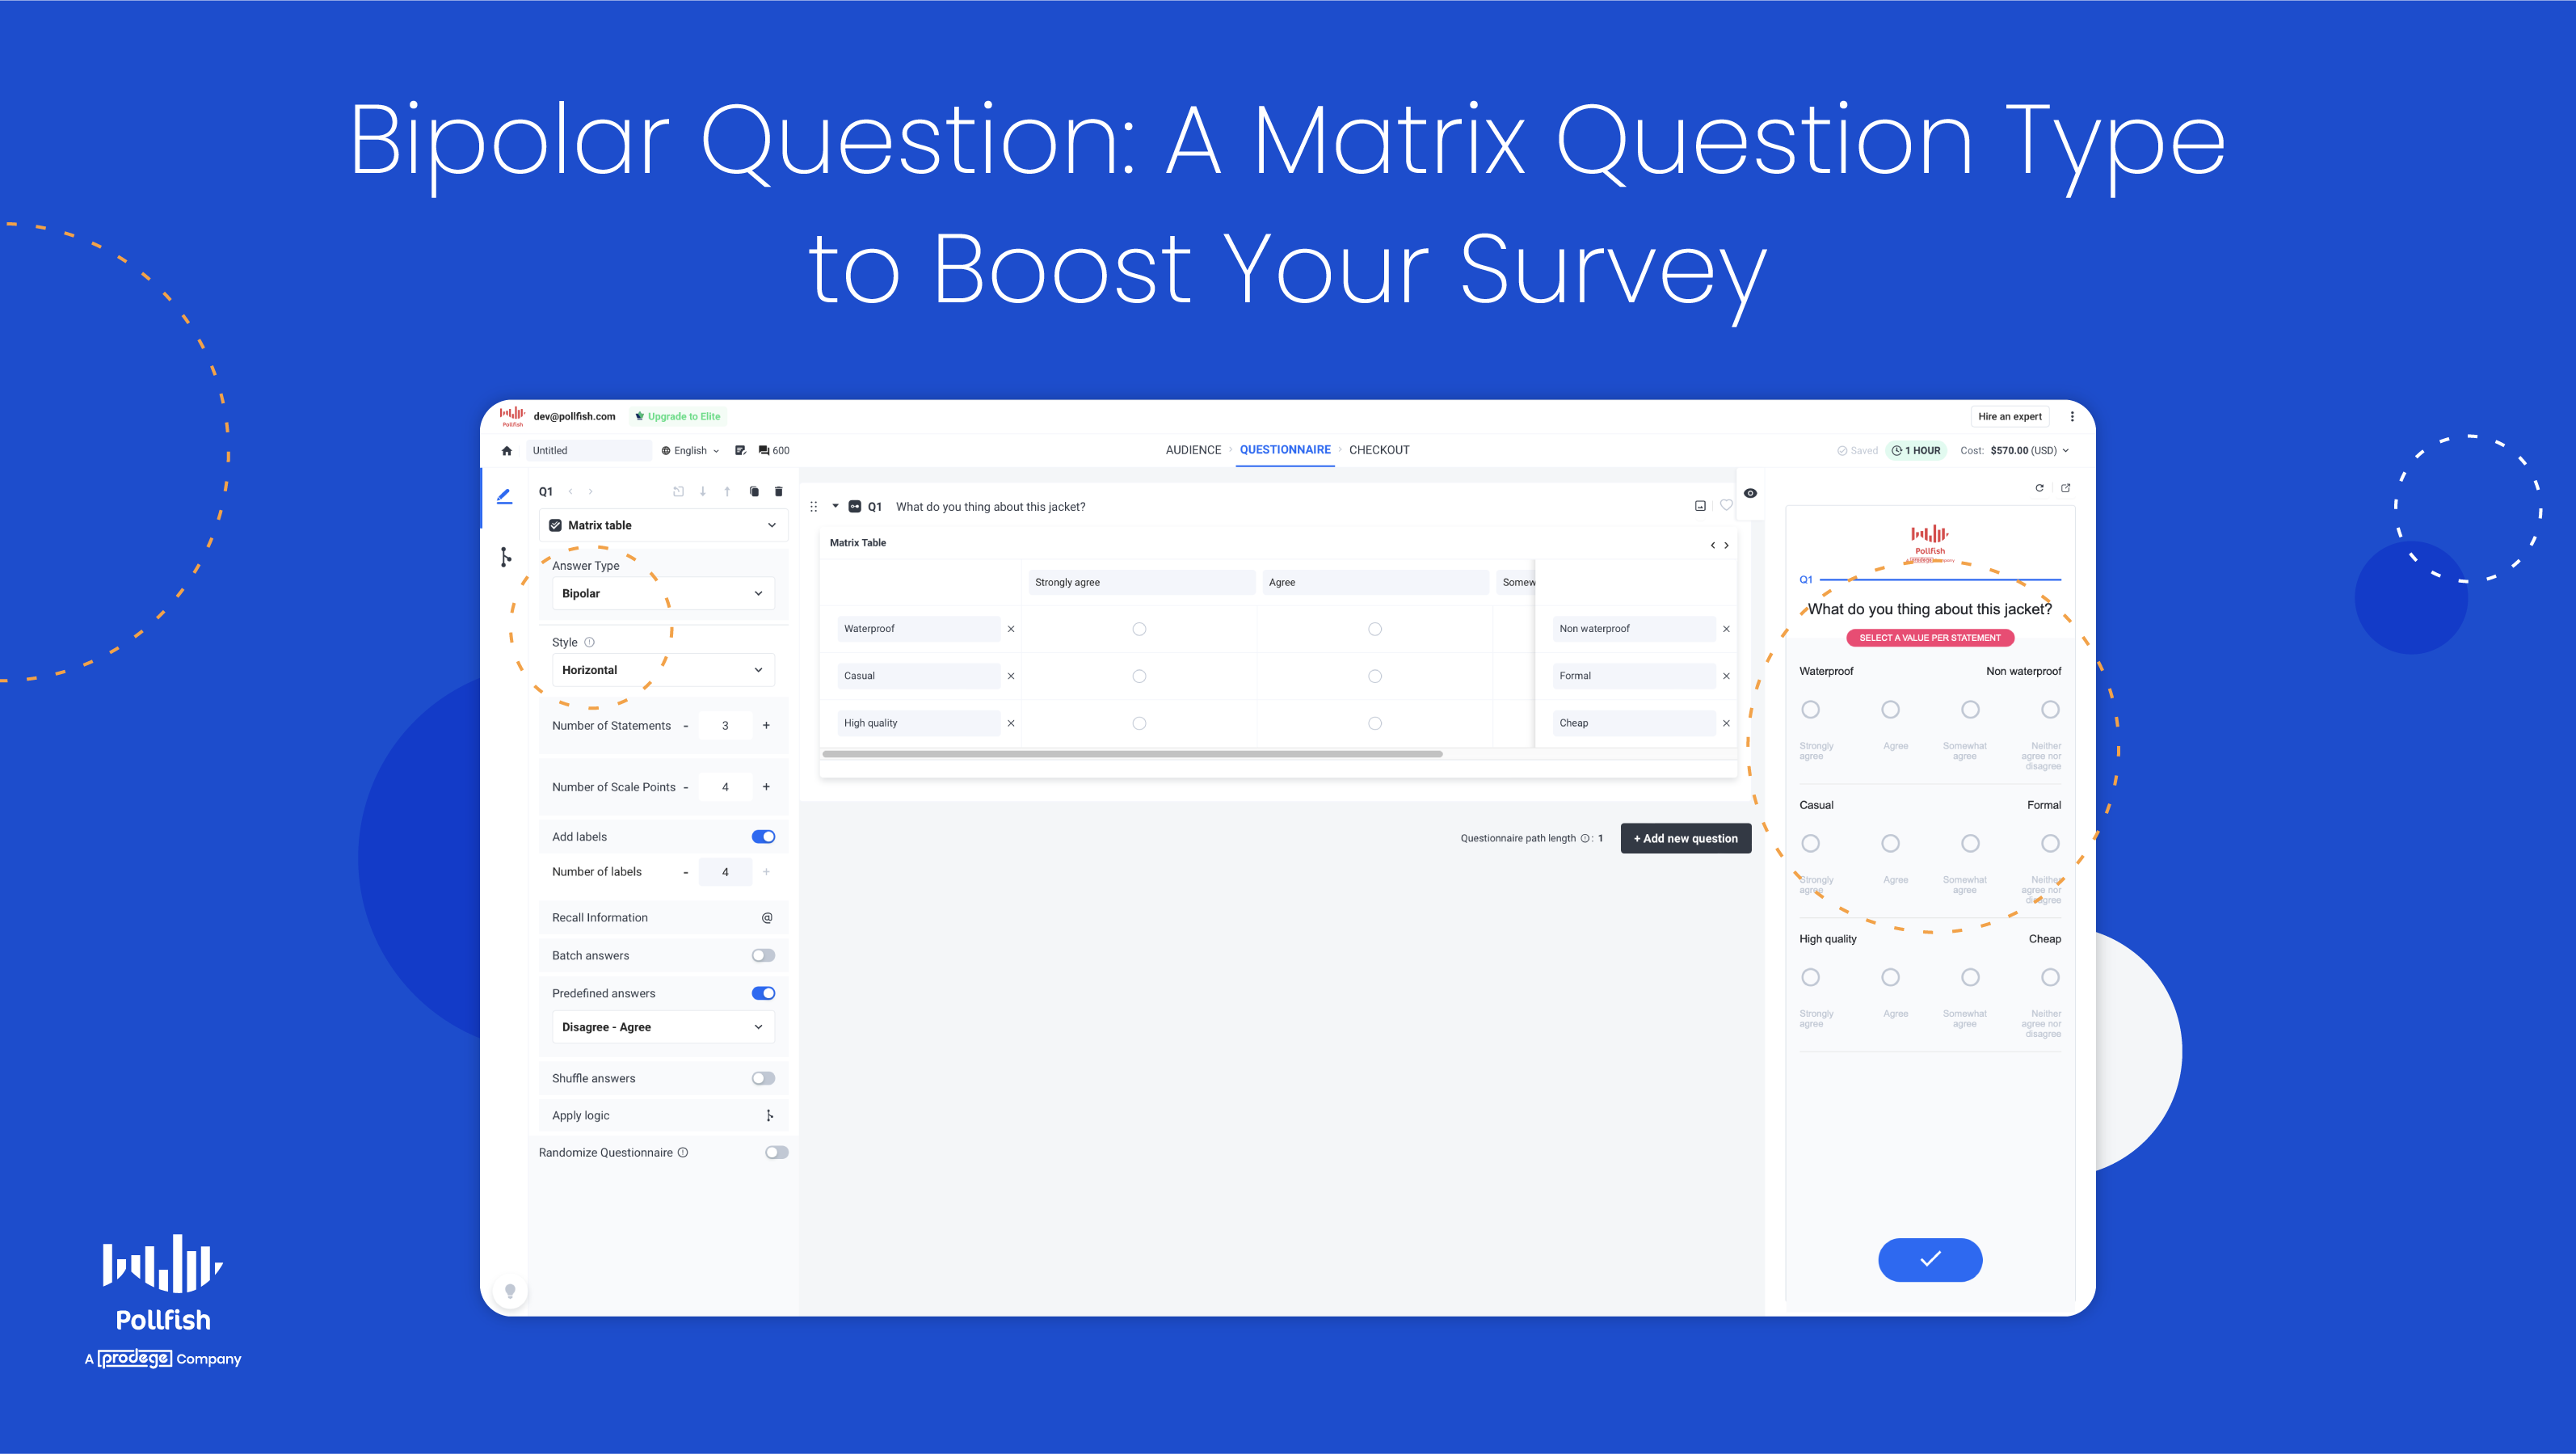
We’ve recently released a new version of the Matrix question type called the Bipolar Question, which is a specialized variation of this question type. With this new functionality, you can help respondents answer by including dual-labeling, as this variation includes a scale — the Bipolar Scale.
Each end of the Bipolar scale is marked to show its two extremes. This way, respondents will quickly determine which side has the more positive answers and which leans on the negative ones. In addition, they'll understand how each side of the scale of answer options differs by understanding which extreme it falls under.
A variation of the Matrix question, it too relies on a table or grid when asking about the same set of characteristics for multiple items, just like you would expect with a Matrix question.
However, this version is distinct in that it displays two extremes of a scale that are set by the researcher. This variation is a more advanced version of the Matrix questions you’re used to seeing and the opposite of the Likert Scale Matrix variation.
This article explains the new Bipolar variation of the Matrix question type, its importance, examples, how it differs from the Likert variation and how to use it on the Pollfish platform.
Understanding the Bipolar Question Variation
The Bipolar question is a kind of variation of a Matrix question, which is also called a Matrix table question. As such, you’ll need to have a firm understanding of this main question type before undertaking any of its variations.
What is a Matrix Question?
This question type utilizes a table or grid as a means to present the questions and answer options. It is typically used to ask about the same set of characteristics for multiple items, such as how often a respondent uses a product or service.
The question itself is set up as a table or a grid to bring the information together for the respondent in an easily understandable way.
Matrix table questions allow you to combine a set of questions with the same answer options. This is especially useful when you seek to ask multiple questions that can be rated on the same scale, meaning, they can all be measured with the same answer options that are displayed on a scale. For example, on a scale of extremely rarely to extremely frequently.
The Bipolar Matrix Question Type
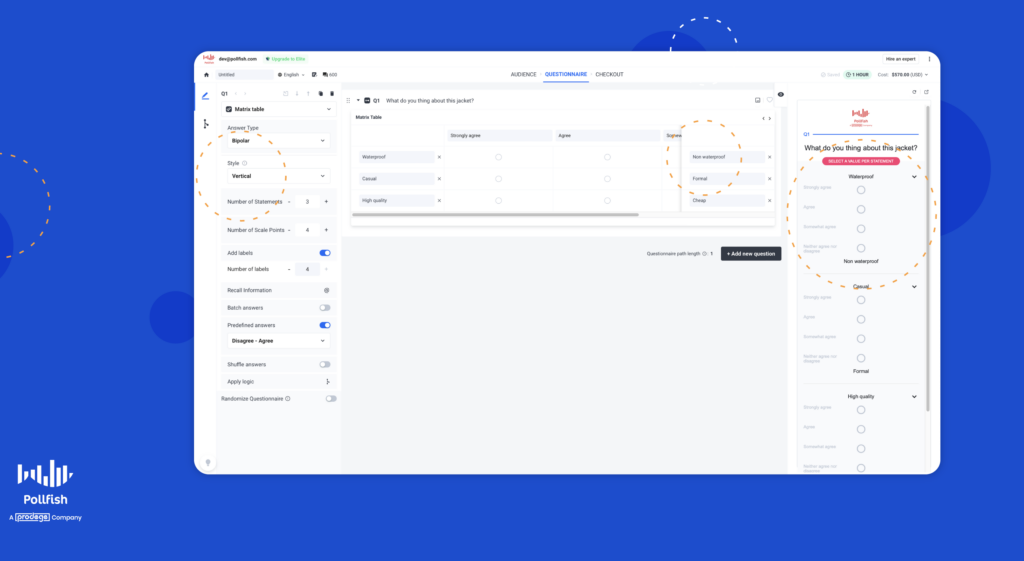
As aforesaid, this question type is a variety of the Matrix question. It takes essentially the same layout as a Matrix question and has one defining characteristic: a marked display of two extremes of the table or scale.
Given the emphasis on the two opposites of the scale, this scale is called the Bipolar Scale, granting this variation to its name.
The researcher (or platform user) is in charge of setting the two extreme ends of the scale and making them noticeable. This is done by assigning each end with a name. For example:
in the following question: “How would you rate this sneaker?” the two extremes would be marked by the words: “extremely painful” and “extremely comfortable.”
Each descriptive word would be displayed at the opposite ends of the scale. This shows respondents where each answer option is relative to the two extremes.
How the Bipolar Question Works
Respondents select a point between the two extremes, with the point being an answer option in the scale. These points can also be labeled as a means of further helping guide respondents through the Bipolar Scale. They can have labels that match the type of intensity of the point.
For example, they can be labeled as “very little” to “none at all.” Other options include using the same labels on each side of the scale, with a single point for neither or neutral, such as “very little” and “very much” or “highly unlikely” and “highly likely” on each side.
The Importance of the Bipolar Question Variation
This Matrix question variation is important for several reasons.
First off, it is useful to include in your survey if you seek to measure consumer preferences and opinions based on intensity. It is especially important if you want to measure your respondents’ views on something regarding your brand based on two opposite extremes.
This is crucial, as many times, shopping habits, sentiments and customer behavior can all be whittled down into two main categories, or fall somewhere in between two main categories. These often exist as two opposites that you can study your customers with, based on what they choose in between or at the polar ends of the two extremes.
Secondly, this question type is important, as it helps guide your respondents on how to answer the question, based on how each option is oriented. As such, they’ll better understand which extreme their answer is associated with.
They’ll also understand how neutral their answers are, or whether they slightly gravitate towards one end or the other. By helping your respondents better understand under which extreme their answer lies, you’ll also reap more accurate responses, which will provide you with key data for decision-making.
Lastly, this kind of question variation creates a more visual and engaging survey experience. Due to its helpful nature in helping your respondents choose an answer, it makes a more lively and enjoyable survey experience.
Not only will this speed up the survey process, which will bring you faster insights, but it will also improve your brand reputation if you include your brand name or specific product or service in the question itself, or somewhere else in the survey.
All in all, the Bipolar question variation is critical for various reasons concerning survey user experience, providing more accurate answers, getting speed to insights and improving your overall brand experience.
The Bipolar Question Type on Pollfish
You can set up the Biopolar Scale to your liking by choosing how you label the two extreme ends and the points on the scale.
The following displays how this new question type looks on the Pollfish platform:
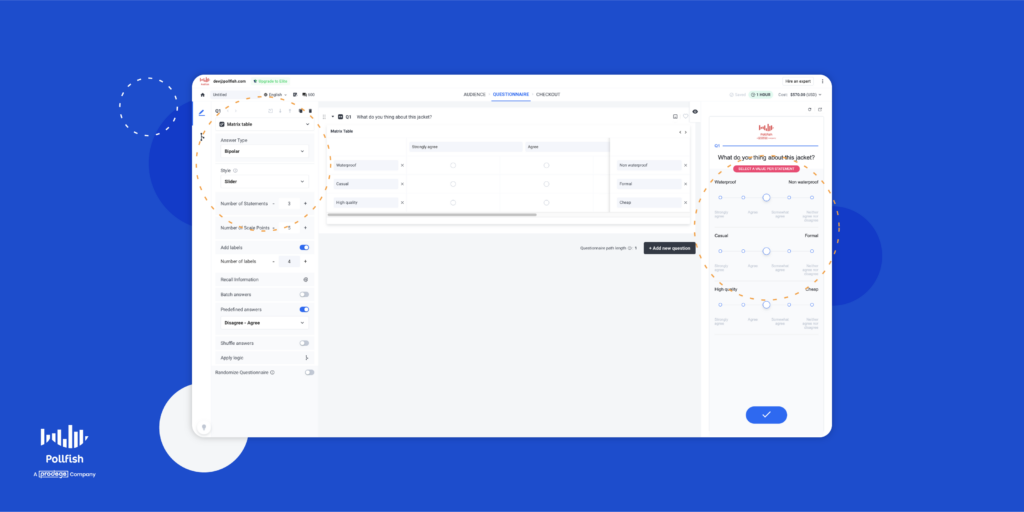
How the Bipolar Question Type Differs from the Likert Question Type
Both of these question types are variations of the Matrix question. As such, the Matrix question type exists as the parent question category, while Bipolar and Likert Scale variations are the more granular child categories.
Both categories therefore can use a scale of 5-7 questions and both use a Matrix table, but their distinct version of it.
Let’s explore how they differ from each other in the following table:
| Bipolar Scale Matrix Question | Likert Scale Matrix Question | |
| What’s displayed | Two extremes of a scale in a table format. | A list of statements as rows and scale points as columns in a table format. |
| Question options | Respondents select a point between the two extremes. | A single answer, a multiple answer, a drop-down list, or a drag and drop. |
| Answer Labeling | Because the two extremes are marked, labeling individual points is optional. | Each option always has a label. |
| Answer Options | Respondents can provide just one answer. | Respondents can provide more than one answer. |
How to Use the Bipolar Matrix Question Variation on Pollfish
Creating this question type and using it on the Pollfish market research platform is easy to do. First, go to the questionnaire section of your survey. Then, select your question type in the lefthand panel.
Then choose from the following options to set up your Bipolar Scale:
- There are 2 extreme-scale values for each statement.
- Select the length of the scale points and add the number of labels, as you will have to choose how to represent the Bipolar question to your respondents.
- Use rows and columns( horizontal and vertical cells or use the Sliders.
Afterward, choose from the available settings for your Bipolar Matrix question:
- The number of statements, AKA, rows has no restriction.
- Scale points, the radio buttons available also have a few restrictions and conditions:
- Include up to 20 for Horizontal and Vertical cells.
- Use up to 11 for the slider.
- Use up to 20 statements for all forms.
- Labels, which are optional and go above the scale points. They do not have to be the same number as the scale points.
Don’t forget to type in your question and have your answer options (the points) you seek to fill in.
Next, consider how we implement this question type:
- In the questionnaire
- Using advanced skip logic
- On mobile and desktop versions
- On the results page
- In exports, BQ and file exports
- With Survey Translations
Finally, review your question and answer options (the points) and add more Bipolar or other questions to your questionnaire.
Curious about how to build your ideal survey? You can learn how to make your own survey in just three easy steps on the Pollfish online survey platform.
Setting Up the Ideal Matrix Table
You can now use the Pollfish platform to create a specialized Matrix question: the Bipolar question type. A variation of the Matrix question, it helps you create a more custom question format that guides respondents on which extreme their answer falls under.
Giving you the chance to fish out more accurate answers while creating a more engaging survey experience, using this question variation is a must. That’s why it is equally important to select a strong online survey platform that facilitates creating this question type.
But there’s more when it comes to choosing the right online survey platform. You should choose a survey provider that enables you to survey anyone. As such, you’ll need a platform with a reach to millions of consumers, along with one that offers the Distribution Link feature.
The former method works via Random Device Engagement, which targets and gathers respondents where they voluntarily are across different digital channels. Thus, it distributes surveys randomly, across a wide network of digital properties. This includes websites, mobile sites and mobile apps, making for a randomized survey deployment.
The latter method, which uses the Distribution Link feature empowers you to send your survey to specific customers, instead of only deploying them across a large network. This enables you to target respondents you know are your customers via email and social media as well as adding your link across digital channels, such as landing pages, homepages, etc.
It is also important to use a mobile-first platform, as mobile dominates the digital space and no one wants to take surveys in a shoddy mobile environment.
The online survey platform you opt for should also offer artificial intelligence and machine learning to remove low-quality data, offer a broad range of survey and question types and disqualify low-quality data.
With an online survey platform that offers all of these capabilities, you’ll be able to form your ideal survey and easily set up and use the Bipolar Scale question variation.

How to Conduct a Consumer Analysis for Business Growth
How to Conduct a Consumer Analysis for Business Growth

All businesses need to conduct a consumer analysis to achieve any sort of industry success, as it is largely dependent on customer satisfaction. Given that customers are the lifeblood of any business, you should never invest in any marketing or outreach campaign before examining your target market.
76% of customers expect companies to understand their needs. However, only 17% of customers believe that businesses listen to their feedback. This grim statistic highlights the fact that many brands simply don’t use the data they collect, if they collect any at all.
To carry out consumer analysis, brands should not merely gather data from their websites; they need to execute market research, a kind of research that places consumer data at the fore. Consumer analysis is key to the broader practice of market research.
Unfortunately, only 19% of brands conduct consumer analysis, properly segment their audiences and personalize their offers. As such, it is understandable why less than one-fifth of consumers believe brands are listening to them.
This article expounds on consumer analysis, its importance, how to conduct it and how to use market research to perform it.
Understanding Consumer Analysis
Consumer analysis refers to the process of gaining detailed consumer information, typically through market research techniques, which focus on the customer aspect of market analysis.
A consumer analysis involves identifying a target market and its different segments, understanding customer behavior, along with consumer preferences and anything else that affects how customers interact and patronize a business.
To conduct a consumer analysis, businesses need to collect data beyond their websites. This does not end with examining purchase data, returns, payments and advertising costs, as it largely depends on studying the customers themselves.
As such, it involves tracking customer buying behavior, their desires, dislikes, lifestyle, aversions, needs and more.
The purpose of taking part in a consumer analysis is to investigate the portion of any population that is most likely to purchase your products or services, which is typically called a target market. By establishing different groups of consumers and understanding their needs, you can properly cater to them and build consumer loyalty.
The Parts of a Consumer Analysis
This kind of analysis carries several objectives, which the following lays out:
- Producing a profile of consumers: This involves demographic, psychographic, economic, social and geographical characteristics of the consumers.
- It also includes any of their special interests and habits.
- It covers the consumer buying process, which involves how they make their decisions, the time and frequency of their purchase, how they purchase and how they pay.
- Customer profiles can take the form of fictional, yet representational buyers called customer personas.
- Benefits gained by the consumers: These include various benefits that a brand derives from potential and current customers.
- It includes monetary benefits, psychological benefits and high and low involvement benefits, which depend on the products.
- It also encompasses purchaser benefit depending on whether you operate a B2B or B2C business.
- The business’s role in meeting the consumers’ needs: This includes an analysis of your business itself in relation to customers’ needs, pain points and problems.
- You must be able to answer how your business is able to resolve your customers’ problems.
- After identifying different segments and personas, you should rationalize how each group can specifically benefit from your offerings.
The Importance of Consumer Analysis
This kind of analysis is important for several reasons, which carry benefits for your business.
First off, it is necessary for the founding document of a business: the business plan. This kind of analysis is a decisive component of any business plan and in all stages of growth. That’s because this kind of analysis identifies your target market, its value and how your business is particularly equipped to help its target market members.
Forging brand awareness is key for business growth; as such, businesses often spend much of their budget on marketing. Not all channels bring in the same foot traffic and some have higher bounce rates than others. A consumer analysis creates marketing efficiency, as it allows you to understand consumer preferences when it comes to marketing channels and content marketing strategy.
This kind of analysis also allows businesses to be well aware of the motivational factors behind their customers’ purchases. By understanding what motivates consumers to make a purchase, you can improve your business strategies by understanding how to cater to those motivations and needs.
Piggybacking off of the need to understand what motivates your consumers to buy, a consumer analysis helps you increase sales. By understanding the motivations behind purchases, you can market your products and services far more proactively.
This is because by thoroughly analyzing your customers, you’ll be able to tap into their biggest needs and strongest opinions. Knowing these will ensure you avoid negative associations for your consumers while understanding what will have positive effects. This includes understanding cultural trends, along with logistical aspects, such as shipping times.
A consumer analysis can even help improve your profit margins. This is because not every customer is built the same in terms of buying behavior and most importantly, customer lifetime value (CLV). Some consumers will buy from your brand a few times a year, while others may do so on a more regular basis. Other consumers will bring in one-fourth in revenue throughout their relationship with your business, therefore bringing a higher CLV.
By analyzing your different segments and personas, you’ll be able to see which ones are worth marketing certain products/services to. It will also help you adjust your pricing plans accordingly and innovate to suit particular consumer segments.
Finally, this kind of analysis is critical for building and maintaining customer retention, which keeps your business afloat, as it is less expensive to sell to existing customers. By examining your consumers and being attuned to all their quirks and needs, you’ll be able to satisfy them. Doing so on a consistent basis will strengthen your consumer loyalty and enable you to increase your customer retention rate.
How to Conduct a Consumer Analysis with Market Research
Conducting a consumer analysis involves studying your consumers closely after identifying them. As such, there are different approaches to performing this kind of analysis. We stress the importance of market research for completing such an analysis, as it involves the means for gaining the insights you’ll need.
The analysis we put together involves using a market research platform as the main vessel for extracting consumer insights.
The following explains how to conduct a consumer analysis:
- Put together a preliminary list of the demographics you suspect to be in your target market.
- Add in inferences about location and psychographic preferences.
- Perform secondary research on these groups for further information and identification.
- Use a market research platform to conduct primary research on your consumers.
- Create surveys that ask questions that allow you to segment your consumers into different segments based on their demographics, location, lifestyle, buying behaviors and habits.
- Probe further into their psychographics by asking questions about what annoys them and distresses them, along with what they like, desire and prefer, particularly in regards to your niche and products/services.
- Once you have segmented your consumers via the market segmentation methods laid out above, form surveys that address their problems.
- This will allow you to understand how to position your brand favorably and as the solution to their problems and supplier of their needs.
- Create follow-up questions to understand the needs of your consumers, along with what they’re currently doing to meet their needs.
- Ask about their preferences in regards to price, brands and other considerations. For example, the model of a product, its year of release, etc.
- Use the data you garnered as a means to assign value to your different consumer segments.
- It may be too early to calculate your customer lifetime value, unless you’ve already analyzed your consumers previously.
- This is especially true if you’re conducting this analysis in a well-established business, or at least in the aftermath of a business plan.
- Analyze all your data in the dashboard of your online survey platform.
- You should use a platform that offers different visualizations and export options of the data, so that you can share it across your team and truly form data democratization.
- Analyze your own brand in relation to your consumers.
- What are your strongest selling points, especially in regards to your consumer insights?
- How can you help them the most?
- Or, how can you market yourself to point out that you help with all of their needs?
- Show how your company’s product and/or service meets your consumers’ wants and needs.
- Detail how your brand can remove all of their issues in relation to your offerings.
- Take action and form marketing campaigns to reach your consumers.
- You should prioritize which segment and persona to market to first.
Pleasing All Your Consumers
Consumer analysis helps market research professionals determine the desires, needs and difficulties of their consumers. Meeting the needs of consumers increases sales and profits and has the potential to build consumer loyalty.
In this way, by analyzing your target market, you’ll be able to satisfy it, thereby curtailing customer attrition. After all, if you don’t satisfy your customers and they feel that you’re not paying attention to their needs, they can easily switch brands, cutting their business relationship with your brand for good.
Thus, you should conduct a consumer analysis regularly, regardless if you are just putting together a business plan, or have been in business for years. In order to facilitate a consumer analysis, you’ll need to use market research software, particularly a survey platform, as it allows you to conduct primary market research.
Use an online survey platform that makes it easy to create and deploy consumer surveys. It should offer random device engagement (RDE) sampling to reach customers in their natural digital environments.
You should also use a mobile-first platform since mobile dominates the digital space and nobody wants to take surveys in a poorly-built mobile.
Your online survey platform should also offer artificial intelligence and machine learning to remove low-quality data, disqualify low-quality data and offer a broad range of survey and question types.
The survey platform should offer advanced skip logic to route respondents to relevant follow-up questions based on their previous answers. It should also make it easy to form a customer journey survey to survey your respondents across their customer journeys.
Additionally, it should also allow you to survey anyone. You’ll need a platform with a reach to millions of consumers, along with one that offers the Distribution Link feature. This feature will allow you to send your survey to specific customers, instead of only deploying them across a vast network.
With an online survey platform featuring all of these capabilities, you’ll be able to adequately create a consumer analysis.

How To Conduct A Survey That You Can Trust In 8 Steps
How To Conduct A Survey That You Can Trust In 8 Steps

So you want to conduct a survey, not any run-of-the-mill survey, but one that you can trust, that is, one that quickly gathers the total number of survey respondents you selected — with the correct demographic and psychographic traits.
To do so, you’ll need to be able to preset these requirements in an online survey platform.
You’ll first need to find a potent online survey platform, along with understanding how to conduct a survey that provides accurate and reliable data on your target market.
While building a strong survey campaign can appear to be difficult, if not downright intimidating, it is much simpler than it looks. This simplicity will depend on the survey platform you choose, as they are not all the same.
Nonetheless, there’s a process to conduct a survey that you can use across multiple campaigns, whether you need to conduct local or global surveys, study customer behavior, or even increase your customer retention rate.
Luckily, we’ve prepared an easy-to-follow, 8-step process for conducting surveys. This article is an 8-step guide to help you to design, conduct, and organize an effective survey in no time. Let’s dive in.
Table of Contents: How To Conduct A Survey That You Can Trust In 8 Steps
- The Importance of Conducting Surveys
- What You Need to Conduct a Survey
- Steps to Conduct a Survey
- Step 1: Identify Your Research Goal
- Step 2: Define Your Survey Audience
- Step 3: Come up with Preliminary Questions
- Step 4: Design Your Questionnaire
- Step 5: Distribute Your Survey
- Step 6: Organize Survey Responses
- Step 7. Analyze and Present Survey Results
- Step 8: Take Action
- Making Every Survey Count
The Importance of Conducting Surveys
First off, let’s uncover why you should conduct a survey in the first place. After all, there are a variety of other market research techniques you can use, including both primary and secondary research methods.
One of the most important reasons to conduct survey research is due to the prowess of surveys; they grant you original hard data and facts. You can use surveys to study virtually any subject and gain both quantitative and qualitative insights.
Data, especially customer data, is becoming more and more sought after, as 40% of organizations aim to increase data-driven marketing budgets, and 64% of marketing leaders believe that data-driven strategies are vital in today’s economy. Surveys act as a convenient conduit to gain access to any sort of data, whether it is consumer-related or otherwise.
Conducting surveys on your customers is one of the most effective ways to collect invaluable data and gain answers to concerns that are important to you. This is core to market research, as it allows you to better understand those most likely to buy from you, aka, your target market.
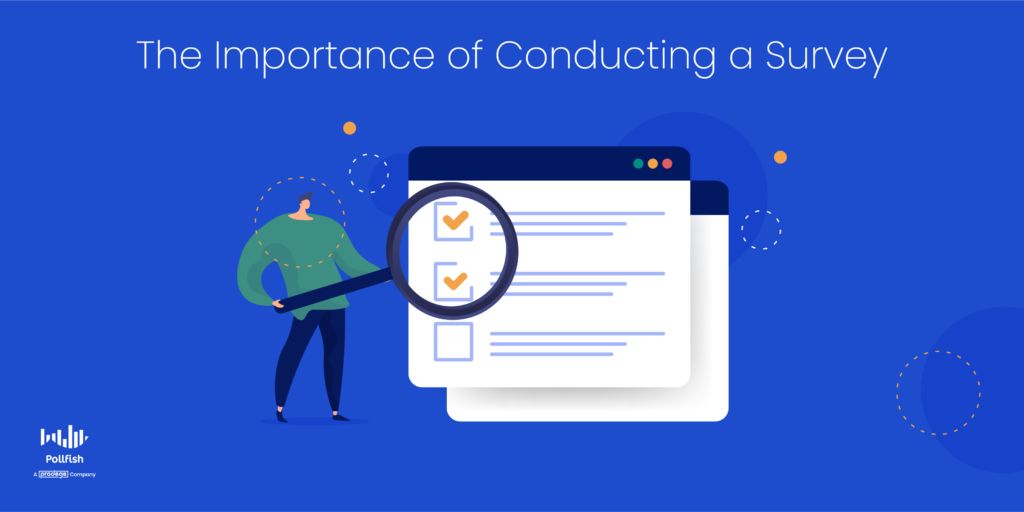
So how can you use surveys as a means of data for decision-making? There are numerous campaigns and insights that surveys can avail and unlock.
Surveys let you uncover hidden growth opportunities, reveal public sentiment, gain deep insights into customer buying behavior, and even get extra media coverage when prominent publications cite the findings of your research.
They also prevent you from making the wrong business decisions, whether it deals with releasing a new product, creating an ad campaign that won’t resonate, appealing to the wrong persona and much more. Thus, surveys allow you to discover your risks, decide on whether they are worth taking and avoid mistakes.
As an added bonus, simply the act of conducting a survey affects customer behavior, along with their opinions of a company. Specifically, the satisfaction of writing a positive survey response creates a desire to buy more of a product. With this information in tow, brands that include their name and likeness can increase sales simply by conducting a survey.
As such, surveys don’t merely provide you with an understanding of your customers’ needs, wants and sentiments; they also allow you to affect their perception of your brand and their willingness to buy from you.
In this way, and as mentioned in the above link, surveys, especially those that provide positive experiences, contribute to your revenue, which keeps your business afloat. Aside from granting you new customers, you can also use them to survey existing customers.
By offering them a good experience and presenting your company in the best possible light, surveys also help you boost consumer loyalty, which is an absolute must. Loyalty is the core of customer retention, which is often cited as more important than customer acquisition.
For example, did you know that 80% of profits come from just 20% of your existing customers? In addition, retaining customers is far less costly than acquiring new ones. There are plenty of statistics that back up the claim that customer retention is both more profitable and less expensive to achieve than customer acquisition.
For example, consider the following:
- Increasing customer retention by just 5% can increase profits from 25-95%.
- The success rate of selling to an existing customer is between 60-70%, while the success rate of selling to a new customer is only 5-20%.
All in all, conducting a survey is crucial to the well-being of your customers and your business. Surveys help you unearth virtually any insights which you can then use to guide your next or ongoing business move.
What You Need to Conduct a Survey
If you want to get meaningful results that you can act on, there are certain things you’ll need to have and certain actions you’ll need to take. These will steer your survey campaign in the right direction, give you the most accurate and useful results and ward off survey bias.
Before we dive into the steps to conduct a survey, let’s glance over the things you’ll need (not all of which are tangible), to conduct your survey. These are a must and must be present within the online survey platform (or market research agency) that you use.
The following list lays out everything you need to conduct a successful survey:
- Survey the correct population,
- Use the correct survey distribution method (see Step 5)
- Make sure your survey provides a pleasant survey experience
- This includes ALL digital properties where your survey will live, such as websites, mobile sites, apps and more.
- Have the ability to customize your surveys to your liking
- Have various questionnaire building options, such as
- Survey templates
- Advanced skip logic
- Different screening options for demographic and psychographic screening
- A filtering system
- Screening questions
- A wide variety of question types you can use, such as
- Matrix questions
- Open-ending questions
- Likert scale questions
- Rating scale questions
- Be able to create a variety of specialized surveys, such as
- The Net Promoter Score (NPS) survey

- The Customer Satisfaction Score Survey, aka, CSAT survey
- The CET (Customer Effort Score survey)
- Visual rating surveys, which include
- ones that use hearts,
- stars
- emojis
- other visual ratings as scaled questions).
- Both B2C and B2B surveys
- The Net Promoter Score (NPS) survey
- Access to granular insights via a post-survey results dashboard and a survey builder.
- Use a platform that offers 24-hour technical support
- Can conduct global market research
- Leverage a system that offers a wealth of technical and quality checks to avoid survey fraud
- This helps you avoid
- Gibberish answers
- Respondents who aren’t paying attention
- Flatliners (those who keep answering with the same choice in multiple-choice questions)
- Bots
- Those hiding their location via VPN
- This helps you avoid
As you can gather, there are various elements to a successful survey. You’ll need to therefore carefully select your market research platform — or agency, if you’re taking the syndicated research path.
You don’t want to settle for a low-tier platform, otherwise, you risk collecting unneeded biases and a whole host of low-quality data.
Steps to Conduct a Survey
Follow along the 8 steps in this guide to conduct meaningful survey research.
- Step 1: Identify your research goals
- Step 2: Define your target audience
- Step 3: Come up with preliminary questions
- Step 4: Design your questionnaire
- Step 5: Distribute your survey
- Step 6: Organize survey responses
- Step 7: Analyze and present survey results
- Step 8: Take action
Step 1: Identify Your Research Goal
Every successful survey has a purpose. You’ll need to identify yours to get started. This will serve as the basis of the entire survey campaign.
In order to identify your research goal, you’ll need to consider the insights your business needs most. Consider the following questions to ask yourself and your team:
- Do you need to steer an advertising campaign?
- Do you need to form a marketing strategy?
- Are you trying to find out why you are losing customers?
- Do you want to know if your policies are effective?
- Are you figuring out what to do in the current market?
- Do you need to discover your own employees’ sentiment about your workplace?
- Would you like to cut back your customer attrition rate?
The kinds of questions you need to ask yourself and your company’s different departments are limitless.
We suggest forming a survey that relates to your most pressing needs, or setting up a proactive survey study, that is, a survey campaign designed before you go through with something, such as designing a new feature or ad.
Understanding your survey’s main goal both improves its quality and reduces the time you’ll spend on executing your research.
In case you struggle to pinpoint your exact goal, write down a list of all the questions and issues your market research campaign needs and prioritize the most important ones.
In addition, ask yourself and your team questions to better understand your own standing in regards to market research, your existing tools, campaigns and more. These are your peripheral questions, which will help you determine your key research goal.
The following questions will help you understand your survey goal better:
- Do you understand who comprises your target market?
- Do you need to segment your target market further?
- Do you already have any existing data that you can use?
- Do you need data to improve an existing product or launch another?
- What resources do you have to perform the survey?
- What actions are you going to take after the survey is complete?
After you have figured out the main goal of your research, you will need to define your survey audience.
Step 2: Define Your Survey Audience
Identifying your survey target audience is key to any successful market research campaign. After all, it is the audience that you seek to study, to learn how its members tick, their habits, sentiments, etc.
The wrong survey audience will invalidate your study, as it will be irrelevant to your business or study.
There are two main concerns when it comes to surveying participants: who should I survey and how many participants do I need?
Let’s clarify both.

Who should I survey and who is in my target market?
Surveying the right people makes all the difference. That’s why before determining your survey audience, you’ll need to first identify the makeup of your target market. To do so, you’ll need to conduct secondary research, along with consolidating what you already know about your target market.
In addition, you’ll need to conduct market segmentation, which will allow you to break your wider target market into various segments. These can exist on the basis of various factors, such as age, ethnicity and other demographic factors, along with behavioral aspects, such as buying habits, frequency of purchase, brand trust and more.
You can do this by conducting an RFM analysis, which is an abbreviation of Recency, Frequency and Monetary Value. In this analysis, researchers estimate the value of a customer based on the three data points in its abbreviated title. This is one of the models for customer behavior segmentation.
Targeting a specific audience is important for many reasons. For example, suppose you want to learn if iPhone users are happy with the recent product updates.
By surveying random iPhone users, you may notice that the majority of responses are somewhat neutral. But if you target specifically the Gen Z generation, you might learn that the younger demographic is worried about having to buy extra accessories.
The more defined your target audience criteria are, the more accurate and deep your survey insights will be. Thus, make sure to brainstorm, segment and fully identify your target market and your own customer personas before setting up your survey questionnaire.
Identifying them first will show you which target audience you’ll need for your survey to gain the most accurate insights and help you fulfill your survey goal.
How many survey respondents do I need?
When doctors want to examine your blood, they don’t drain all of it - they just need to take a small sample. The same principle stands with surveys: a small sample of survey respondents can accurately represent the opinions of a larger group.
For example, if there are 5,000 people in your company and you want to know how well the latest HR policy was received, you don’t need to survey all 5,000. In fact, surveying just 146 employees will be enough.
Thus, if you want to learn what all American high schoolers think about the recent TikTok ban, you don’t need to ask all 76 million of them. Surveying between 200 and 600 respondents will give you a sufficient amount of opinions to draw from.
For the majority of studies, 200 to 800 respondents will be enough to represent the thoughts and opinions of a particular population. However, all studies are not built the same, nor are they geared towards the same kind of longevity, think longitudinal surveys versus cross-sectional surveys.
As such, you’ll need to calculate your survey sampling size, which is also referred to as a sampling pool.
If you want to calculate how many respondents you’ll need to get scientifically accurate survey results, feel free to use our sample size calculator.
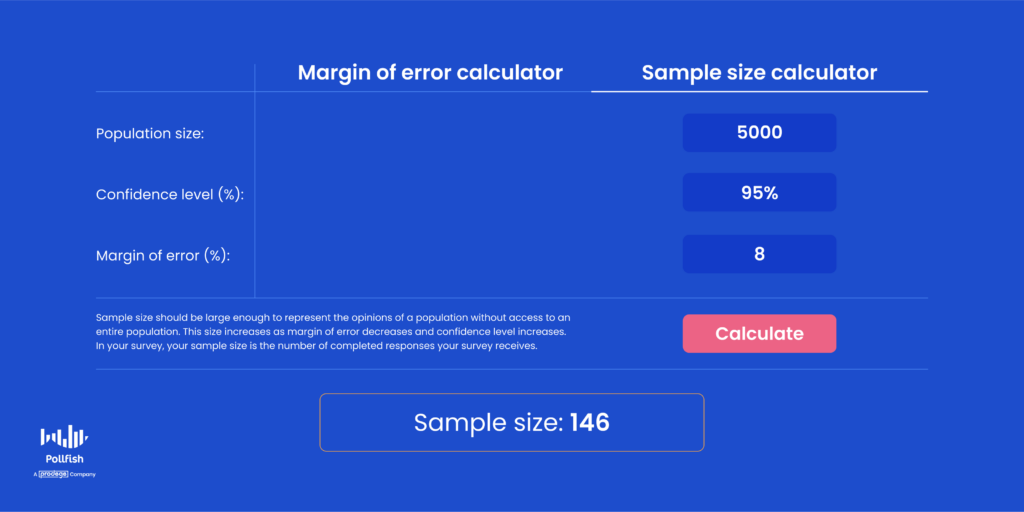
Step 3: Come up with Preliminary Questions
Now that you’ve carefully selected a main survey goal and theme, along with having identified who to survey and how many to include in your sampling size, it is time to get to the heart of your survey: the questionnaire — or at least the beginning of it.
To do this, you’ll need to consider the main goal and subgoals of your survey campaign. As such, write down the most pressing questions you have. We suggest coming up with a list of 10 questions.
Note that not ALL of them need to be in your survey, in fact, we suggest keeping your questionnaire short. Even users of a game who’ve come across your survey and decided to take it for in-game survey incentives will hesitate to take a lengthy survey.
As such, your preliminary 10 (or more) questions are just that: preliminary. Not all of them will make it to your questionnaire, as they are meant for brainstorming ideas.
As you create these questions, heed the following tips:
- Create questions based on the survey campaign you’re going to use.
- For example, if you’re going to run a longitudinal study, you’ll need to create questions that span through various time periods.
- Or, for a cross-sectional study, you’ll need to create questions for just one survey and thus have one primary focus of the study.
- Do any of your questions appear too similar to one another? If so, consider merging them or removing a few.
- Decide whether certain questions need follow-up questions.
- For example, if you ask a question in which a certain answer requires more information, consider using follow-up questions.
- That’s where advanced skip logic becomes handy, as it routes respondents to relevant follow-up questions.
- This creates paths in your survey and allows you to understand your respondents and the subject of the original question at a deeper level.
- This can also be relevant to the first point, as you can use similar questions as potential follow-up questions.
- Do your questions pertain to certain customer segments or personas?
- If so, refer to your customer segmentation and personas list. You may need to break your survey into two or more, depending on how many customer segments it can be used for.
- You can also add multiple audiences in one survey.
- Show your preliminary set of questions to your team/colleagues for their feedback and suggestions.
- Here, you can get into the nitty-gritty of what is most important for your study by way of other relevant opinions that will help shape it.
Step 4: Design Your Questionnaire
Next, we’re going to move on to designing the questionnaire itself. This will largely depend on the survey platform you use. As aforementioned, you’ll need to use a strong market research SaaS platform that offers a variety of features and services to form a robust survey campaign.

Make sure your survey platform allows you to build the questions you need at ease and speed.
It’s key to note that the quality of a questionnaire is where the majority of surveys fall short. Experiments suggest that sensitive or vague opinion questions increase the potential of error by up to 30%. Put simply, your survey is as good as your questionnaire is.
Make sure your questions are clear and don’t contain jargon or uncommon abbreviations. This is key to shaping the survey experience.
A poor example of a survey question: Do you think VR is going to take off in the next 5 years?
A better example of a survey question: Do you think virtual reality (VR) is going to take off in the next 5 years?
In some instances, a poor question is one that yields scant information. In this case, it is key to follow it up with another, or create it so that it doesn’t require additional questions to begin with. In this case, a yes or no question constitutes a poor example, whereas an open-ended question is the better example.
A poor example: Do you agree that this is a great movie?
A better example: What do you think of this movie?
Take some time to learn how to write clear, unbiased, and effective survey questions to get the best results out of your research.
Step 5: Distribute Your Survey
There are several ways to distribute a survey. These include legacy distribution methods and modern ones. While it may not appear to be very important, choosing how your survey is distributed is as important as choosing who you want to survey.
This is because survey distribution accounts for many aspects of your study, including the following:
- Where your survey will exist
- In the digital vs analog world
- On websites or apps
- Used as part of a focus group
- If your target market see your survey based on its distribution channel(s)
- When your target market will see your survey
- How quickly you’ll gain respondents and completed surveys
- When you can access your post-survey dashboard
- When you can carry out a survey data analysis
- Associations of your brand (if you mention it in the survey)
- How long it takes to complete your survey
- For example, an online survey platform that continues iterating until it receives all required responses works faster than do interviews that a market research firm conducts.
The environment of the survey is critical to its exposure by your target market, as Point 2 states. This is because different demographics spend time online (and in the real world) differently.
Let’s continue with the example of surveying Gen Z iPhone users. Suppose you moderate a local school Facebook group and decide to post your survey there. Even if you get a large number of responses, the results may not accurately affect this demographic.
This is because in this case, you don't pick survey participants randomly, instead, you survey only those who joined the local school Facebook group that you conveniently happen to moderate.
This is called convenience sampling, since the majority of survey participants unintentionally live in one area. The survey didn’t account for Gen Z users from other areas with different average household incomes.
To ensure you get the most accurate survey results, use a survey platform that can help you reach your targeted demographics more precisely and at speed. In short, avoid convenience sampling.
Instead, opt for organic sampling, which gathers survey respondents by distributing your survey to the places they spend their time organically. On the Pollfish online survey platform, we use organic sampling in the form of RDE sampling, or Random Device Engagement sampling.
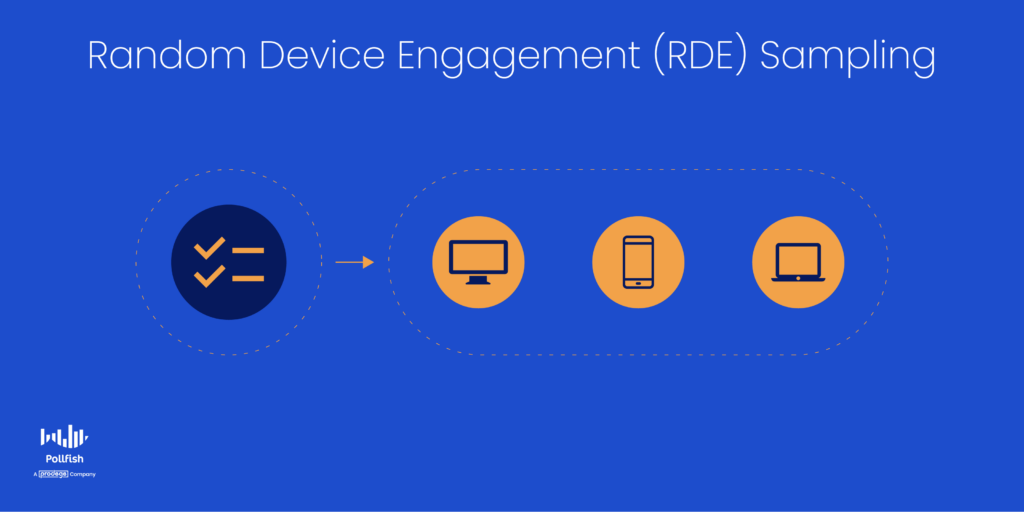 RDE sampling is a kind of organic sampling in which polling relies on advertising networks, or other portals on digital devices, to engage random people where they naturally spend time. This can occur on gaming and mobile apps.
This is the opposite of a research panel, which is a research method that pre-recruits and prescreens a group of research participants who have opted in to take part as the studied subjects of a market research campaign.
Lastly, before we provide a few examples of survey distribution methods, it is also critical to be strategic about when to send your survey. For this, we recommend reading our quick guide on the best time to send a survey.
Here are a few common ways to distribute your surveys:
- Email. You can distribute your survey by email, especially if you have access to an established email list. The two main drawbacks of email surveys are that it’s harder to set specific target audience parameters and email response rates are generally low.
- Social media: if you survey people via social media channels, beware that sometimes social media groups attract people with shared interests that may not represent the opinion of your target audience or the general public.
- Online survey platforms: survey platforms such as Pollfish allow you to hyper-target specific audiences, control the number of participants, distribute the survey in different ways, reach all quotas, easily organize your survey results and more.
- Survey panels: A survey panel is a consistent group of survey participants, who have pre-recruited and pre-screened, who opt into a survey study. Researchers would return to the same people to run surveys or host interviews repeatedly over time.
- Syndicated research: Syndicated research refers to research conducted by a market research firm, oftentimes independently. It is published and sold by a market research firm, which is usually industry-specific and funded by several companies within a particular industry. The firm and its partner companies own the data that the firm collects. Other companies in their particular industry may purchase the data.
Besides these prominent survey channels, there are other survey solutions you can use; make sure to select the one most pertinent to your market research needs.
Step 6: Organize Survey Responses
After you’ve gathered your responses, you’ll need to organize the data before starting your analysis. As with the prior steps, this will largely depend on your survey tool, which also dictates your survey distribution, audience targeting and creation.
Here are the steps to prepare your data for analysis:
- Clean. Sometimes people fill out the survey twice by mistake. Although Pollfish survey technology prevents duplicate responses altogether, if you’re conducting a survey on your own, or via syndicated research, make sure to clean duplicates and “funny” answers before you proceed to organize your data.
- Organize. Group survey answers that are similar to each other and try finding patterns that allow you to structure your data.
- Visualize. Try finding ways of visualizing survey responses using graphs, charts and images. Visualized survey data is easier to analyze and refer to, especially if you want to share survey results with other people.
Step 7. Analyze and Present Survey Results
The data you collected during your survey can be presented and analyzed in many different ways, so make sure to go back to the survey goal that we covered in Step 1.
Analyzing survey results and writing a report often go hand in hand, so it’s a good practice to go back and forth between the two until you fully narrow down your findings.
Here are some questions that will help you write a better report:
- Did you achieve your survey goals?
- How can you organize your findings into cohesive narratives?
- What are the main insights that you gathered?
- How can you use the collected data in the future?
- Are there other ways this data can be interpreted?
Keep your margin of error in mind during your survey analysis. This measurement points to the degree of error in the results of a survey, specifically one that relies on the random sampling method.
It is imperative to keep the margin of error low, as a high margin of error reveals a smaller likelihood of survey results to reflect the true views of your survey target audience. As such, a higher margin of error renders your survey less reliable and inconclusive.
If you are presenting a report to others, remember that different audiences may be interested in different aspects of your survey.
In case your audience is primarily business stakeholders, then the main focus should be concrete customer preferences or aversions, along with actionable suggestions.
If you are presenting a survey to other researchers, they will be more interested in the technical aspects of your survey such as target audience, sample size, and data analysis method.
Make sure to consolidate your survey data analysis into one document. The document should be divided into the themes, patterns and other central areas of focus of which you’ve collected and analyzed data to draw different conclusions.
It will be this data — not the raw data in your dashboard — that will guide your business decisions, changes and all other courses of action.
Step 8: Take Action
In this step, you’re going to consult the information you’ve gathered and analyzed in Steps 6 and 7. You’ll need to create a document of your findings, one that exists outside your dashboard and is central to your survey analysis.
This document should cover central findings, along with key granular ones. It should also answer some of the key concerns you had in Step 1, along with the questions designed for your respondents themselves.
Do your results and analysis answer all the inquiries and curiosities you had about the topic at hand? If so, it is time to take action. If not, then you should create another survey, one that focuses on the things that are left unanswered, or anything you need more information on.
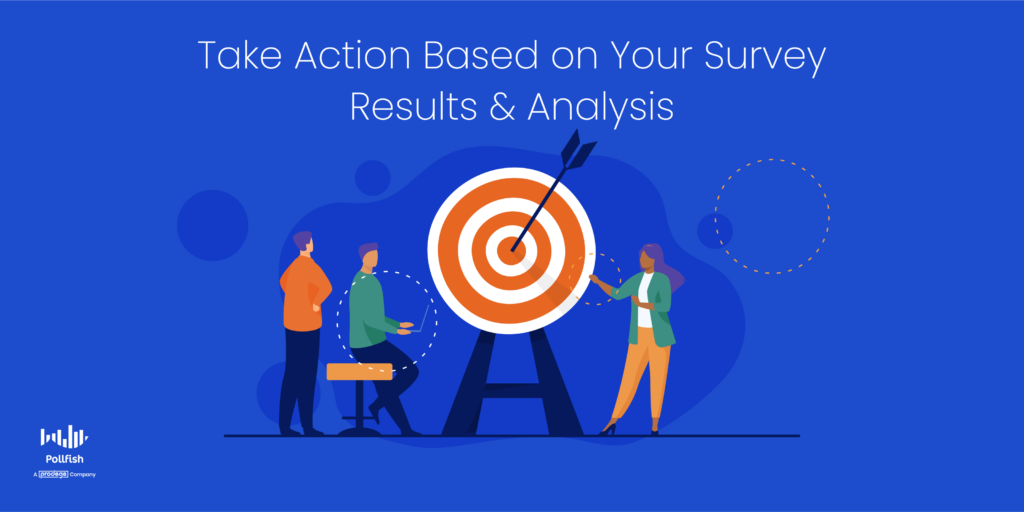
Sometimes, the latter is most common, with survey campaigns lacking clarity, therefore lacking completion. However, not to worry, just create another survey. If you have the contact information of your respondents, just send them a follow-up survey. If not, send your new survey as you had originally done.
We recommend using an online survey provider that offers the random device engagement method, which, as aforementioned, is a kind of organic sampling that uses digital properties to query respondents where they visit organically.
If, however, you have all the insights you need, it is time to take data-informed action. There are many ways to take action on any given topic. The following list enumerates various ways to act on your survey data and analysis:
- The establishment of something (ad campaigns, marketing strategy, pricing, a slogan, etc)
- Changing something already in existence (ads, videos, promotions, pricing, etc)
- Scrapping aspects of an ad, marketing, sales or any other business campaign or activity
- Terminating an action or campaign entirely
- The formation of slightly different approaches based on different market segments
All in all, after you’ve followed these steps, you will be much closer to your original goal, whether it is solely to have invaluable customer/subject data, or to use that data to make immediate or long-term decisions.
Therein lies the power of surveys, they grant you the knowledge you can use for a host of decision-making.
Making Every Survey Count
Every business has a slew of questions about its industry, competitors and customers. As such, they must use market research to crack these challenges and properly serve their target market.
Conducting a survey is at the forefront of conducting this kind of research, as it grants you firsthand insights, tailored specifically to your target market, with your most requisite questions.
The challenge in conducting a survey manifold: finding a survey solution to easily distribute your questions to the right audience, creating a survey with the proper questions, distributing the survey in the right channels, consolidating your data and more.
Following our eight steps will help you conduct meaningful and unbiased surveys to answer your most demanding questions. However, adhering to this process is not enough.
You’ll need to find a potent online survey platform to facilitate your entire survey process, from targeting, to questionnaire building, filtering data and more.
Ideally, it should provide various quality and technical checks to ward off survey fraud, offer a mobile-first survey environment and allow you to survey anyone, not just via on network on the RDE method (although this method is incredibly effective).
It should allow you to survey specific people, such as via email, or whichever digital channel you seek to use. Luckily, there’s the Distribution Link feature, which enables you to do just that.
Good luck!
Frequently asked questions
What is the first step in planning a successful survey?
Before writing questions or recruiting participants, you should establish the goals of your survey. By understanding goals, you can ensure your survey stays focused and will answer your most important questions.
Why are surveys used?
Surveys are one of the best ways to gather information about your customers or target audience. As opposed to simply researching an industry or trend, surveys let you ask specific questions to the people who matter most to your business.
Why is it important to define the target audience for your survey?
A more defined audience will lead to deeper, more relevant insights. A carefully defined audience provides more accurate results and ensures the goals of your survey are met.
How can online surveys be distributed?
Online surveys can be distributed via email, social media, or a professional survey platform.
How many people should take an online survey?
The number of respondents needed will vary from one survey to the next. The important part is that the sample size accurately represents the target audience. For most studies, a sample size of 200 - 400 is a good goal.

Sending and Targeting Surveys to Anyone With the Distribution Link
Sending and Targeting Surveys to Anyone With the New Distribution Link

The Pollfish platform just got much more powerful. We now offer another major way to deploy surveys so that researchers can target the exact people they seek to study for all of their research needs.
We’re thrilled to introduce the Distribution Link, a feature that completes the Pollfish survey distribution and deployment functionality. It is currently FREE to use this DIY market research tool.
With this latest feature, you can target respondents in the most precise way: via their identities instead of their demographics, location, and other screening filters you’ll find on our platform.
This feature fortifies your survey outreach process, arming you with the knowledge of specific respondents. As such, it provides a powerful addition to market research techniques and gives you the full Pollfish experience.
This article explains the Pollfish Distribution Link feature, so that you can apply it to all your unique respondent targeting needs.
Understanding the Pollfish Distribution Link Product Feature
The Distribution Link is a new product feature for distributing your surveys to the exact targets you seek to complete them. It serves as an alternative to our current survey deployment method: that of random device engagement sampling or RDE sampling.
With RDE sampling, the Pollfish platform launches your survey to hundreds of thousands of highly-trafficked websites, mobile sites and apps, prompting random internet users to take your surveys. Of course, only those who qualify to take it based on your screening section are granted entry into the survey.
This way, only members of your targeted population will participate in your survey and they are targeted in a completely randomized way. While this strategy is useful and efficient, bringing you quality data and speed to insights, it was rather incomplete.
This is not to say that you couldn’t extract high-quality data from the Pollfish platform through its survey fraud protection and quality checks system or that you couldn’t target people based on demographics, psychographics, location, etc via the RDE approach. In fact, that is exactly what the RDE method was built for: quick insights from a vast and random sampling pool.
While this is an innovative approach, it was incomplete in that it didn’t allow you to send your survey(s) yourself to specific individuals. But now you can with the Distribution Link feature.
The Distribution Link allows researchers to send their survey(s) themselves to their exact targets, actual individuals rather than a random pool. But it can do much more.
Since this feature is a link, you can send it through various means and reap various benefits.
Distribution Link Facts, Cost and How to Add it to Your Survey Campaign
The researcher can create a draft and instead of distributing it via the Pollfish network, they can generate a link that potential respondents can click on to reach the survey. As such, there will be no checkout page, but a link that researchers can share across mediums.
The first release is available for all accounts for free.
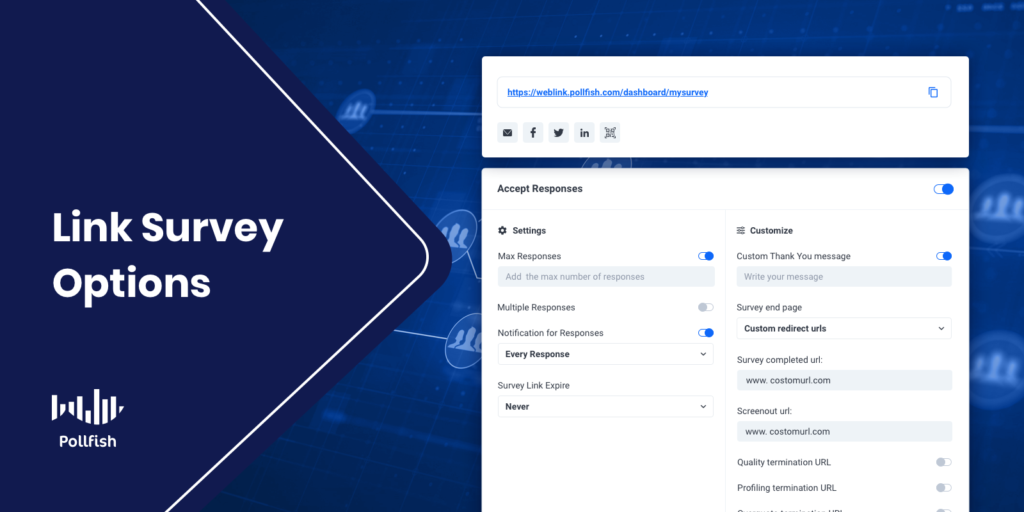
The following explains how to apply the Distribution Link feature to your survey:
- Click on ‘’Create new survey’’ on the Pollfish platform.
- Then, select the option of “create a link” to share the survey.
- Select to start through a template or from scratch.
- You’ll then be directed to the Questionnaire page, where you can select your intended respondent demographics and other qualifications.
- You can also add screening questions that will allow or bar entry to the survey to respondents who answer them in a particular way.
- After filtering options in the Questionnaire page, Then you’ll be taken to the Questionnaire page, where you can design your questionnaire or alter the template.
- If you want to screen your audience do so through the ADL tab.
- When you send a user to the end of a survey through the ADL tab, this is due to:
- A successful survey completion
- Screen out termination
- Profiling termination
- Quality termination
Please note the following changes we’ve made in 2022:
Quality termination is replacing the Disqualification rules feature in the Distribution Link feature. Additionally, screenout and profiling terminations through ADL are replacing the Audience page and screening questions in this feature.


Capabilities and Benefits of the Distribution Link Feature
This feature presents a potent way to collect survey responses; as such, it is another means of survey sampling methods. It has a slew of various capabilities and benefits. The following lists all that researchers can do with the Distribution Link feature:
- Appears as an easy-to-access, sharable link.
- Allows you to hyper-target your target market sample.
- Permits you to reach specific individuals.
- Grants you the power to survey consumers and leads at key moments in their customer journey.
- Enables you to gain consumer opinions about events in their customer experience (CX) while they’re fresh on their minds.
- Allows you to understand what customers don’t like or where you went wrong as these events are still occurring.
- Gives you access into the minds of specific people, at specific times in their CX.
- Makes it possible to ask consumers about your company, specifically, their experience with it, as opposed to more general questions about their thoughts about your niche and cultural climate.
- Brings you insights from key stakeholders and players in your industry and certain companies.
- Provides an alternative survey sampling approach you can use alongside RDE sampling, allowing you to conduct comparative analyses between the two sets of data.
Methods and Campaigns to Use with the Distribution Link Feature
The Distribution Link feature opens doors to conducting several key market research campaigns. It also augments your survey deployment by providing more methods of sending your surveys. This means you are not limited to sending the surveys to specific people through a single channel.
Instead, this feature offers far more options to carry out your research campaigns and reap critical data for decision making. As such, it diversifies your options for distributing your surveys, along with enabling you to carry out and refine critical business campaigns.

The following lists the different methods and campaigns you can use with the Distribution Link feature:
- Email Specific Targets
- This serves as the classic method for inviting targeted people to take your survey.
- You ought to email consumers at specific times in their customer buying journey.
- There are various points in the customer journey and sales funnel that are opportune to survey your target market, such as: post-purchase, cart abandonment/ lack of purchase, bounces, email list sign-ups, a discussion with a representative, etc.
- There are several best practices you should use to increase your survey completion rate if you choose to email your targets.
- Social Media survey invitations.
- With the Distribution Link feature, you can copy/paste the link to the survey you want to deploy across any social media channel.
- This way, you can compare visitors from social media with other means of extracting data, whether it is with other Distribution LInk methods or via RDE sampling.
- B2B Feedback via B2B surveys
- You can gain critical insights with your business clients, vendors and partners to smooth various contracts, processes, integrations and other business dealings.
- With this feature, you can contact these entities directly, so you’ll know exactly who has provided answers to your survey.
- Create this survey type with the correct B2B survey questions.
- Content Marketing Strategy campaigns
- With RDE sampling, you cannot reach out to specific site users that visited and interacted with your website and its content.
- With the Distribution Link feature, you can survey people who have interacted with your content, are subscribed to your newsletter, visit your site regularly, have signed up for a mailing list, etc.
- The link allows you to attach your brand and its experience to the survey, which is also useful for brand visibility.
- Demand Generation campaigns
- If you do not want to directly mention your survey in social media or email messages/campaigns, you can still use the Distribution Link in your landing pages.
- This provides a more indirect way to access your survey, however, a landing page can provide an in-depth explanation, or a bulleted list describing your survey.
- Use CTAs in your landing pages to link to your Distribution Link survey.
- Employee Feedback Survey Campaigns
- Send surveys to your team only, or even specific departments with various employee-facing surveys.
- Use the employee satisfaction survey or the eNPS survey to gauge employee fulfillment, happiness and how likely they are to recommend working at your organization.
- Keep burnout at bay with the employee burnout survey.
- Recognize high-performing and hard-working employees with the employee recognition survey.
How to Use the Feature
- Create your questionnaire
- Select if you want to ask a question and screen the respondents (for profiling, quality, or screener) through the ADL.
- The Link Settings page is combined with the Share page title :
- Set up maximum responses if need be.
- Allow multiple responses from the same respondent.
- Select if you want to be informed of new responses.
- Set an expiration date for your survey.
- Add a custom “thank you” message.
- Select what will occur when a respondent adds a complete
- Send them to the Pollfish homepage.
- Send them to the results.
- Add custom redirect links.
- The results will be the same as regular ones, with the ability to delete a response.
Passthrough Parameters
This is a new implementation for 2022. In conjunction with the redirect URLs, we now support passthrough parameters. This feature allows researchers to pass different identifiers and parameters through the distribution entry link and redirect URL’s for each respondent or a batch of respondents. All parameters are also saved and are available at the XLS export.
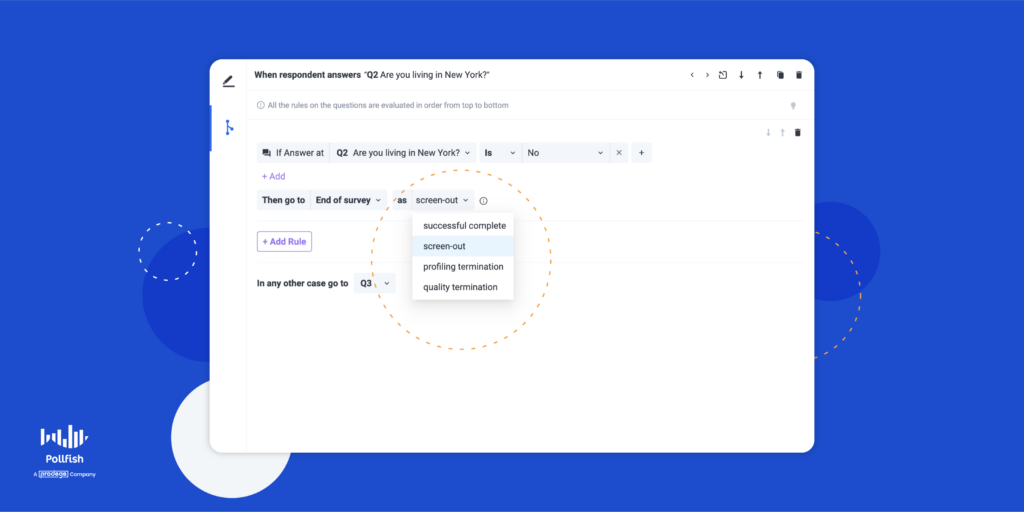
Passthrough parameters allow you to pass information to and from a website by simply adding, or appending, specific information to the end of a URL.
You can append as many parameters as you want to your survey link.So what is their purpose in the context of market research? They enable researchers to pass different identifiers, AKA, parameters through survey URLs. The respondents then retrieve them through the redirect URLs.
They are predominantly used to track and match a respondent with a certain response. In Pollfish, you append the user ID at the entry URL and retrieve it at the redirect URL.
By doing so, you can match a respondent profile from the Pollfish respondent pool with a response on a Distribution Link survey.
Personalizing Your Survey Campaigns
Personalization is crucial in marketing and market research and with the Distribution Link feature, you have the option of personalizing your survey to its targeted respondents. You may know exactly who you seek to target if you’re setting up a B2B survey with a client, vendor or partner.
Or, if a customer on your website provides their key identifying details, such as their name, location, email address and more, this also gives you an avenue for personalization. You can then set up a personalized survey and send it to specific individuals with the Distribution Link.The key is to use a strong online survey platform like Pollfish, which now arms you with this link feature that makes it easy to make your own survey in only three steps. With the Distribution Link feature, Pollfish empowers your market research and general research campaigns more than ever before.