11 Best Survey Software for Market Research in 2025
When selecting the best survey software for your market research needs, these essential factors deserve careful consideration:
- Data quality: Beware of survey tools that buy respondents from third-party vendors, because this introduces significant quality control issues that compromise your research data integrity (more on this later). Instead, choose platforms that own and manage their respondent communities directly for fundamentally more accurate research results.
- Flexible survey design capabilities: Your research needs are specific and unique — never settle for “close enough” when designing your surveys, as even minor compromises can significantly distort your findings. Without precise audience targeting, you risk collecting data from irrelevant respondents who don’t represent your population of interest, while platforms with limited questionnaire design tools force compromises in question structure and logic flows that yield unreliable responses, and inadequate data analysis capabilities leave critical insights buried in your survey data.
- Pricing structure & transparency: Consider the advantages of flexible pay-per-response models against expensive monthly or yearly subscriptions that might include capacity you won’t use. Pay attention to the importance of upfront pricing transparency and avoid platforms with hidden fees that appear only after you’ve committed.
We’ll start by discussing how Pollfish (our own product) performs in these areas, and categorize the tools in this list into two groups: premium tools with advanced functionality and entry-level options.
Best Survey Software for Market Research
Premium Tools with Advanced Functionality
1. Pollfish
Here’s a brief overview of what we’ll discuss in this section:
How Pollfish leverages proprietary respondent communities instead of external third-party panels
- Competitor limitations: Rather than maintaining their own respondent communities, most survey platforms acquire survey participants from external 3rd-party panel providers. This creates serious data quality concerns through “professional survey takers,” response manipulation, and a growing survey fraud epidemic.
- Pollfish’s approach: Pollfish takes a fundamentally different approach by owning and nurturing our respondent communities directly, implementing rigorous verification and anti-fraud processes, providing precise behavioral targeting based on verified actions (not just self-reported preferences), and more.
3 key feature categories that influence research quality
- Audience targeting: You may require reaching a highly specific audience segment, but find yourself constrained by limited targeting options, ultimately settling for a broader respondent group that only partially matches your target demographic.
- Questionnaire design: When crafting your survey, you might envision dynamic question formats or sophisticated branching logic, only to find the platform’s survey building capabilities don’t support these advanced requirements.
- Data analysis: It’s disappointing when a platform provides only basic analytical tools, forcing you to export raw data and rely on external applications (like Excel) to perform the in-depth analysis essential for actionable insights.
Transparent pay-per-response pricing model (rather than being locked into a subscription)
- Competitor limitations: Many survey software charge expensive monthly or annual subscription fees that lock you into paying for capacity you may not fully utilize. Others have confusing pricing with hidden costs that only become apparent after you’ve committed.
- Pollfish’s approach: We offer transparent, pay-as-you-go pricing that allows you to pay only for the responses you need, with no surprise fees.
Let’s explore each of these areas in more detail.
While Competitors Rely on External Third Party Panels, Pollfish Leverages Proprietary Respondent Communities
Most survey platforms don’t maintain their own respondent communities. Instead, they acquire survey participants from external 3rd-party panel providers, which often employ a cash-for-completion model where participants specifically enroll to earn money through surveys.
This leads to what we call “professional survey takers”, who participate in dozens of surveys weekly across multiple platforms primarily as an income source. These respondents are motivated by speed and quantity (not thoughtful participation), and they provide answers that will qualify them for surveys, regardless of truth.
In addition, many 3rd-party panel providers operate as “black boxes,” concealing their methods for combating survey fraud. This lack of transparency is concerning because survey fraud isn’t just a minor data quality issue — it’s a pervasive threat that can completely undermine the validity of your market research. There are now organized networks using AI-powered tools, device farms, and identity spoofing to generate convincingly human-like responses. (The survey fraud ecosystem has grown increasingly sophisticated).
When your survey results come from “professional survey takers” or fraudulent respondents, you’re building business strategies on fundamentally misleading information. Imagine investing six months and significant resources developing a new product line because survey results showed strong demand, only to launch it and discover actual customers have little interest. This disconnect between research findings and market reality doesn’t just waste resources — it affects your credibility with stakeholders and deflates team morale.
At Pollfish, We Have a Fundamentally Different Approach
Unlike competitors who rely on third-party panels, Pollfish (through parent company Prodege) owns and operates an extensive network of consumer communities.
This end-to-end ownership of the respondent ecosystem enables Pollfish to implement multi-layered quality controls, sophisticated targeting, and seamless in-app engagement, delivering higher quality survey responses that competitors using 3rd-party panels cannot match.
The key data quality advantages of Pollfish’s owned respondent ecosystem include:
✅ Incentives through natural environmental engagement
Surveys are seamlessly integrated into apps that people already use and enjoy in their daily lives for purposes like gaming, shopping, or entertainment. Respondents can earn in-app rewards or incentives for completing surveys, such as bonus lives in a game or discounts on purchases.
By engaging users during their regular in-app activities instead of in dedicated survey environments (where respondents might be mindlessly clicking through their 20th consecutive questionnaire), Pollfish captures more genuine, thoughtful responses that better reflect people’s true opinions and preferences.
✅ Authenticated purchase history via digital receipt uploads
Pollfish’s ecosystem rewards respondents not just for taking surveys but also for uploading actual shopping receipts to earn cashback. This verification process serves two vital purposes:
- First, it confirms that respondents are genuine humans, not bots or fraudulent accounts.
- Second, when building your survey audience in Pollfish, you can precisely target respondents based on their documented purchase history — for example, specifically reaching people who have bought Cheerios in the last month, purchased Nike products, or shopped at Walmart. This behavioral targeting is based on proven actions verified through receipt uploads, not just what respondents claim about themselves, significantly increasing the reliability of your audience selection.
✅ Sophisticated respondent verification system
Every participant in Pollfish’s ecosystem undergoes a comprehensive validation process that starts before they ever see a client survey:
- Mandatory 30-day evaluation period: New members are exempt from participating in client surveys during their first month. During this period, they can only complete internal profiling surveys that help Pollfish establish their baseline response patterns and verify the consistency of their demographic information. This allows Pollfish to identify potentially problematic respondents before they ever reach client surveys.
- Cross-platform behavior analysis: Because members engage with Pollfish’s communities across various activities, Pollfish can verify consistency in behavior patterns. For example, if someone reports being a pet owner in surveys but their shopping history (as verified by receipt uploads) reveals no pet food, toy, or supply purchases that would typically be associated with pet ownership, Pollfish can flag this discrepancy for review.
✅ Comprehensive fraud prevention at every step
While traditional 3rd-party panels typically apply basic quality checks after surveys are completed, Pollfish employs more sophisticated fraud prevention methods:
- Unique User ID: Each participant receives a unique identifier that tracks their activity across our platform, preventing individuals from taking the same survey multiple times or creating duplicate accounts.
- Device-Carrier Validation: Our system cross-references the respondent’s mobile carrier information with their device data to verify consistency and flag suspicious patterns that might indicate location or identity spoofing.
- Sophisticated Trap Questions: We strategically place specialized validation questions that appear simple to humans but confound automated systems. These include not just image recognition tasks, but attention verification questions that adapt based on previous responses to appear natural within the survey flow.
- Response Timing Analysis: We can detect and flag not just speeders who rush through the entire survey, but also identify suspicious patterns like inconsistent timing (fast on complex questions, slow on simple ones).
- Geolocation Authentication: We employ advanced IP validation technology that blocks responses submitted through VPNs, proxies, and other location-masking services to ensure geographic targeting accuracy.
- Progressive Trust Evaluation: Respondents receive continuously updated quality scores based on their historical response patterns.
3 Key Feature Categories That Influence Research Quality
Now that we’ve established the critical importance of data quality — since even the most sophisticated survey tools offer little value if they’re built on flawed data — let’s look at what our market research survey software can actually do.
As we’ve mentioned earlier, there are 3 essential feature categories that truly effective survey platforms must deliver to meet your precise research requirements:
- Audience targeting: You might need to reach a precisely defined audience segment, yet find yourself limited by insufficient targeting parameters, ultimately forcing you to compromise with a broader respondent pool that only partially aligns with your intended demographic.
- Questionnaire design: When developing your questionnaire, you may envision specific interactive question formats or complex conditional logic paths, only to discover the platform’s survey construction tools lack these advanced features.
- Data analysis: It’s frustrating when the platform’s analytics capabilities offer only surface-level insights, compelling you to download your raw response data and use third-party software (e.g., Excel) just to conduct the deeper analysis necessary for meaningful decision-making.
Up next, we’ll examine how Pollfish addresses each of these critical feature areas.
Define your respondent pool using granular demographic and behavioral filters
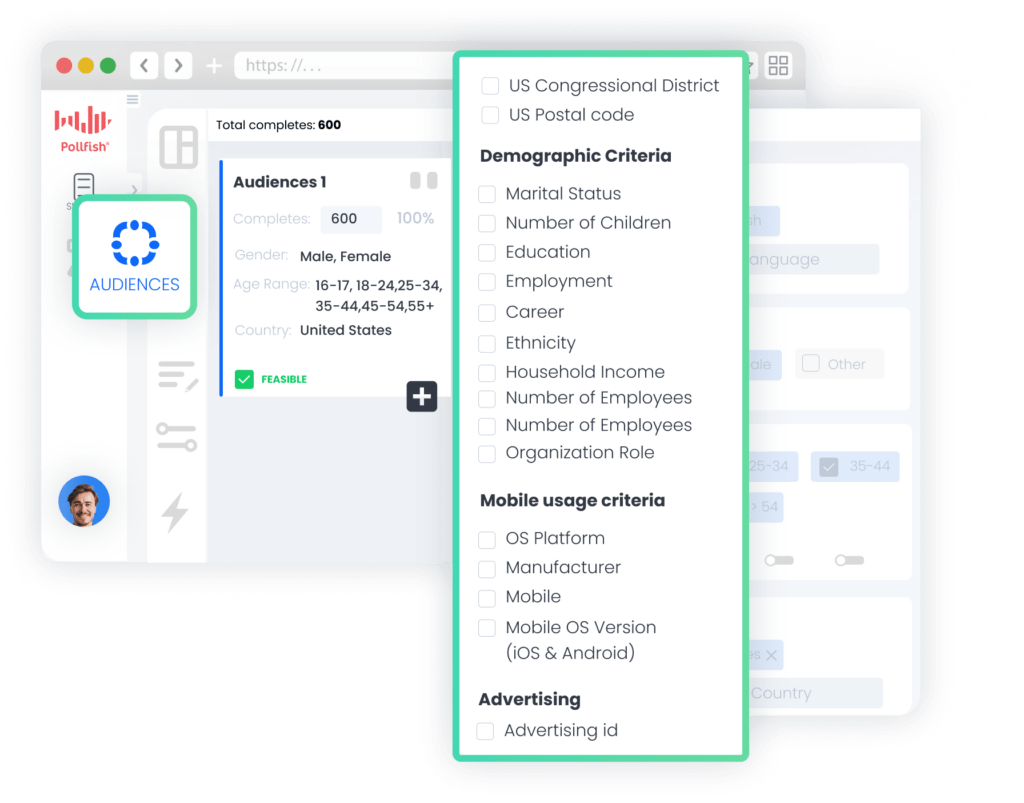
Pollfish offers an extensive range of targeting criteria to precisely define your survey’s audience:
- Targeting criteria options: Choose among 50+ targeting parameters spread across 6 key categories: Demographics, Geographic Criteria, Consumer Lifestyle, Employment & Occupation, Behavioral Data, and Media.
- Example in action: Most companies won’t set all of the parameters below simultaneously, but here’s an example of how detailed your targeting could be:
- Demographics: Men, ages 35-49, $200,000+ income, single, never married
- Geography: Metropolitan areas across the Midwest
- Consumer Lifestyle: Regular energy drink consumers, enthusiasts of extreme sports, fishing, and camping
- Employment: Employed full-time, work in the construction industry
- Purchase Behavior: Recently bought Gatorade and 5-hour energy products
- Set audience quotas: Optionally, you can set audience quotas to ensure a balanced sample and avoid skewed results (e.g., For example, you might set survey audience quotas to ensure 30% of respondents are males aged 18-24, 40% are females aged 25-34 with children, and 30% are adults aged 55+ with household incomes above $75,000 to achieve a representative sample across key demographic segments).
Note: To learn more about Pollfish’s audience targeting capabilities, view this video.
Build questionnaires with diverse question types and advanced survey design features
Craft engaging surveys using a wide variety of question formats and advanced survey design capabilities:
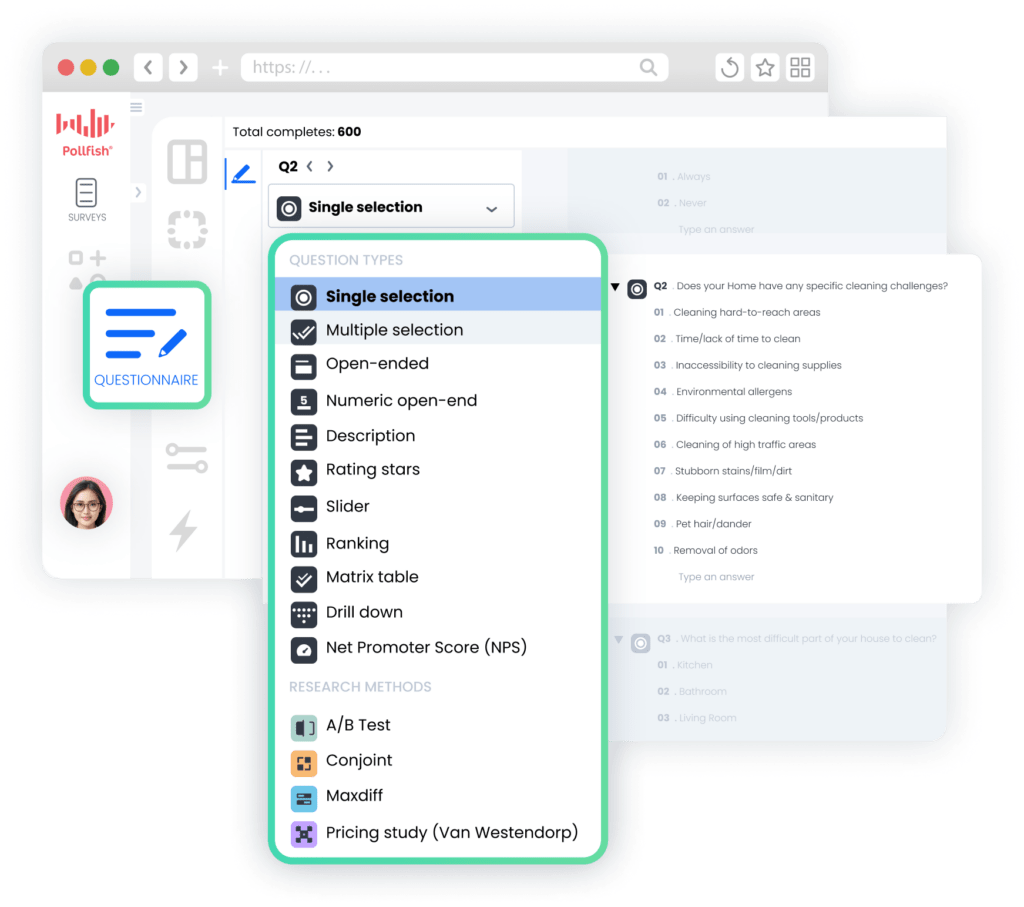
- Choose from 14 question types, including single/multiple selection, open-ended, matrix, rating stars, sliders, and more. (See complete list and explanation for each question type.)
- Specialized question formats like A/B Test, Conjoint Analysis, Max Diff, and ProVan Westendorp for specific research needs.
- Screening questions: Use screening questions to ensure only relevant participants complete your survey. (e.g., Include a screening question like “Do you currently have a pet in your household?” to qualify participants for a pet food market research study).
- Skip logic: Implement skip logic and advanced branching to create personalized paths based on response. (e.g., In a healthcare survey, if a participant selects they take prescription medication, they follow a branching path with questions about medication frequency, whereas those without prescriptions are routed to questions about preventative care).
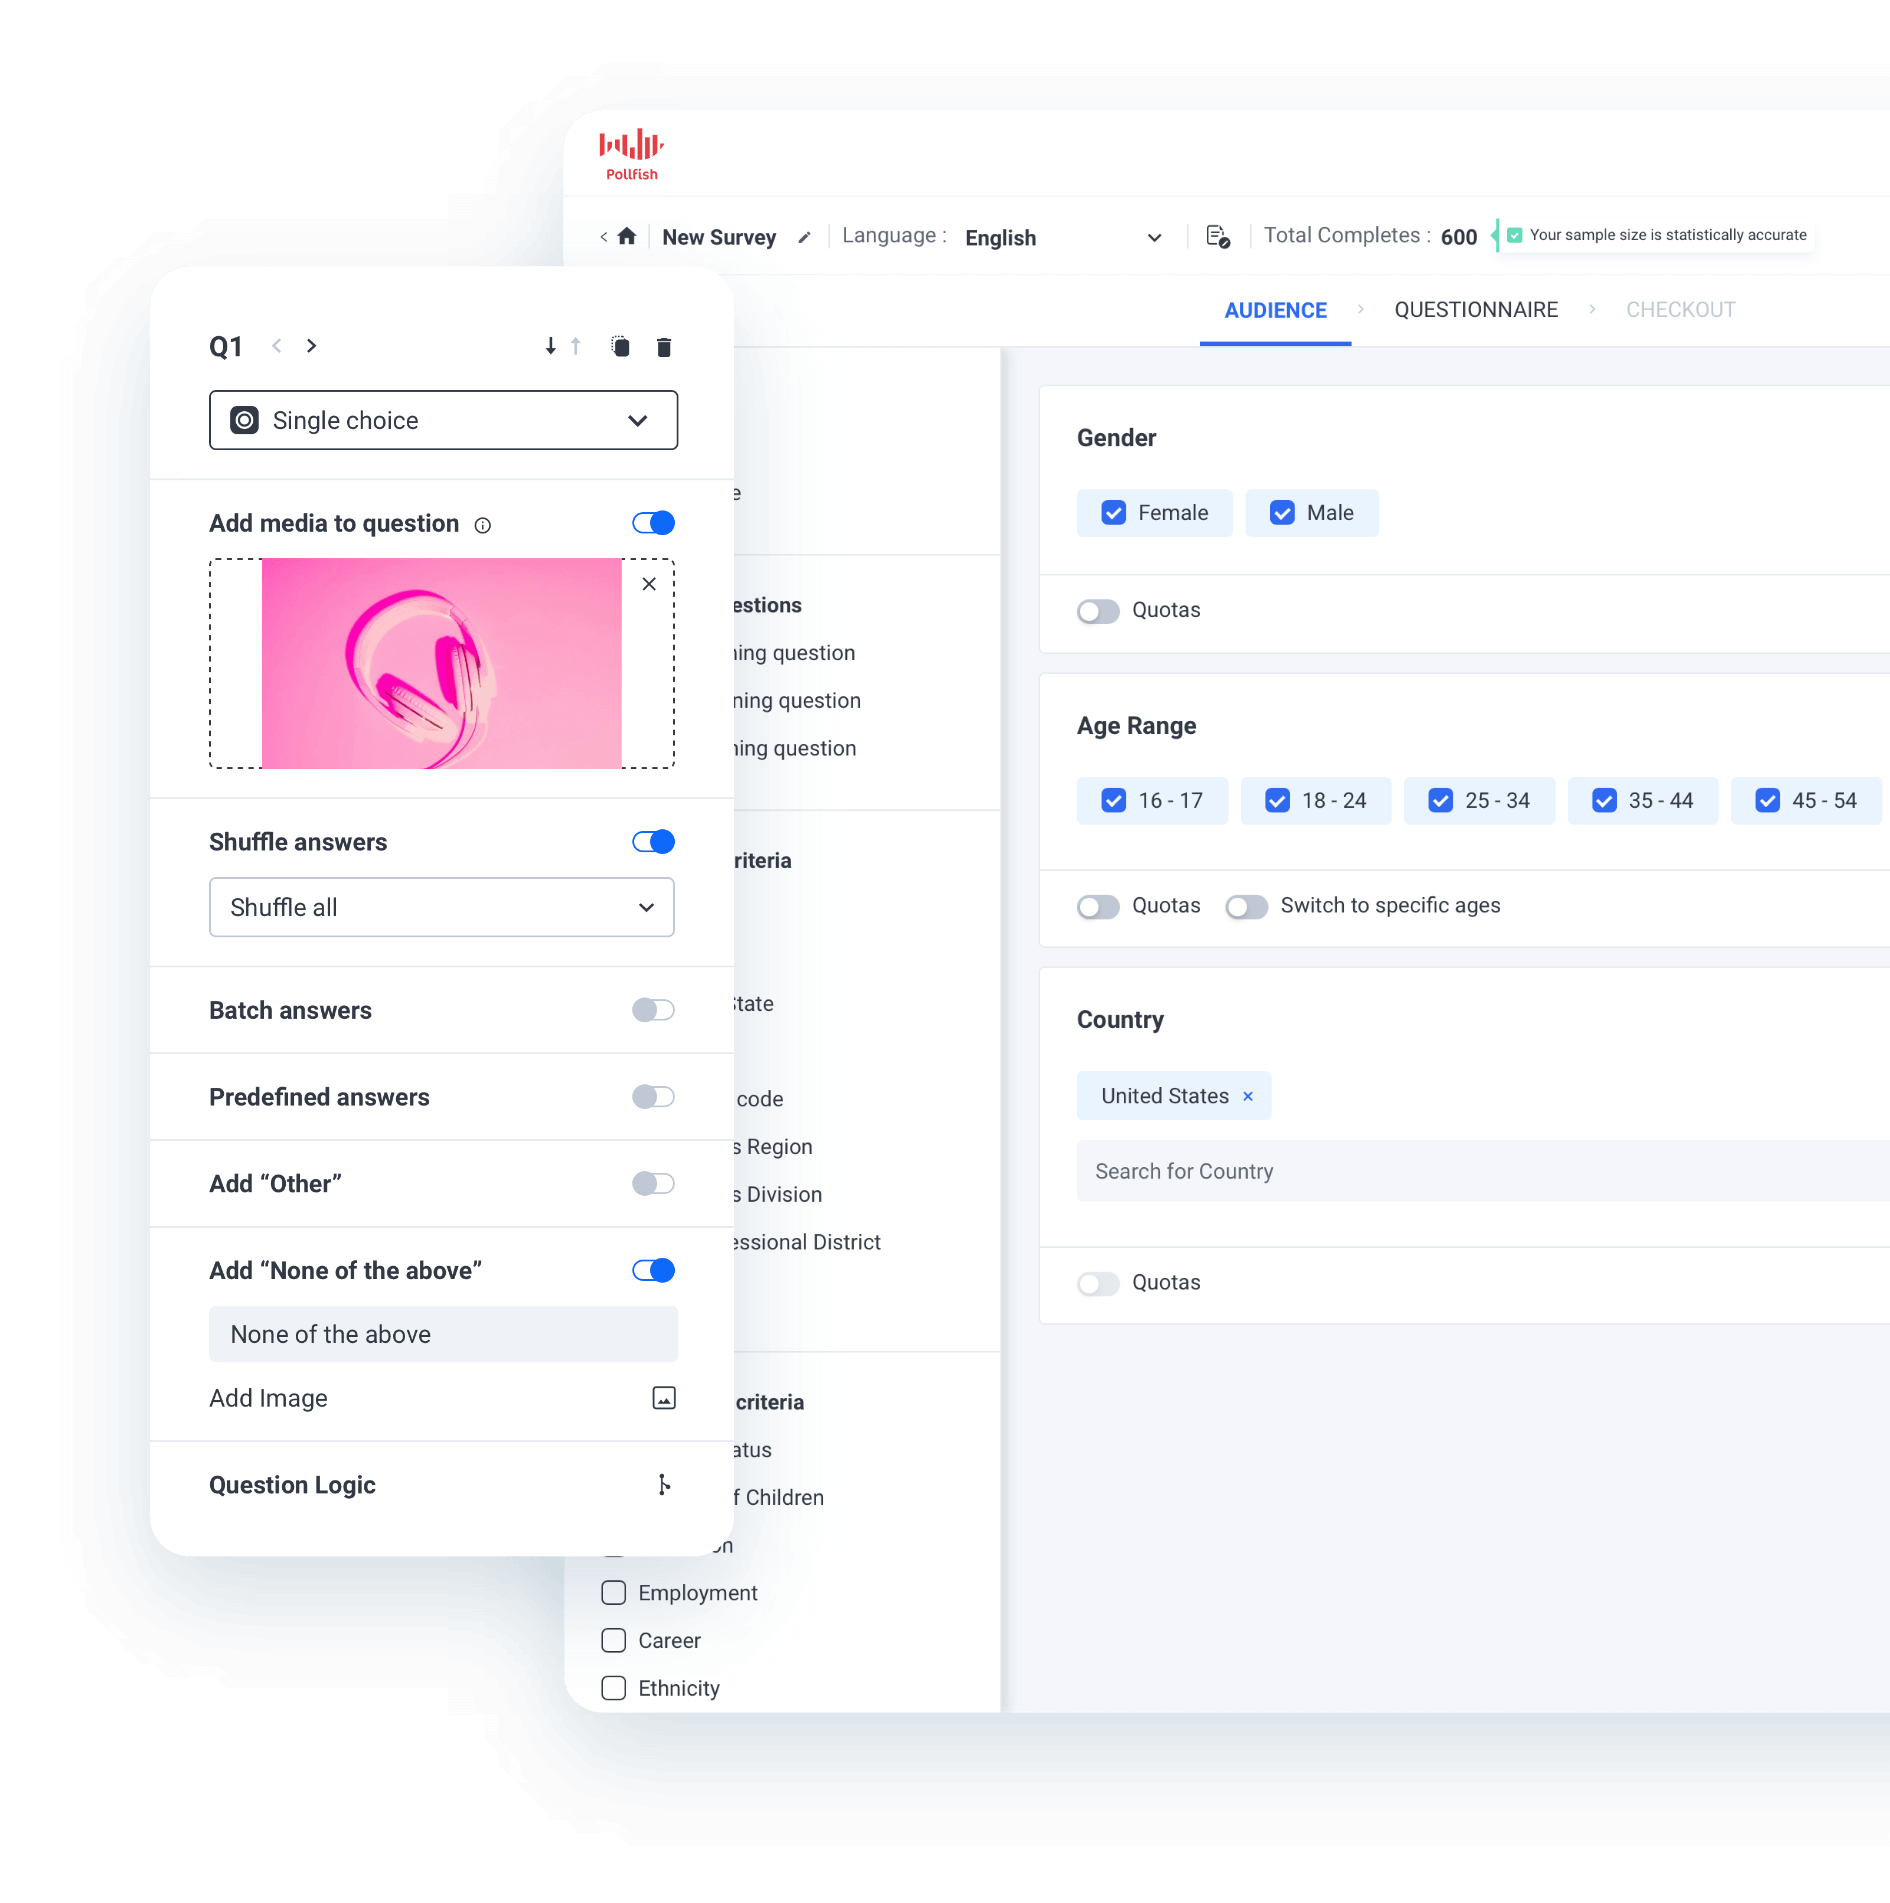
- Answer shuffling: Randomize answer order to reduce bias and improve data quality (e.g., implement answer shuffling for the question “Which factor most influences your purchasing decision?” to prevent primacy bias from skewing results toward options listed first).
- “Other” and “None of the above”: Automatically include “Other” and “None of the above” for all answer choices with a simple toggle, rather than doing it manually for each question (a common frustration for researchers who regularly create surveys).
- Multimedia elements: Incorporate multimedia elements like videos into survey questions, and optionally require video viewing completion before advancing to ensure attentiveness.
- And the list goes on, including popular survey templates for market research, an AI survey builder, and more.
Click here to learn more about designing a questionnaire with Pollfish, and the customization options at your disposal.
Leverage built-in reporting capabilities for easy data visualization and analysis
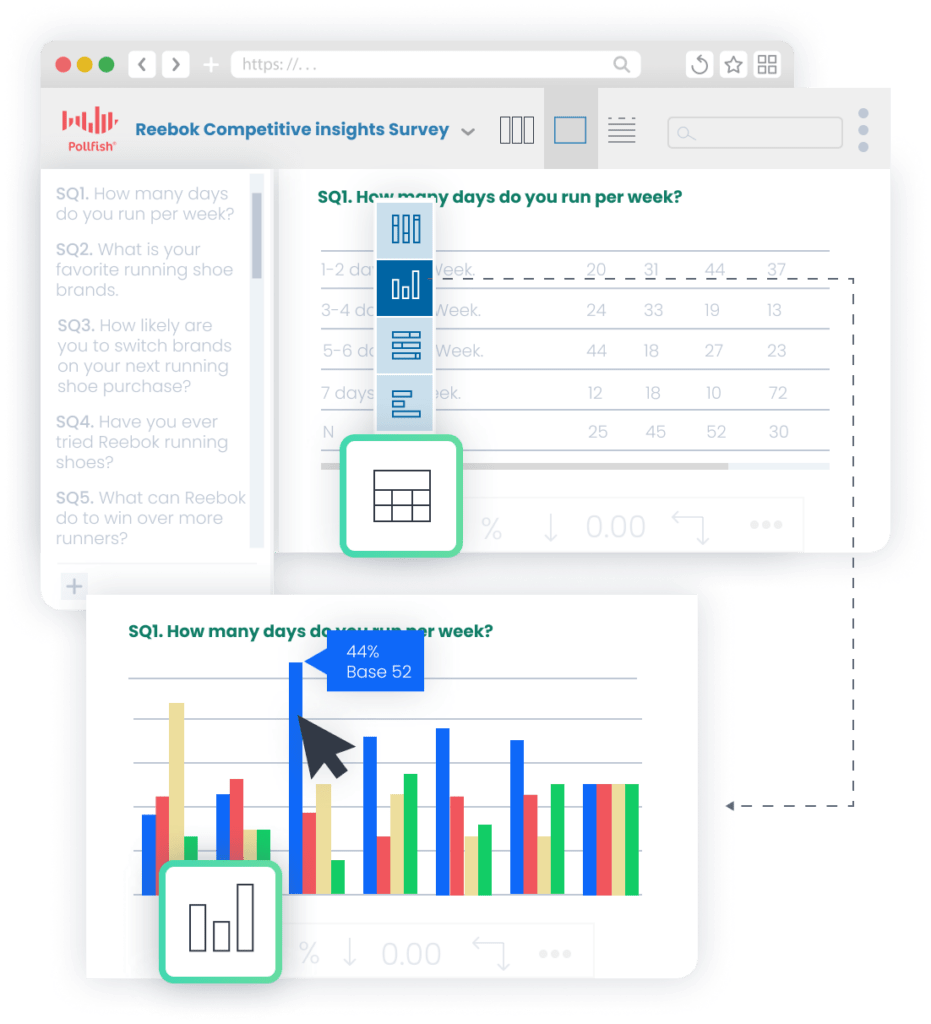
Pollfish’s user-friendly reporting tools allow you to easily uncover meaningful insights from your survey data, all within our platform, without having to use Excel.
- Intuitive data visualization: Visualize every single survey answer using tables, color-coded charts, and graphs that automatically update based on filters.
- Customizable Styling: Customize graph colors and styling to align with your brand guidelines. For instance, if your company uses a specific blue (#0057B8) and orange (#FF6B00) color scheme in all marketing materials, you can easily apply these exact brand colors to your survey result visualizations.
- Flexible Data Exporting: Export results in various formats (PDF, Excel, Crosstabs, SPSS) for further analysis and presentation.
- Drill down by key audience segments:Apply audience targeting filters to analyze survey results by specific audience segments such as age, gender, location, and more.
- Example use case: Using the demographic filters on the left side of the dashboard, you could select just “Millennials (25-40)” to see their specific feedback. The results would instantly update to show only responses from this age group, revealing that millennials were twice as likely to say your proposed pricing was “very reasonable” compared to the overall sample. You could then further refine this by adding gender filters to compare male vs. female millennials’ price sensitivity, discovering that female millennials were particularly enthusiastic about your pricing proposition.
- Drill down by specific responses: Utilize response-based filtering to drill down into data by individual question answers.
- Example use case: When reviewing your customer satisfaction survey results in Pollfish, you could use response-based filtering to focus on only the respondents who selected “Very Dissatisfied” to your overall satisfaction question. This would allow you to examine what these dissatisfied customers specifically disliked by seeing their responses to other questions, such as product quality, customer service interactions, or pricing concerns. You could discover that 78% of dissatisfied customers cited “slow response times” as their primary frustration, giving you a clear priority for improvement efforts.
- Advanced analysis without Excel: Our Advanced Insights Builder (available on Elite plan) enables complex data manipulation using multiple variables without needing Excel.
- Example use case: You could instantly analyze 4 variables simultaneously by creating a visualization showing how purchase intent (variable 1) for your product varies across different age groups (variable 2), income levels (variable 3), and geographic regions (variable 4). This might reveal that high-income millennials in urban areas show 87% purchase intent compared to just 43% among similar demographics in rural regions — a complex, multi-dimensional insight that would typically require extensive Excel manipulation but is available with just a few clicks on our platform.
- Built-in stat testing: Stat testing results can be clearly visualized using color-coding and traditional notation (capital and lowercase letters).
- Example use case: If you compared customer satisfaction scores across different age groups, our platform would automatically highlight statistically significant differences – showing that Gen Z customers (highlighted in dark green with capital “A” notation) rate your mobile app experience significantly higher than Baby Boomers (marked with lowercase “b”).
Note: This is just a glimpse of what’s possible. If you have particular reporting requirements and want to confirm that Pollfish can meet them, please contact us here.
Transparent Pay-per-Response Pricing Model (Rather Than Being Locked Into a Subscription)
Up next, we’ll examine how our usage-based pricing structure delivers exceptional value compared to alternatives.
The Downsides of Subscription-Based Pricing
- Many competitors offer inflexible subscription models that require you to commit to monthly or annual fees, regardless of your actual usage. This means that during slower periods or months when no research is conducted, you still pay the full subscription rate — essentially wasting money on unused capacity.
- Additionally, tiered pricing structures can be misleading. While some tools may advertise an attractive base rate, essential features often remain locked until you upgrade, leading to unexpected costs for targeting specific demographics, accessing comprehensive reporting tools, and more.
- Furthermore, as your team grows, paying for each additional user can significantly increase your total costs. This also creates budget unpredictability, especially when scaling teams for short-term projects or seasonal demands.
Pollfish’s Approach: Transparent, Usage-Based Pricing
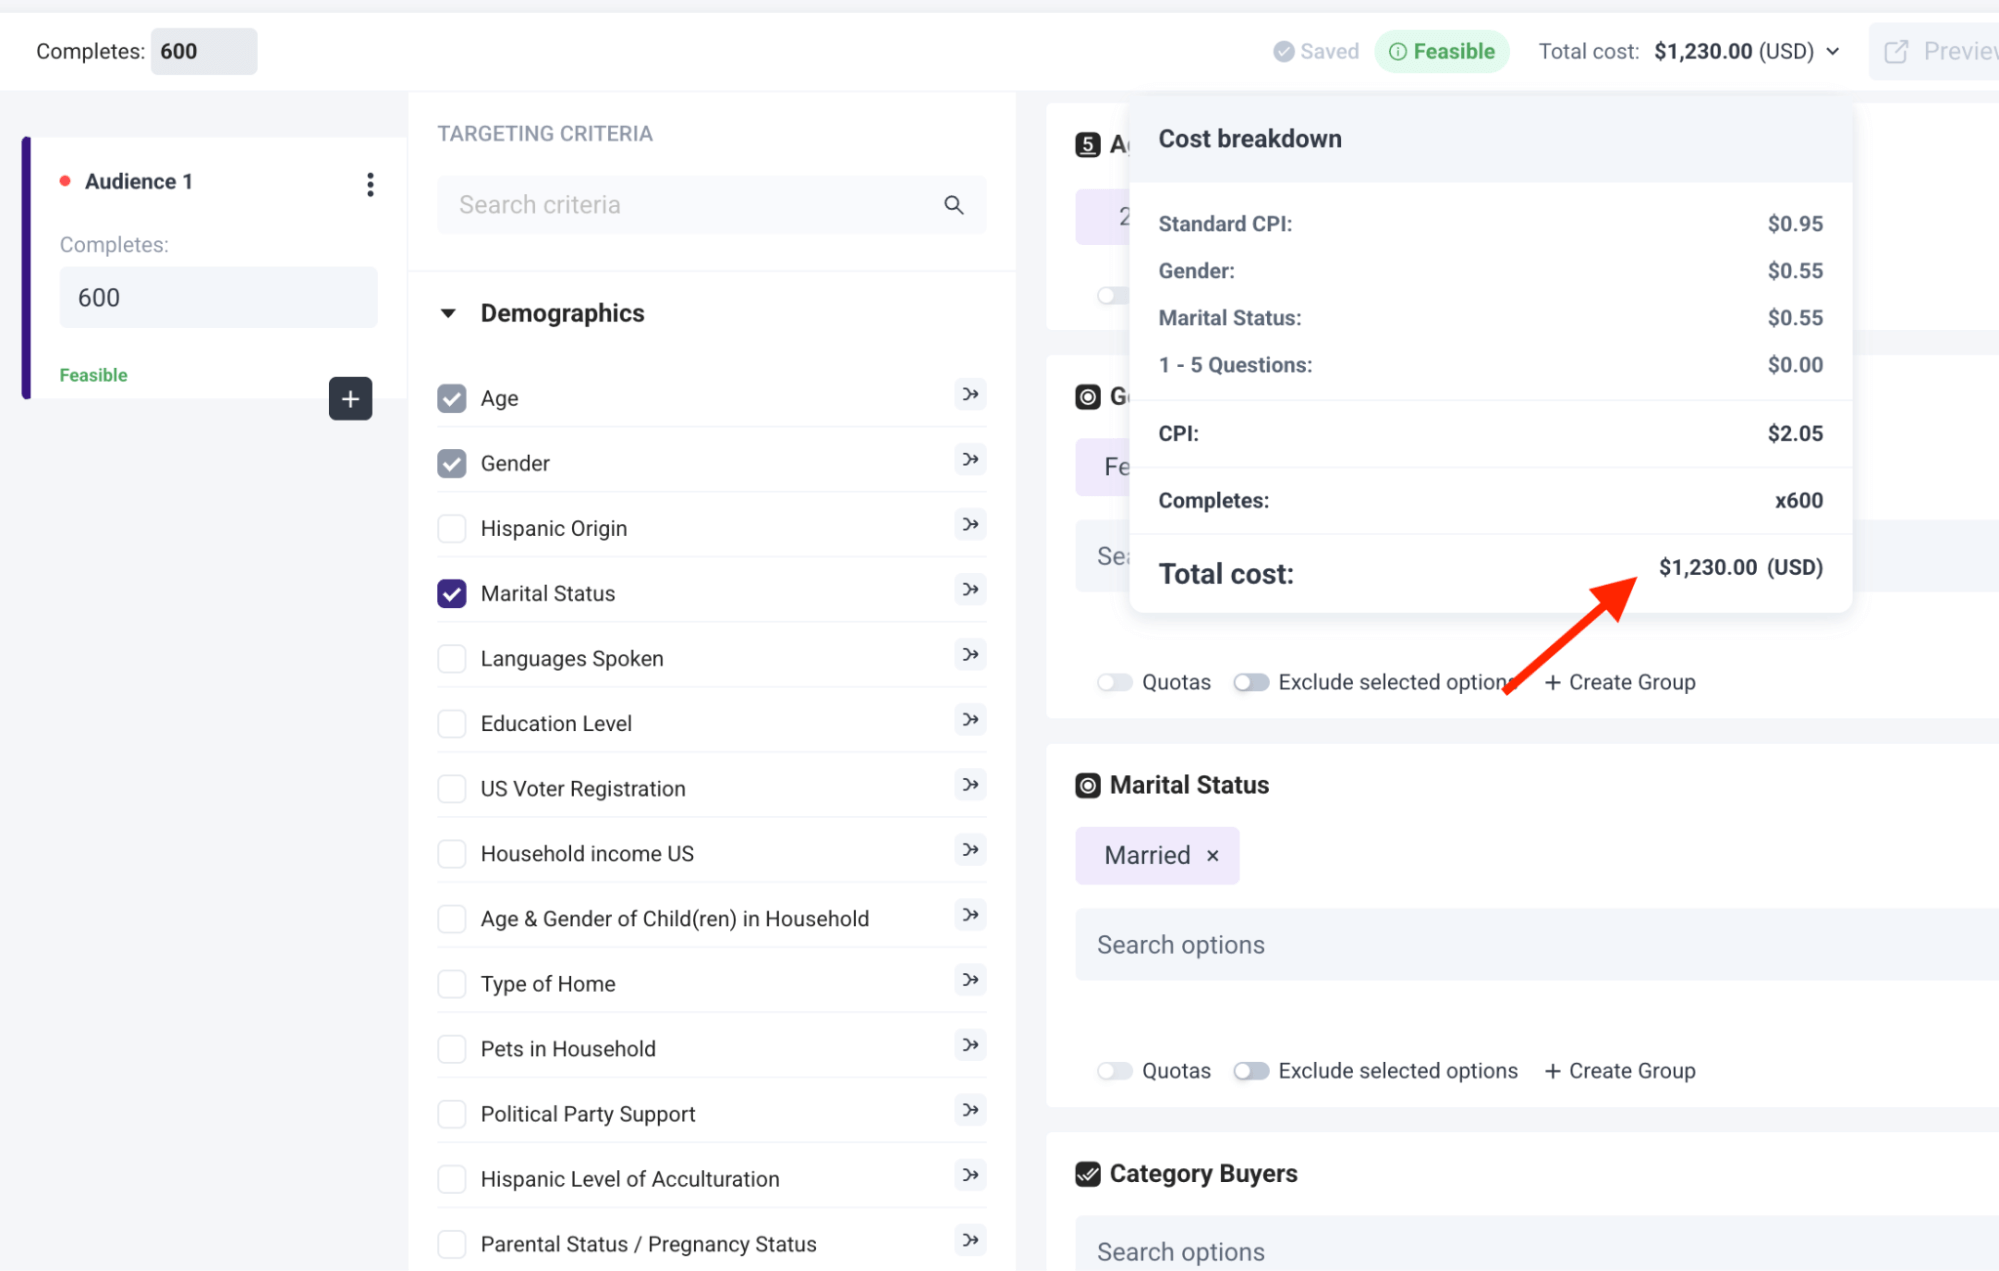
- You only pay for the survey responses you collect, starting at $0.95 per response. Our straightforward cost structure scales with your actual usage, and we can apply significant volume discounts for larger research initiatives.
- You see your total cost calculated in real-time through our dynamic pricing display. As you build your survey specifications, the platform immediately shows both the per-response rate and your total complete project cost before you commit, eliminating budget surprises.
- You can add unlimited team members at no additional cost. If you’re on the market research team, you can include everyone from your immediate department, plus collaborate seamlessly with stakeholders from marketing, product development, customer experience, and executive leadership without worrying about per-user fees.
Register for a Free Pollfish Account
Ready to experience Pollfish firsthand? We invite you to register for a free account (no credit card needed, no obligations) and book a demo walkthrough.
2. Qualtrics
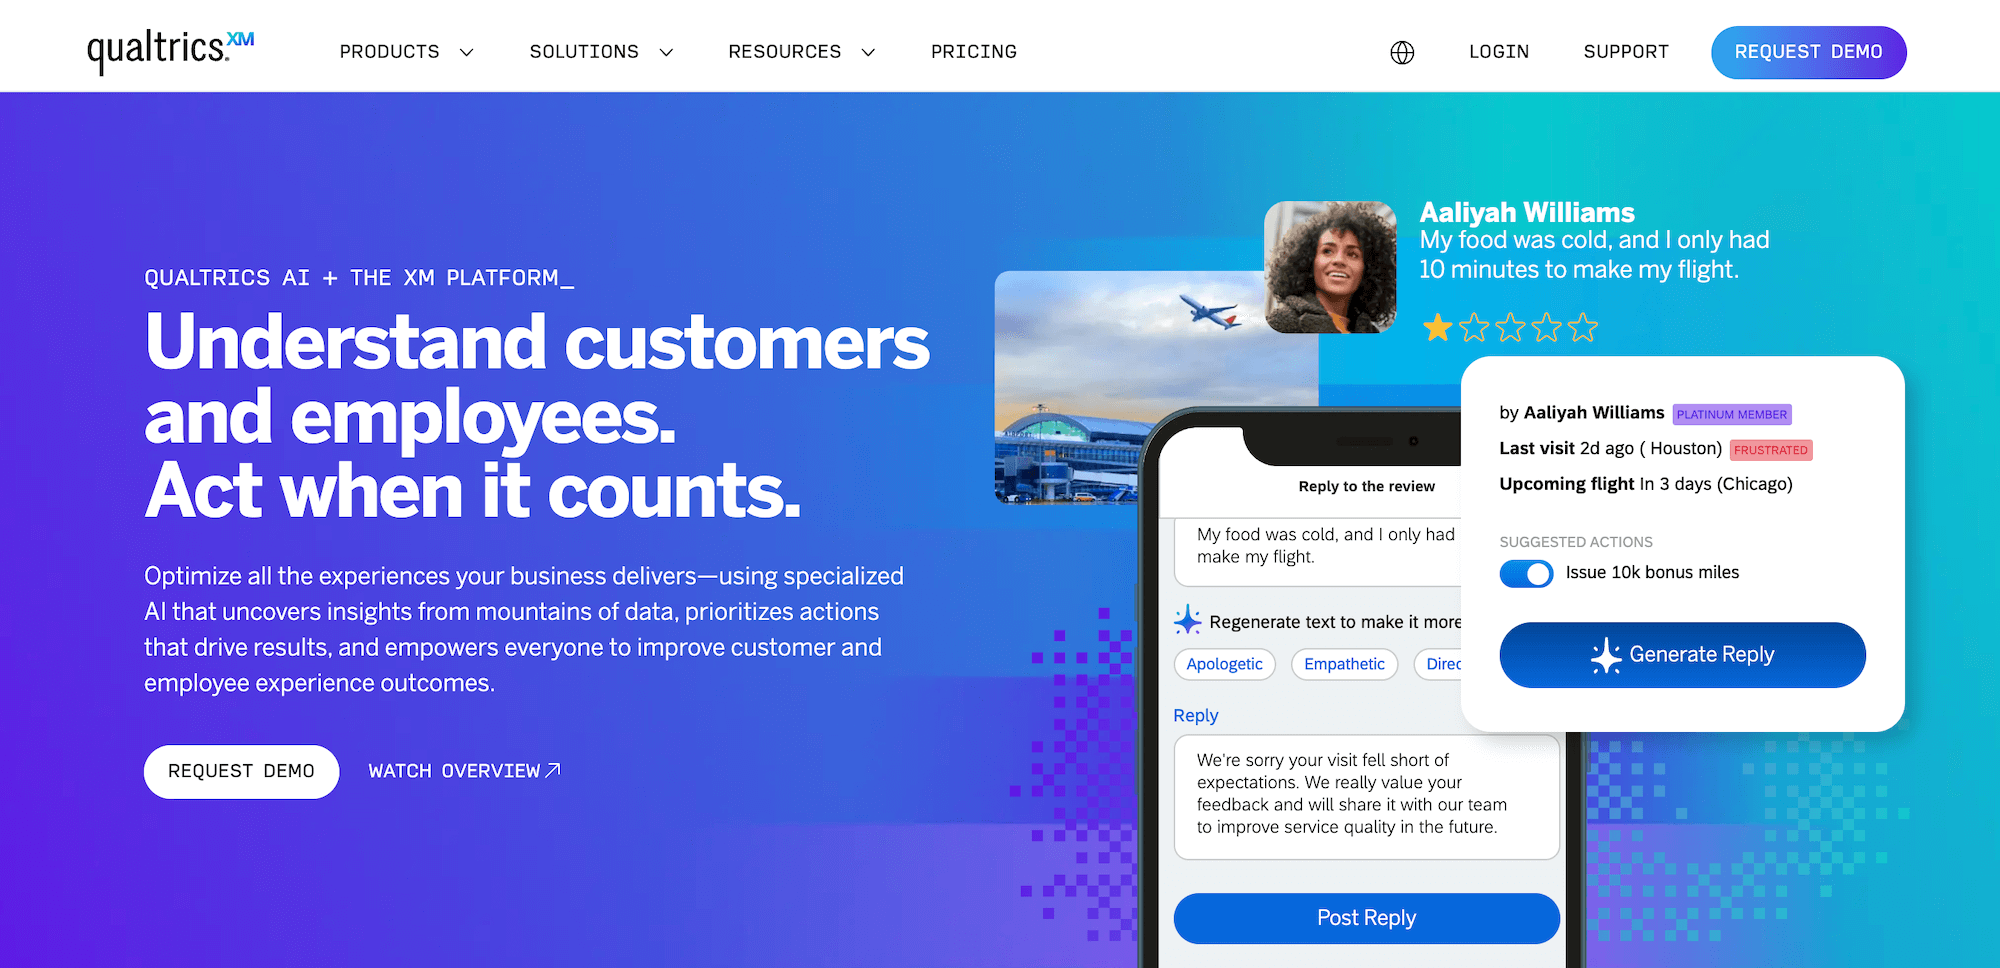
Qualtrics is a survey software for market research that can help you:
- Create customizable surveys with advanced question types and logic.
- Combine quantitative and qualitative research methods including video feedback and interviews.
- Optionally distribute surveys through multiple channels including email, SMS, QR codes, website embeds, and more.
- Store and search all research insights using AI-powered search capabilities.
- Visualize insights through real-time analytics dashboards.
For more information on what differentiates Pollfish from Qualtrics and other competitors, visit this article.
3. Suzy
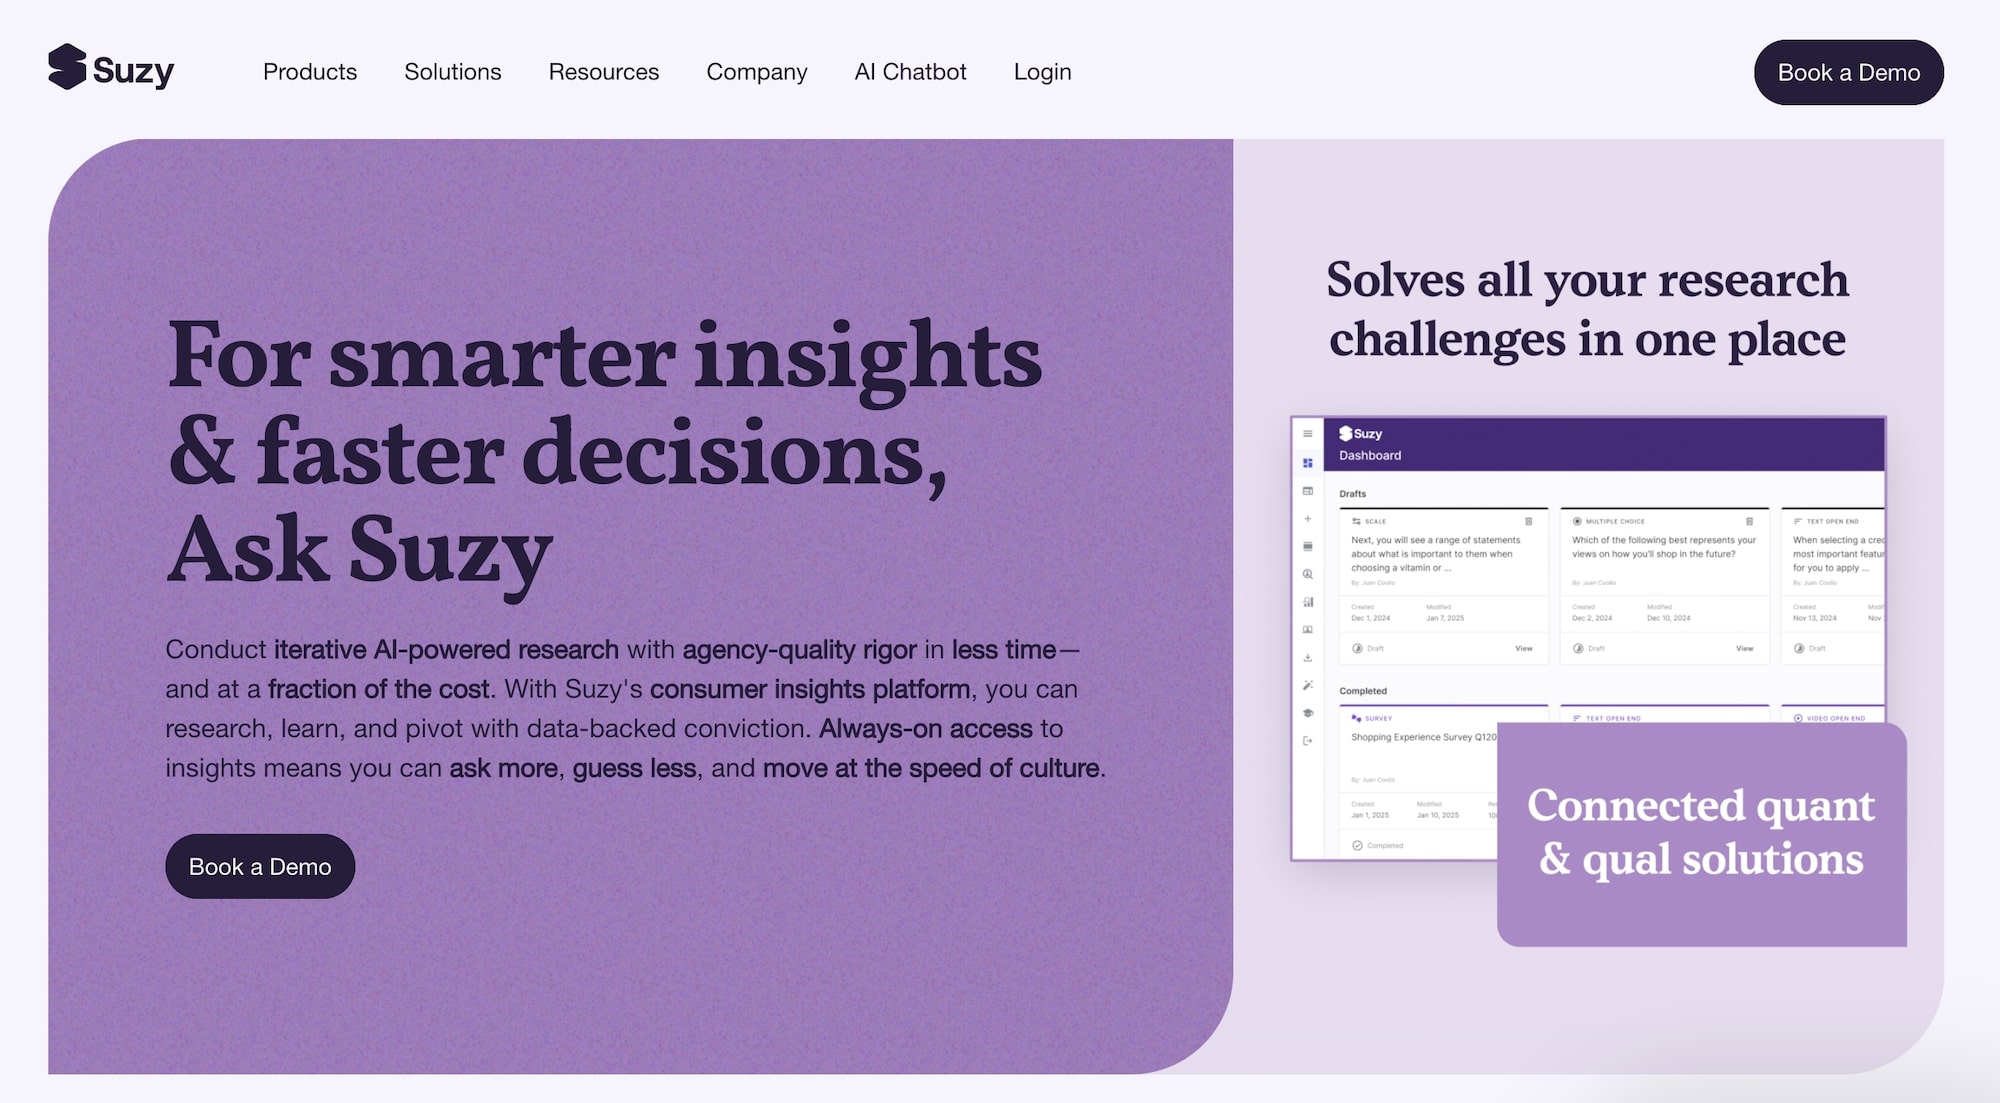
Suzy is a survey tool for market research that with several features and capabilities, some of which include:
- Custom surveys with both basic and advanced question types.
- Logic branching for personalized respondent experiences.
- Video-based qualitative research capabilities through Suzy Live.
- Retargeting of certain respondent groups for follow-up studies.
- AI-moderated conversations for conversational surveys at scale.
To learn more about what differentiates Pollfish from Suzy, visit our article on the best Suzy alternatives.
4. SurveyMonkey
SurveyMonkey is a survey platform for market research with several features and capabilities, some of which include:
- AI-powered SurveyMonkey Genius to guide survey creation and analysis.
- Extensive library of expert-built templates and pre-written questions.
- Sentiment analysis to categorize open-ended responses automatically.
- Offline response collection through the SurveyMonkey Anywhere app.
- Integration with a plethora of apps including Marketo, HubSpot, Tableau, PowerBI, etc.
5. Alchemer
Alchemer can be used as a market research survey software. It offers several features and capabilities, some of which include:
- Custom survey experiences with branded URLs and domains
- A plethora of question types and advanced logic capabilities
- Built-in automation actions including email triggers based on respondent behavior
- Report creation tailored to different stakeholders
6. SurveySparrow
SurveySparrow can be used as a market research survey platform. It offers several features and capabilities, some of which include:
- Conversational surveys that feel engaging to respondents
- Various question types including opinion scales, rank order, matrix, and more
- Complete survey customization with themes and styling of buttons, text, fonts, and colors
- Filtering and data comparison tools for analysis
- Multi-channel distribution through email, SMS, QR codes, web links, and social media
- Offline survey app for data collection without internet connectivity
7. Forsta
Forsta can be used as a market research survey tool. It has several features and capabilities, some of which include:
- Supports video open-ends to capture qualitative insights alongside quantitative data
- Offers easy translation capabilities for multilingual surveys
- Allows for customizable branding and design of surveys
- Enables multimedia embedding within surveys for enhanced engagement
- Includes robust reporting and data export options
Budget-Friendly Entry-Level Options
8. Google Forms
Google Forms is a free tool that can be used as an online survey software for market research. It has several features and capabilities, some of which include:
- Various question types including multiple choice, checkboxes, short answer, and more
- Supports image and video embedding within surveys
- Enables conditional logic for creating branching and skip patterns
- Enables easy distribution via email, links, embedding, etc.
- Allows for real-time response monitoring as data comes in<
- Provides basic data visualization with automatic charts and graphs
- Features full integration with Google Workspace (Google Sheets, Dogs, Slides)
9. Typeform
Typeform can be used as a software to run market research. It has several features and capabilities, some of which include:
- Various question types including multiple choice, opinion scales, matrix questions, etc.
- Conditional logic to show questions based on previous answers
- Video embedding for more engaging survey experiences
- Optional URL redirects based on responses
- Customization of fonts, colors, and branding elements
- Optional hidden fields to track where respondents are coming from
- Data export options for further analysis
- Multi-language capabilities for global research
10. SurveyPlanet
SurveyPlanet is a market research tool that can help you run surveys. It offers several features and capabilities, some of which include:
- Various question types and branching or skip logic based on previous answers
- Pre-written survey templates and questions for quick start
- Insights on which survey sections cause participants to abandon
- Survey length estimator to help reduce abandonment rates
- Optional email and text notifications for new survey responses
11. Microsoft Forms
Microsoft Forms can help you run surveys for market research. It offers several features and capabilities, some of which include:
- Various question types including multiple choice, text, rating, and ranking
- Ability to import questions from Excel files
- Branching logic to direct respondents to specific questions based on previous answers
- Automatic insights for data analysis including word clouds for text responses