New Pollfish Feature: Sequential Testing, A Variation of Monadic Testing
The Pollfish A/B testing functionality just keeps getting stronger; we now offer another version of it to fortify all your concept testing needs with the Sequential Testing version. In this second version of A/B testing, researchers can test multiple concepts at once, as opposed to just one with monadic.
In this second iteration, the testing is also done within one group of questions but allows researchers to test more concepts per respondent. This grants researchers added flexibility and efficiency, as only one survey can test multiple concepts.
This version is available for all accounts on the Pollfish platform.
This article explains sequential testing, how to use it in the Pollfish platform and the three versions Pollfish offers.
Understanding Sequential Testing
Sequential testing affects the cost of the survey by way of the following calculation:
The calculation cost formula:
(the # of questions included in the A/B test) X (# of concepts presented to the respondent)
Example:
Questions in the A/B test: 12
Number of concepts presented: 4
12 X 4 = 48
As such, in a basic plan, the CPI will be for $4 (46-50 questions) )
Question Distribution
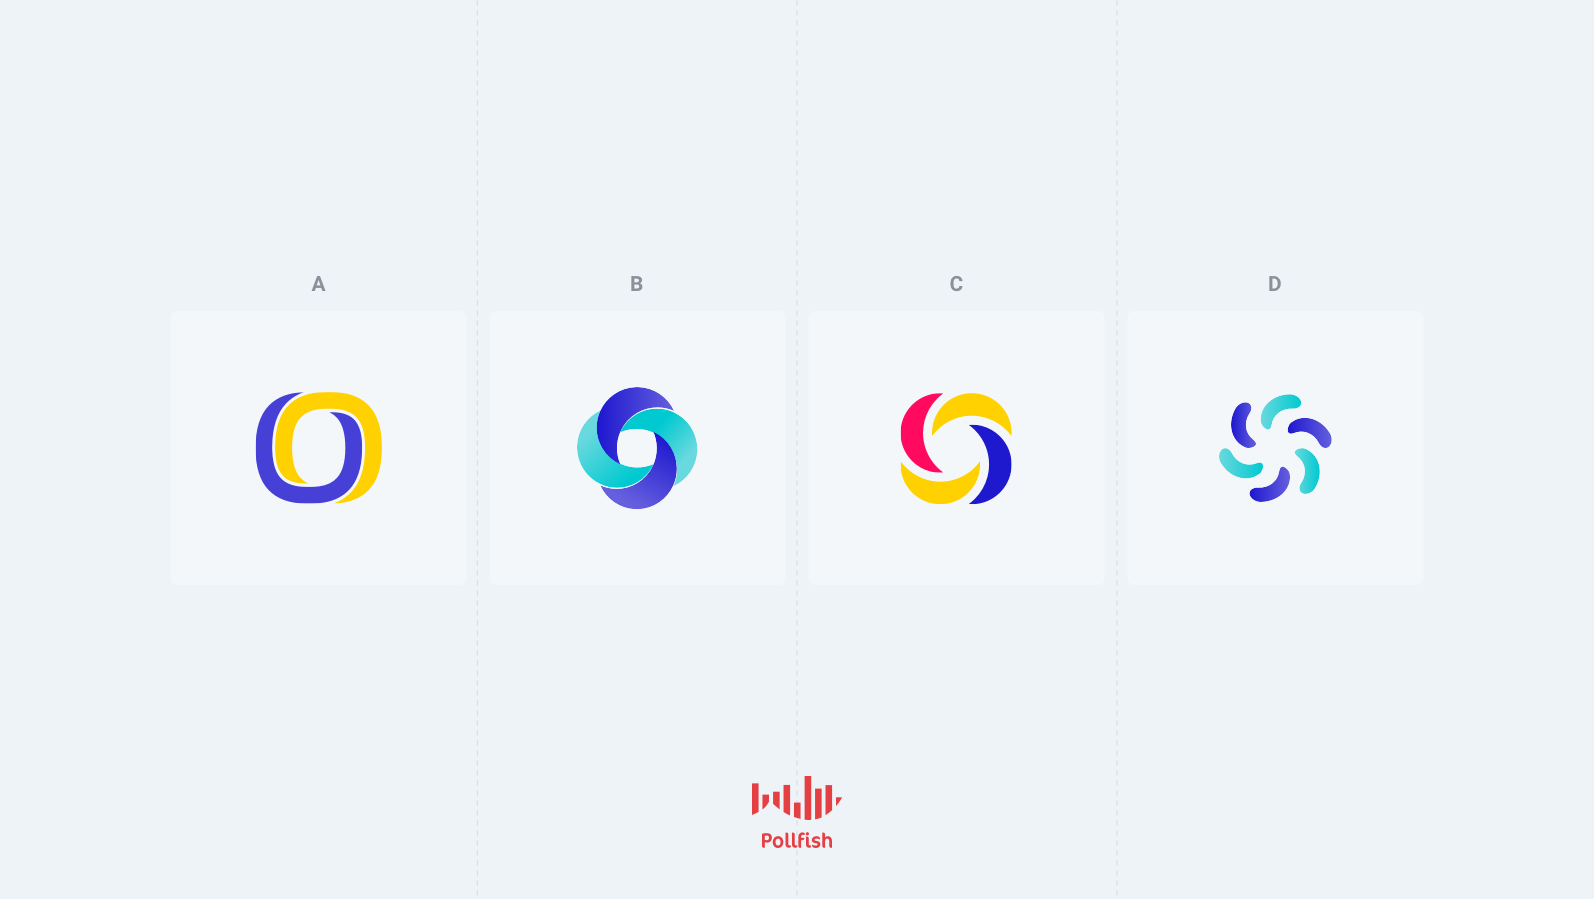
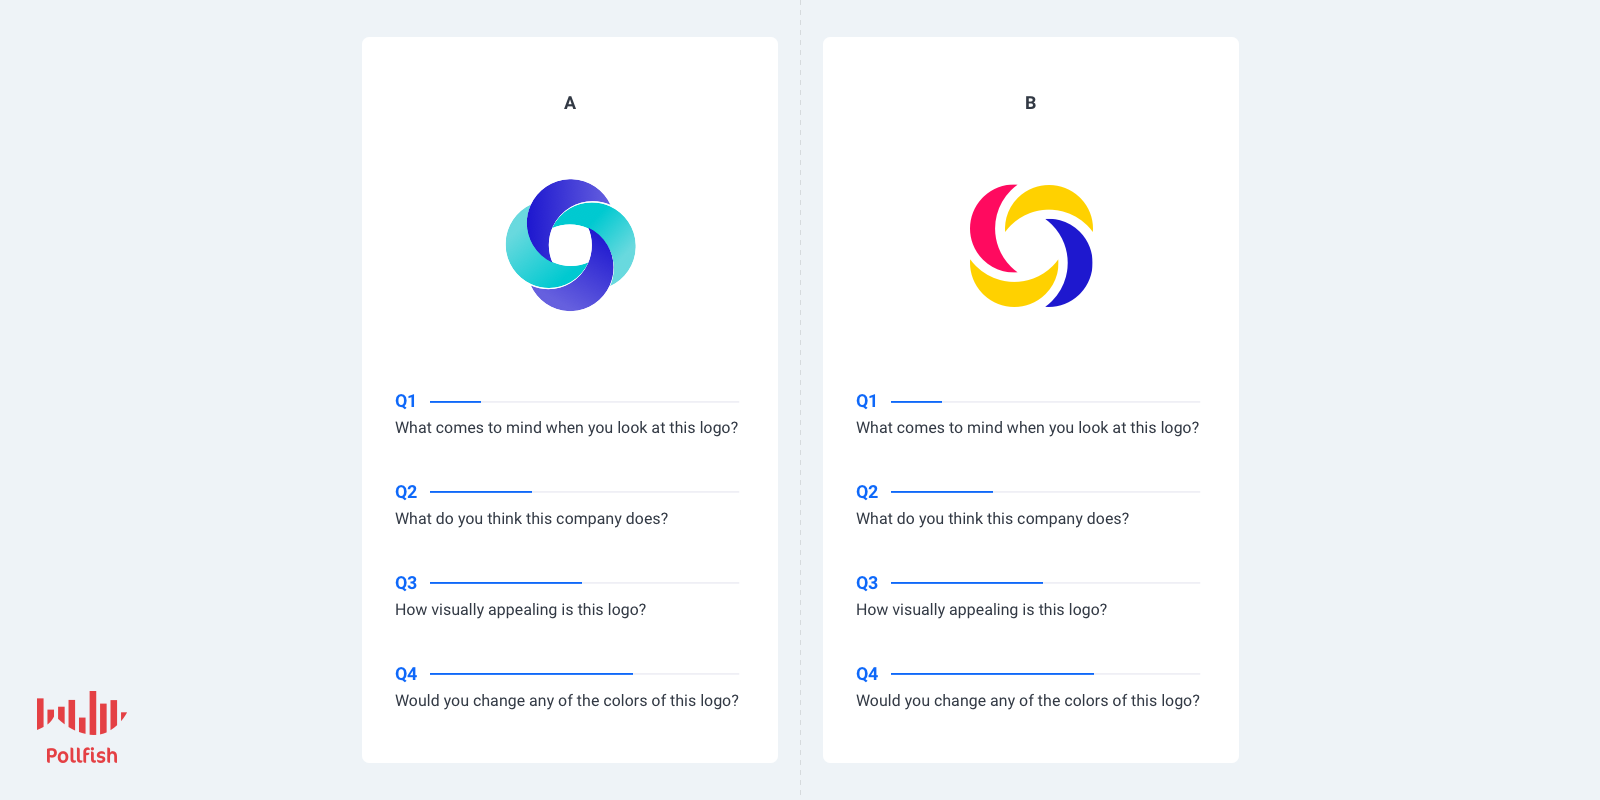
In this version of the A/B test, concepts have a specific distribution: all possible combinations are derived from the concepts that are selected to be shown. This way, each concept is evenly distributed and presented to the respondents at equal times in the first position.
This reduces any bias that may occur from serving a concept always at the first position of a combination.
Example:
Sequential x 2 selected concepts per respondent out of 3 concepts (A, B,C)
A sampling pool of 300 respondents
We have the following combinations of 2 out of the 3 concepts:
AB, BC, AC
This means that each concept will be seen by more participants than it would in the monadic version. For the example of 300 respondents, each concept will be seen by 200 respondents or a total of 600 views for all concepts.
The distribution should take place evenly for all combinations (300 respondents / 3 combinations = 100 responses/combination)
AB or BA x 100
BC or CB x 100
AC or CA x 100
Results and Exports
The results and exports will be presented as they are in the monadic testing version. However, the difference lies in that each concept will have accrued more views and responses than it would have in the monadic version.
This is understandable, given that sequential testing involves implementing more concepts, therefore yielding more responses and combinations.
What You’ll Find in the Charts of Sequential Testing
Each question type included in a sequential test (and a monadic test) will be accompanied by a chart.
A bar chart contains columns as concepts or answers, depending on the view you select. The data from the table is used for the charts.
On the top right-hand corner of the questions you applied sequential testing to, you can check results in two ways. Just click on the “View” dropdown and choose between by concept and by results, where applicable.
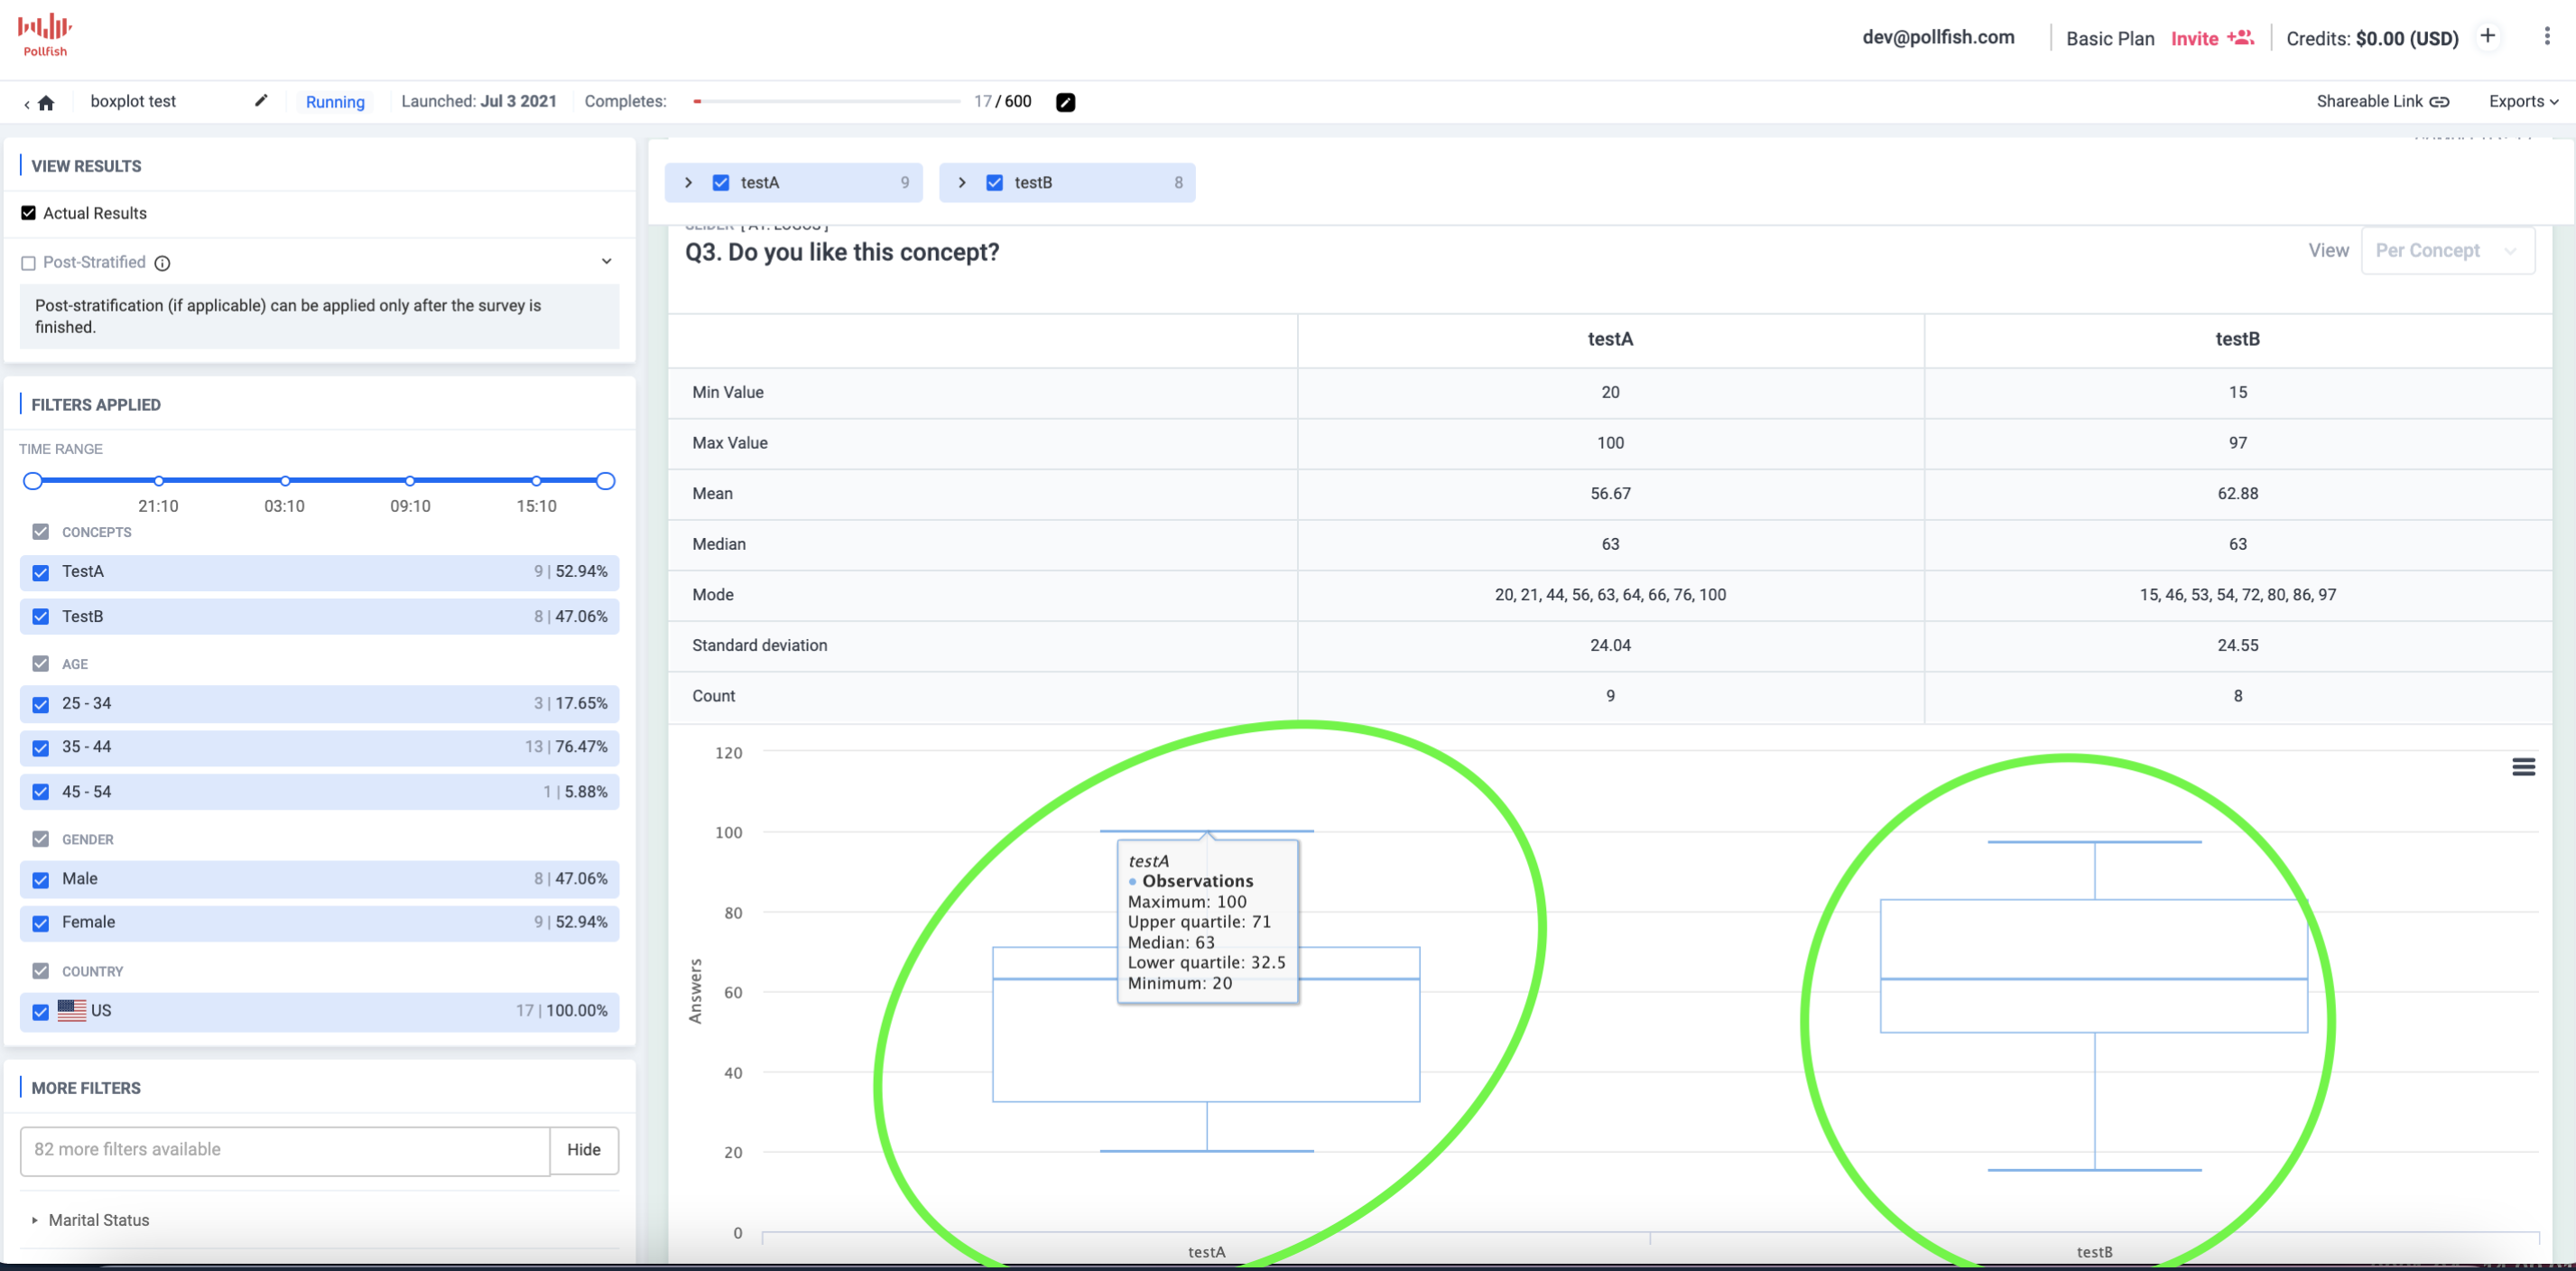
Slider and numeric open-ended questions are presented with a box plot diagram, per concept.
A boxplot is a standardized way of displaying the distribution of data based on a five-number summary (“minimum”, first quartile (Q1), median, third quartile (Q3), and “maximum”). It tells you about your outliers and what their values are.
It can also tell you if your data is symmetrical, how tightly your data is grouped, and if and how your data is skewed.
Box plots are presented on the results page, as this image shows:
The Benefits of a Sequential Test
The main benefit of a sequential testing approach is the improved efficiency of the test. This is because, in sequential testing, each respondent views either all potential concepts or a limited number of concepts, followed by the same evaluation questions for each.
Viewing more concepts and answering for more concepts in just one survey, is far more efficient than testing individually in a non-A/B test setting.
With both monadic and sequential A/B testing, researchers can incorporate many concepts. The key difference is the mechanism that distributes these concepts. In the monadic version, each respondent views and answers for only one random concept whereas in the sequential, they view more and answer for more concepts.
As such, the sequential version grants researchers an added layer of flexibility in their concept setup.
The sequential approach is data-rich, as the Pollfish platform allows researchers to filter their data in regards to each concept, both by concept and answers. This provides a much more granular display of exactly how each concept was received. Best of all, it is provided in one place, on one page.
How to Set Up a Sequential Test
Setting up a sequential A/B test is a fairly simple task. Here are the steps to set up and use the sequential version:
- For the questionnaire, add an A/B test.
- Under “type,” select the sequential type.


- In the concepts table, add as many concepts as you need.
- You can also add attributes.
- In the number of concepts to be presented per respondent, select how many of them each respondent will view.
- (The number of concepts to be presented to the user cannot be bigger than the number of concepts in the concepts table).

- (The number of concepts to be presented to the user cannot be bigger than the number of concepts in the concepts table).
- Define the questions that will be in the test.
- Proceed to the checkout.
Innovating with Sequential Testing
This version of A/B testing is not just ideal for testing ideas, but for breeding innovation, all from one survey. This is because researchers can use sequential testing questions along with regular questions in one survey.
This allows researchers to test their concepts with each respondent, as this is a version of the monadic test.
So go ahead, use all the concepts in one test as you please, for all your market research campaign needs. Or, stick to just a few.