How to Analyze Survey Data Like a Pro

Survey data analysis may feel like a daunting task if you have not conducted many surveys, but the process is easier than you might think. The first few attempts at analyzing your data may feel clunky and cumbersome, but in time you will become adept at viewing and processing survey data.
Whether it is your first or 20th time conducting a survey, knowing how to analyze survey data is crucial to extracting maximum value from your survey results. This guide will walk you through four of the most common types of surveys and provide you with an approach for analyzing data for each type.
Analyzing Survey Data – An Overview
Survey data analysis refers to the process of organizing and examining survey data so you can draw conclusions. The process can be short or long, rudimentary or precise – it all depends on the purpose of the survey, type of data analyzed, consequences of the results, and the skill of the person analyzing the data.
Survey data analysis follows this general process:
- Review the purpose of your survey and the most important questions. Before diving into the data, make sure your analysis stays focused on the survey’s purpose and answers your top questions.
- Review, filter, and cross-tabulate. Sift through the results and think about the best way to organize the data to draw conclusions. Export your data in crosstabs to gain deeper insights.
- Interrogate the data. In this step, you are looking for irregularities that may skew your interpretation of the data. You should consider the statistical significance of your results and identify any areas where sampling bias may lead to inaccurate interpretation.
- Draw conclusions. Once you have gained a deeper understanding of the data, you can draw conclusions and utilize your findings to improve your business.
We have provided just a brief overview of how data analysis is performed before we jump into the specifics on data analysis for various survey types. If you want to learn more, we encourage you to read about how survey data analysis can help grow your business.
Customer Satisfaction Survey
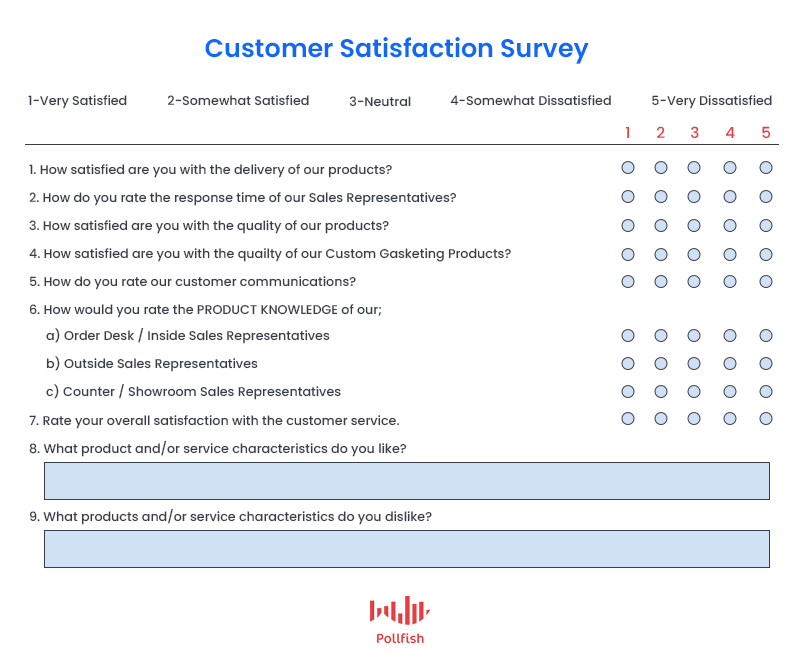
Customer satisfaction surveys provide invaluable insight into your business and help you identify changes to improve the customer experience. When it comes to analyzing the data from a customer satisfaction survey, be prepared to carefully examine both quantitative and qualitative responses.
- After segmenting and organizing your data into appropriate reports, such as crosstabs, the quantitative data from your survey will provide a rich view into the types of customers who were satisfied (or dissatisfied) with their experience.
- Once you have a broad view of the types of customers who either enjoyed or struggled through their experience with your company, qualitative data can give you clues into how to improve the experience to improve satisfaction levels.
- Review open-ended questions of the customers who reported a high satisfaction level. Look for specific examples of what they enjoyed. For example, respondents may mention an easy checkout experience or the helpfulness of your customer service agents.
- Customers who were not happy with the experience are likely to provide even deeper insights. Carefully review their statements and consider what changes you need to make to address these pain points.
Market Research Survey
A market research survey can help you apply educated decisions on how to cater to your target market. For example, your research may help you understand the competitive landscape of a survey platform, but it may not give enough detail into a specific feature you want to develop.
A market research survey could provide more detail, especially when paired with secondary research sources.
- Conduct secondary research, which involves reviewing published data such as consumer research reports, white papers, government statistics, etc.
- Identify where you need additional or more specific information to answer any curiosities you may have about your target market.
- Conduct primary research, which involves gathering self-conducted data, i.e., the data that has not already been obtained and made available.
- Plan your market research survey, deploy, and gather results.
- Analyze your results and draw conclusions. By combining data gathered in your survey with other aspects of your market research, you can leverage the survey data to make more confident decisions.
A survey alone will not suffice when it comes to market research, but when paired with secondary research and other forms of primary research, the data gathered in a survey can be illuminating.
Event Evaluation Survey
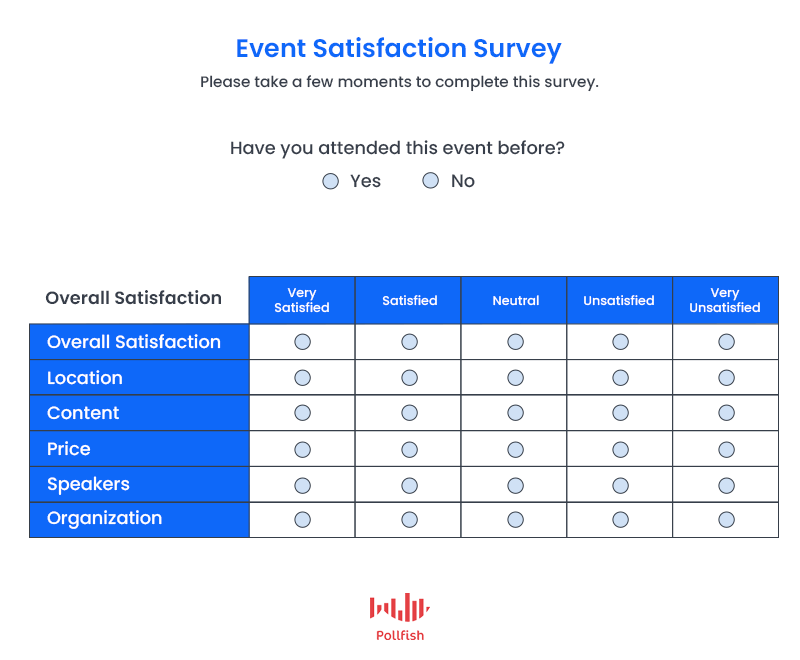
With the time and money dedicated to hosting an event, surveys are important tools for determining the success of the event, whether it was worth the investment and how to improve future events. If you host monthly or annual events, an event evaluation survey is absolutely critical for your success!
- When it comes to analyzing your survey data, again you will need to pay attention to both quantitative and qualitative responses.
- Quantitative data can give you a broad overview of the success of your event. Answers to the following types of questions can help you quickly understand the value of your event:
- Will you attend this event again?
- How likely are you to recommend this event to a friend?
- Was the length of the event too long or too short?
- Were the supplemental resources provided helpful?
- Once you have sorted your data based on response and/or demographics, you can review the qualitative data in the form of responses to your open-ended questions. These personalized responses can help you understand what changes need to be made in order to improve satisfaction with the event.
- If you will have more events in the future, the initial responses can provide you with a benchmark for future events. By deploying surveys after each event, you will be able to see how your changes influence overall satisfaction with the event.
Brand Awareness Survey
Brand awareness surveys are conducted to help a business understand how familiar the target audience is with their brand. Brand awareness has traditionally been very difficult to measure, but if you plan carefully, it will be easier to analyze your survey data.
- First, be sure that you have selected the right audience for your survey via the demographics and screener sections. You need to be specific about your target audience.
- Decide whether you want to do a random sampling to see how many people can recall your brand or whether you want to study brand awareness of existing customers.
- When reviewing the data, carefully examine the characteristics of each segment. This will help you understand the demographics of the people who know the most or the least about your brand. You may discover, for instance, that only those aged 40+ demonstrate brand awareness.
- Understanding the demographics of those who are and are not familiar with your brand can help guide your upcoming marketing decisions. You can decide if you want to strengthen marketing within a segment or try different marketing channels to expand your reach.
Better Analysis Starts with Better Planning
While data analysis is the last step in the survey process, you can make the experience more valuable by considering data analysis during the planning phase. Consider the type of survey you will conduct and think how different data sets will make it easier or more difficult to interpret results.
Data analysis is more fruitful when you have selected the appropriate target audience and have an adequate response rate for your survey. All of this is made easier when you use a professional survey platform to plan, deploy, and analyze the results of your survey.
Frequently asked questions
What is survey data analysis?
Survey data analysis the process of reviewing the data that was gathered during a survey and analyzing it in order to draw actionable conclusions.
What is a crosstab?
A crosstab, or crosstabulation, is a special type of table used in survey data analysis that shows the relationship between two or more variables.
What is statistical significance?
Statistical significance is a term that describes how likely or unlikely it is that a relationship between two or more variables is due to random chance.
When can sampling bias occur?
Sampling bias occurs when certain members of the sampled population are more likely to be selected than others, thus skewing the results. Sampling bias is more likely to happen when respondents are not chosen at random and/or the sample size is too small.
What is a quantitative survey response?
Quantitative responses are those that have a restricted number of options as the response. These responses can then be converted into numbers so they can be easily measured and charted.