The Guide to Using Crosstabs in Pollfish (Late 2022 UPDATE)
Crosstabs are a matrix-style format for data visualization and are one of the most useful and common ways that market researchers analyze data. Pollfish offers cross tabs as an excel export for easy synthesis outside of the platform.

Analyze Pollfish data using crosstabs
Crosstabs are an easy way for researchers to synthesize data and analyze the relationships between two (or more) variables. The variables represent categorical data from the survey, and are displayed in rows and columns in a matrix for researchers to quickly find data in corresponding cells.
Many traditional tools and services offer crosstab reports, although the process is extremely manual. Researchers may only have access to the raw data from their studies initially and need to request that a crosstab report be generated for them. Because these reports are often an additional service, this can add significant expense to a research project.
Pollfish has always been at the forefront of market research technology, so we tackle crosstabs a bit differently. Our process is automated to generate crosstab reports from the survey data that we collect, which is a better fit for convenience, cost, and accuracy for teams of all sizes.
As of May 2021, Pollfish has launched a new edition of crosstabs known as Volume 2 and there will be another iteration coming soon.
Get started with crosstabs in Pollfish
To take advantage of the crosstabs feature in Pollfish, visit the results page of a completed survey, select “Export results” and choose “Crosstab” as your export option. You will be sent an email that notifies you when your export is complete. Open the document in Excel or Google Sheets to get started.
The crosstab sheet will include four “tabs” across the bottom.
- Count: This sheet shows the number of responses that fit a row and column.
- Percentage: This sheet shows the percentage of all responses from the survey that fit a row and column.
- Row Percentage: This sheet shows the percentage of the row that falls into a specific column.
- Column Percentage: This sheet shows the percentage of the column that falls into a specific row.
Example results using Pollfish crosstabs
Say you’re interested in Android users, specifically those who might switch to using an iPhone. You could run a survey, similar to the one below to ask men and women of all ages their opinions about the two devices.
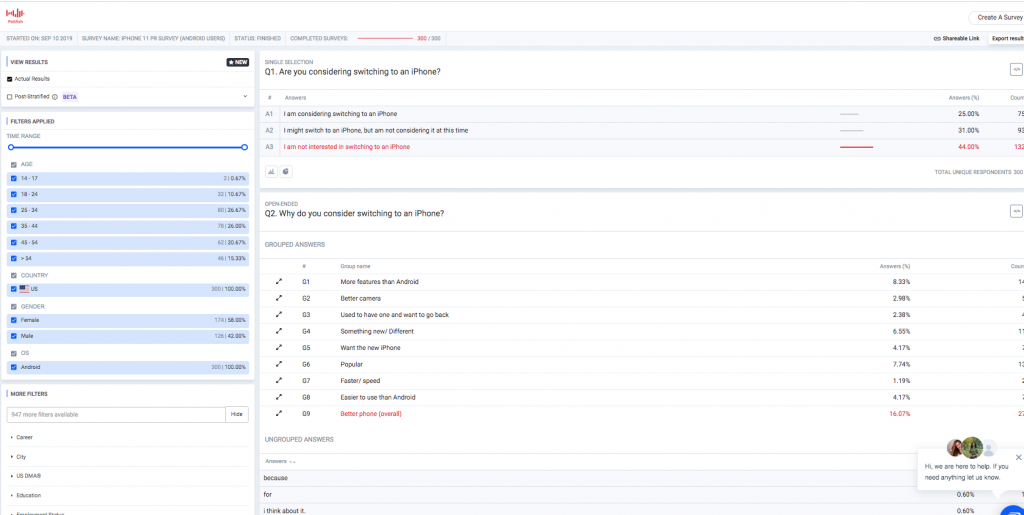
However, you could achieve a deeper level of insight by exporting these results to crosstabs, and seeing what data correlations come from it. For example, how many women are considering switching to the iPhone?
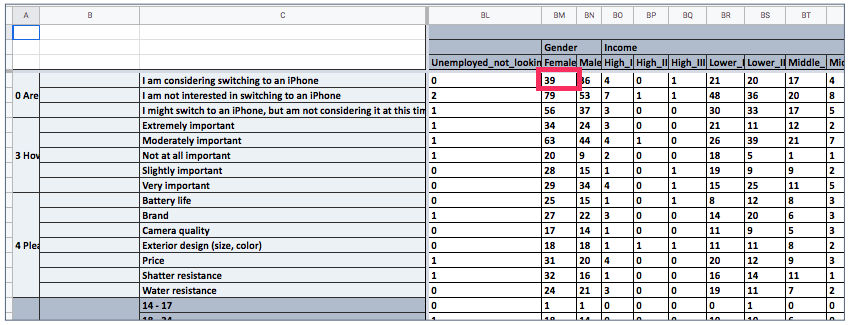
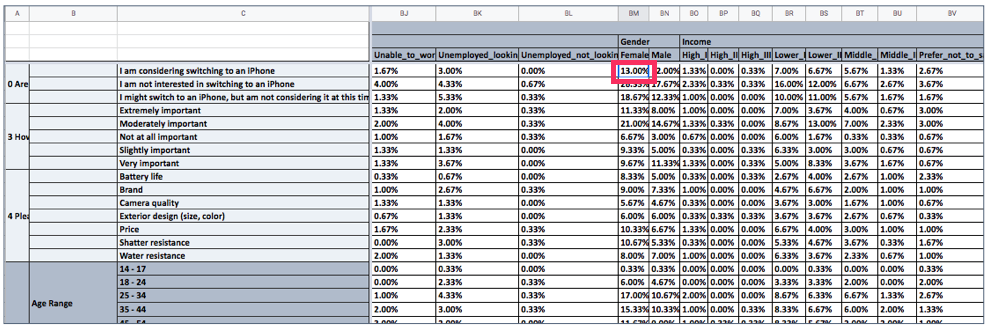
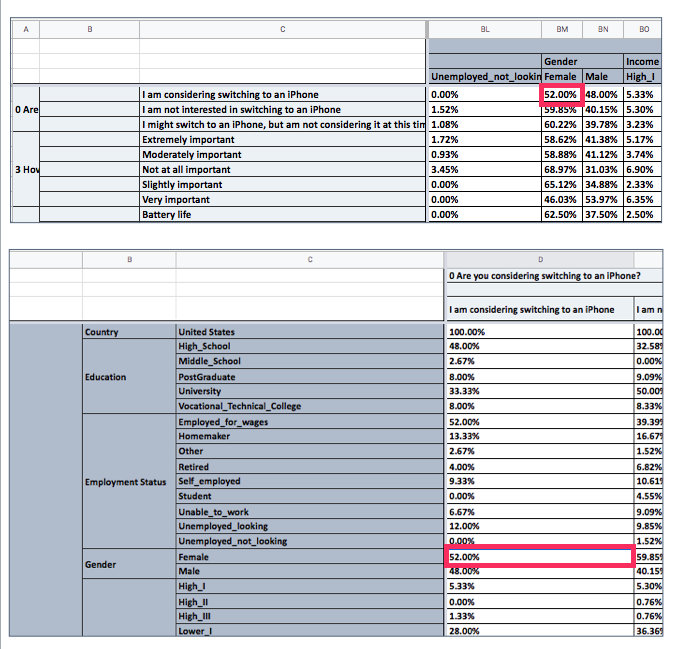
Using the “Count” tab, you can see that 39 women from the survey said that they were considering switching to an iPhone. Using the “Percentage” tab, you can see that the 39 women represent 13% of the sample population that was surveyed.
The “Row-Percentage” and “Column-Percentage” tabs are inverse tables of data that show the percentage of the rows that belong to a single column, and vice-versa. You can toggle between these tabs to choose the view you prefer.
In our example, we can see that 52% of the respondents who were considering switching to an iPhone were women, where the rows and columns are displayed differently depending on the tab selected.
To gain familiarity with crosstabs, you can view the iPhone survey here and check out the crosstab export to see how the data looks. Or, you can export your own finished Pollfish survey to explore your results with a new tool.
Understanding the Updated Crosstab Features
In the Pollfish Crosstabs export file, all questions can appear in both the columns and the rows. In the Crosstab Designer, specifically, researchers can drag and drop to add whatever they see fit for their analysis. The answers can be based on different demographics, along with the percentage of those demographics that have answered in a particular way.
In our advanced version, the cells include more than just percentages of responses. Rather, the data is featured in boxes, with each box containing various information. This includes the count and percentage. In addition, the new Crosstabs version includes more columns per question, with each column representing a different answer.
The data on each answer is then displayed in each box. This version gives researchers a far more organized and granular view of their survey results.
What’s best is that researchers can generate these on their own. Moreover, they can easily drag and drop the questions into the report themselves, so that the report features only the relevant data.
The Two Types of Crosstab Solutions
The Pollfish online survey platform offers two types of crosstab solutions. Each offers a different way to layout your resulting data. The second type has been updated and has several new features to power your survey analysis needs.
- The first solution includes the results from the results page. It can appear as:
- All data or Current view
- It bridges the gap between the excel individuals file and the results page.
- The second solution is called Crosstab Designer.
- This is available for clients with an Elite plan.
- This type of crosstab has new upgrades.
- The Crosstab Designer 2.0 allows researchers to preview their crosstabs and instantly download their crosstabs.
- This allows researchers to design, preview, and download their custom tabular results view.
- It also allows researchers to choose what to crosstab without any limitations. Therefore, it is entirely custom.
- Afterward, they can preview it and download it instantly in seconds on any device
- The new Crosstab Designer supports:
- Crosstab Previews
- Instant downloads
- This will soon support A/B tests.
These first two Crosstab solutions offer translations and both of them also can generate .XLS files.
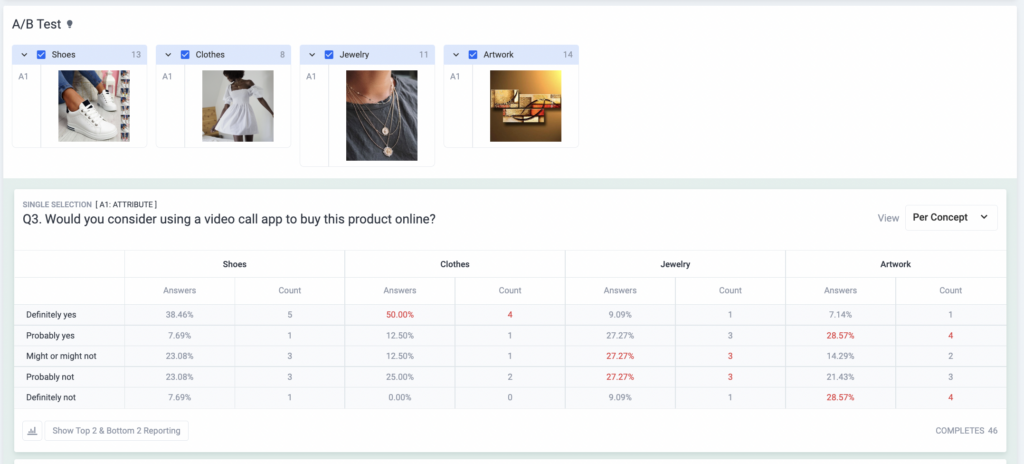
Crosstab Support for A/B Tests (Monadic and Sequential)
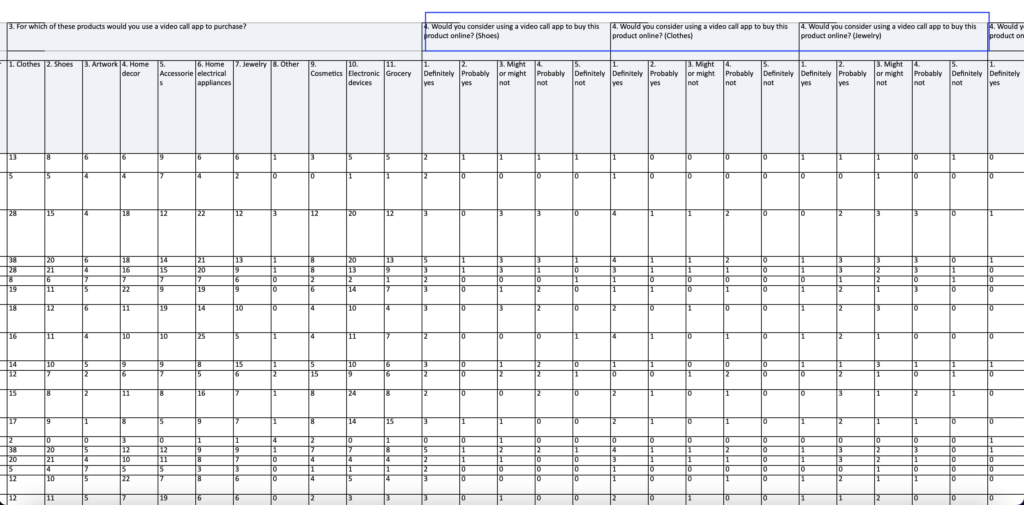
Crosstabs have been updated to include questions and answers per concept.
Specifically, if your survey included an A/B test with three concepts and one single selection question, you will get a crosstab with the question repeated three times. This makes it the same amount as the concepts, with both the columns and the rows.
This change is applicable to both types of A/B tests. These are the:
You can filter the responses by concepts, demographics, along with answers and use the current view export, which will generate a Crosstab based on the filtered responses.
Our team is excited to help you learn more about this newly updated feature, so don’t hesitate to reach out to our 24/7 Customer Experience team if you need assistance.