14 Best Market Research Tools & Software (by Category) in 2025
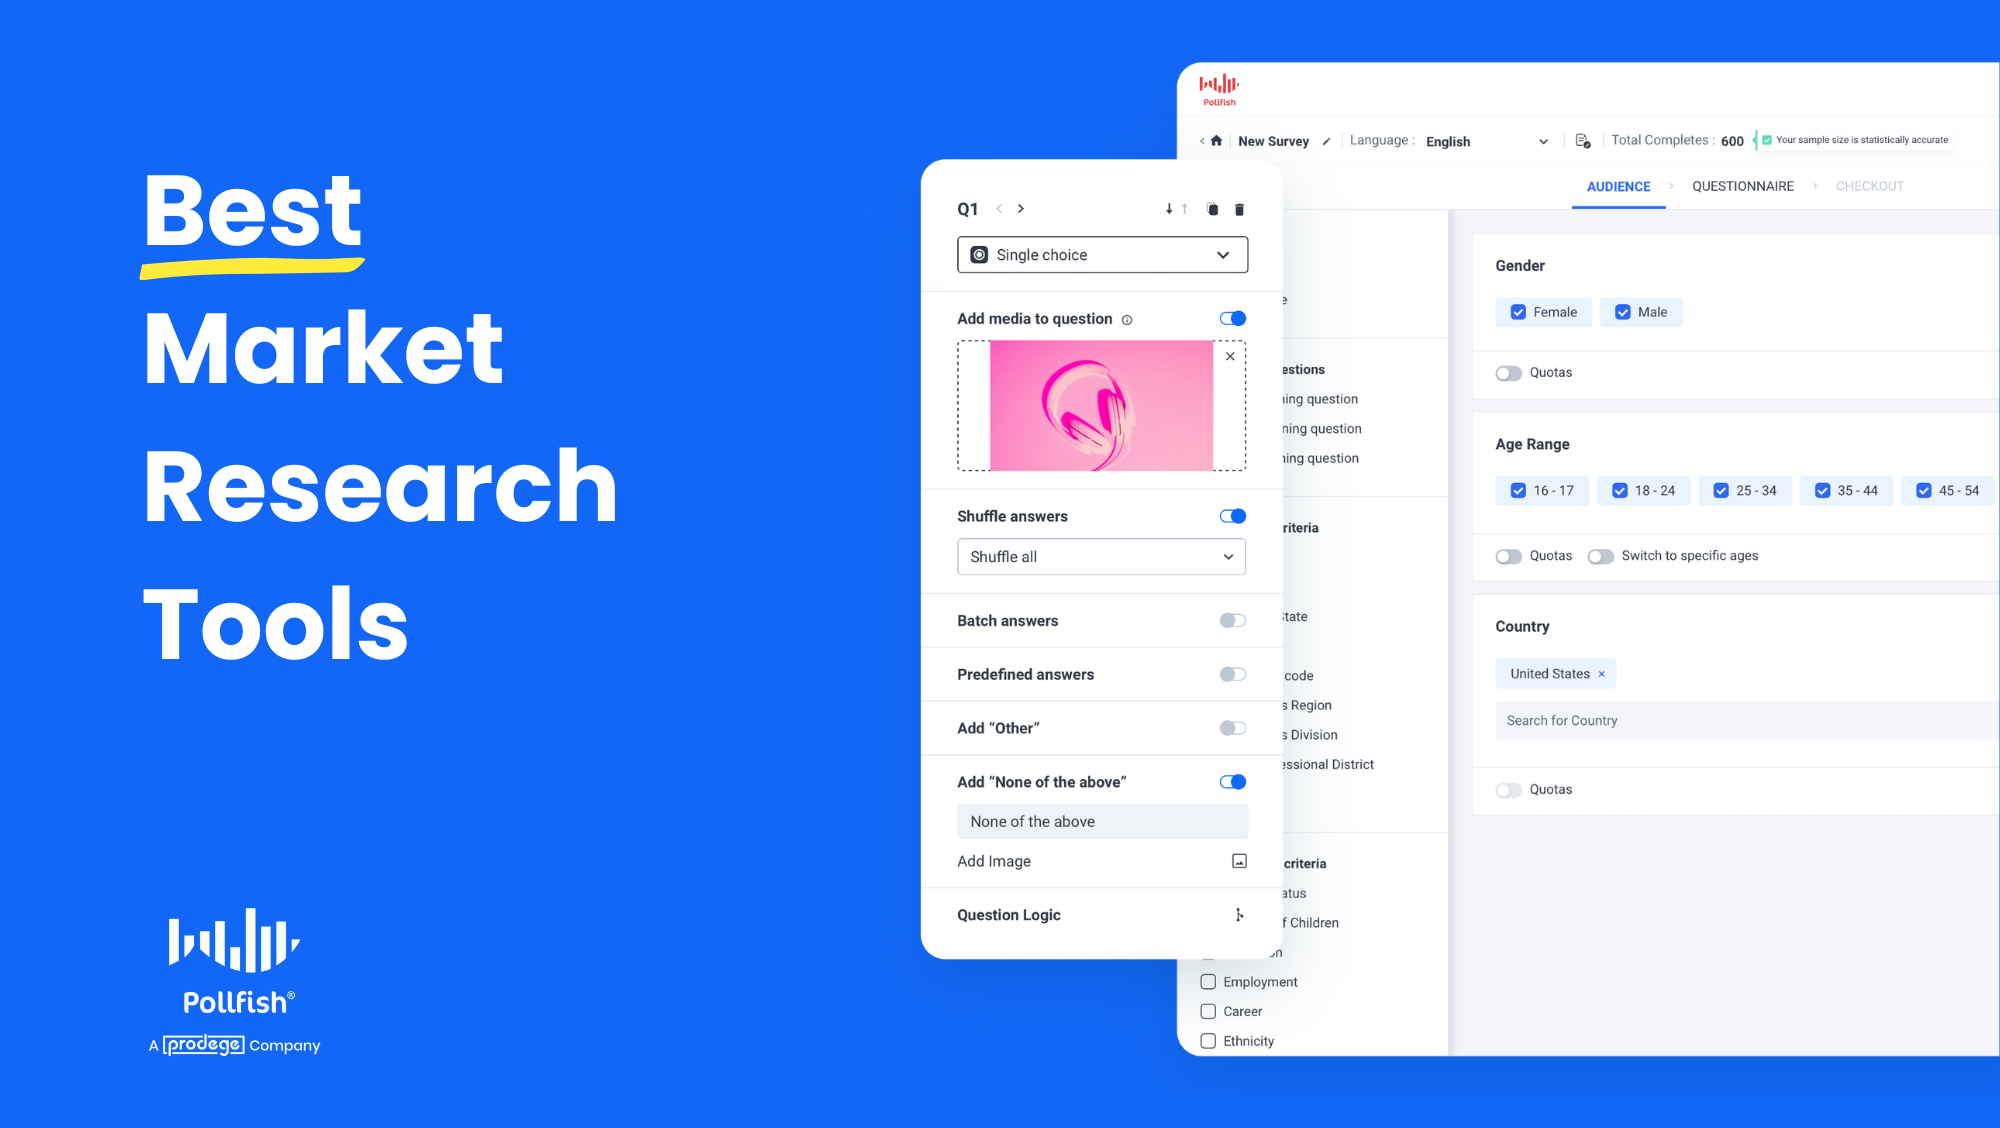
Market research is a broad category that includes everything from surveys, online focus groups and one-on-one interviews, broad data aggregators, social media sentiment analysis, and more.
To accommodate these use cases, there are hundreds of different types of market research tools available so it can be difficult to wade through all of them to find what you need.
To help narrow down your search, we’ll cover 14 options in the following categories:
- Surveys: Surveys are easy to conduct, often delivering results within hours or days. They help you get answers to specific questions rather than relying on information others choose to share. Most survey software also makes it easy to analyze and segment data for targeted insights.
- Focus groups and interviews: When speaking to research participants, you can ask follow-up questions, gauge their tone and mood, and gain deeper insights than most other research methods. However, they’re extremely expensive and time-consuming to conduct.
- Data aggregators: While data aggregators like Statista or the U.S. Census Bureau provide broad statistics on a wide range of topics, the audience targeting options may not be as specific as what you need.
- Social media sentiment: Depending on your research goals, analyzing social media mentions (e.g., posts, comments, hashtags) related to your brand, a competitor, or a specific topic can be valuable. On social media, people tend to be more honest, offering unique perspectives you might not hear via other research methods.
- Data visualization: Analyzing large market research datasets can be overwhelming, but data visualization tools like Tableau simplify complex data into clear visuals, making it easier to spot trends and gain actionable insights.
- Competitor research: You can gain insights by analyzing competitors’ marketing campaigns, such as their best-performing social media posts, ad photos and copy, organic keywords they’re targeting on Google, and more.
To kick off the list, we’ll provide an in-depth overview of how our market research software, Pollfish, can help you easily launch surveys.
Survey Market Research Tools
We’ll begin by exploring four widely used survey market research tools, starting with our own platform, Pollfish. Throughout the article, we’ll also cover other categories of market research tools, providing a comprehensive overview of available options.
1. Pollfish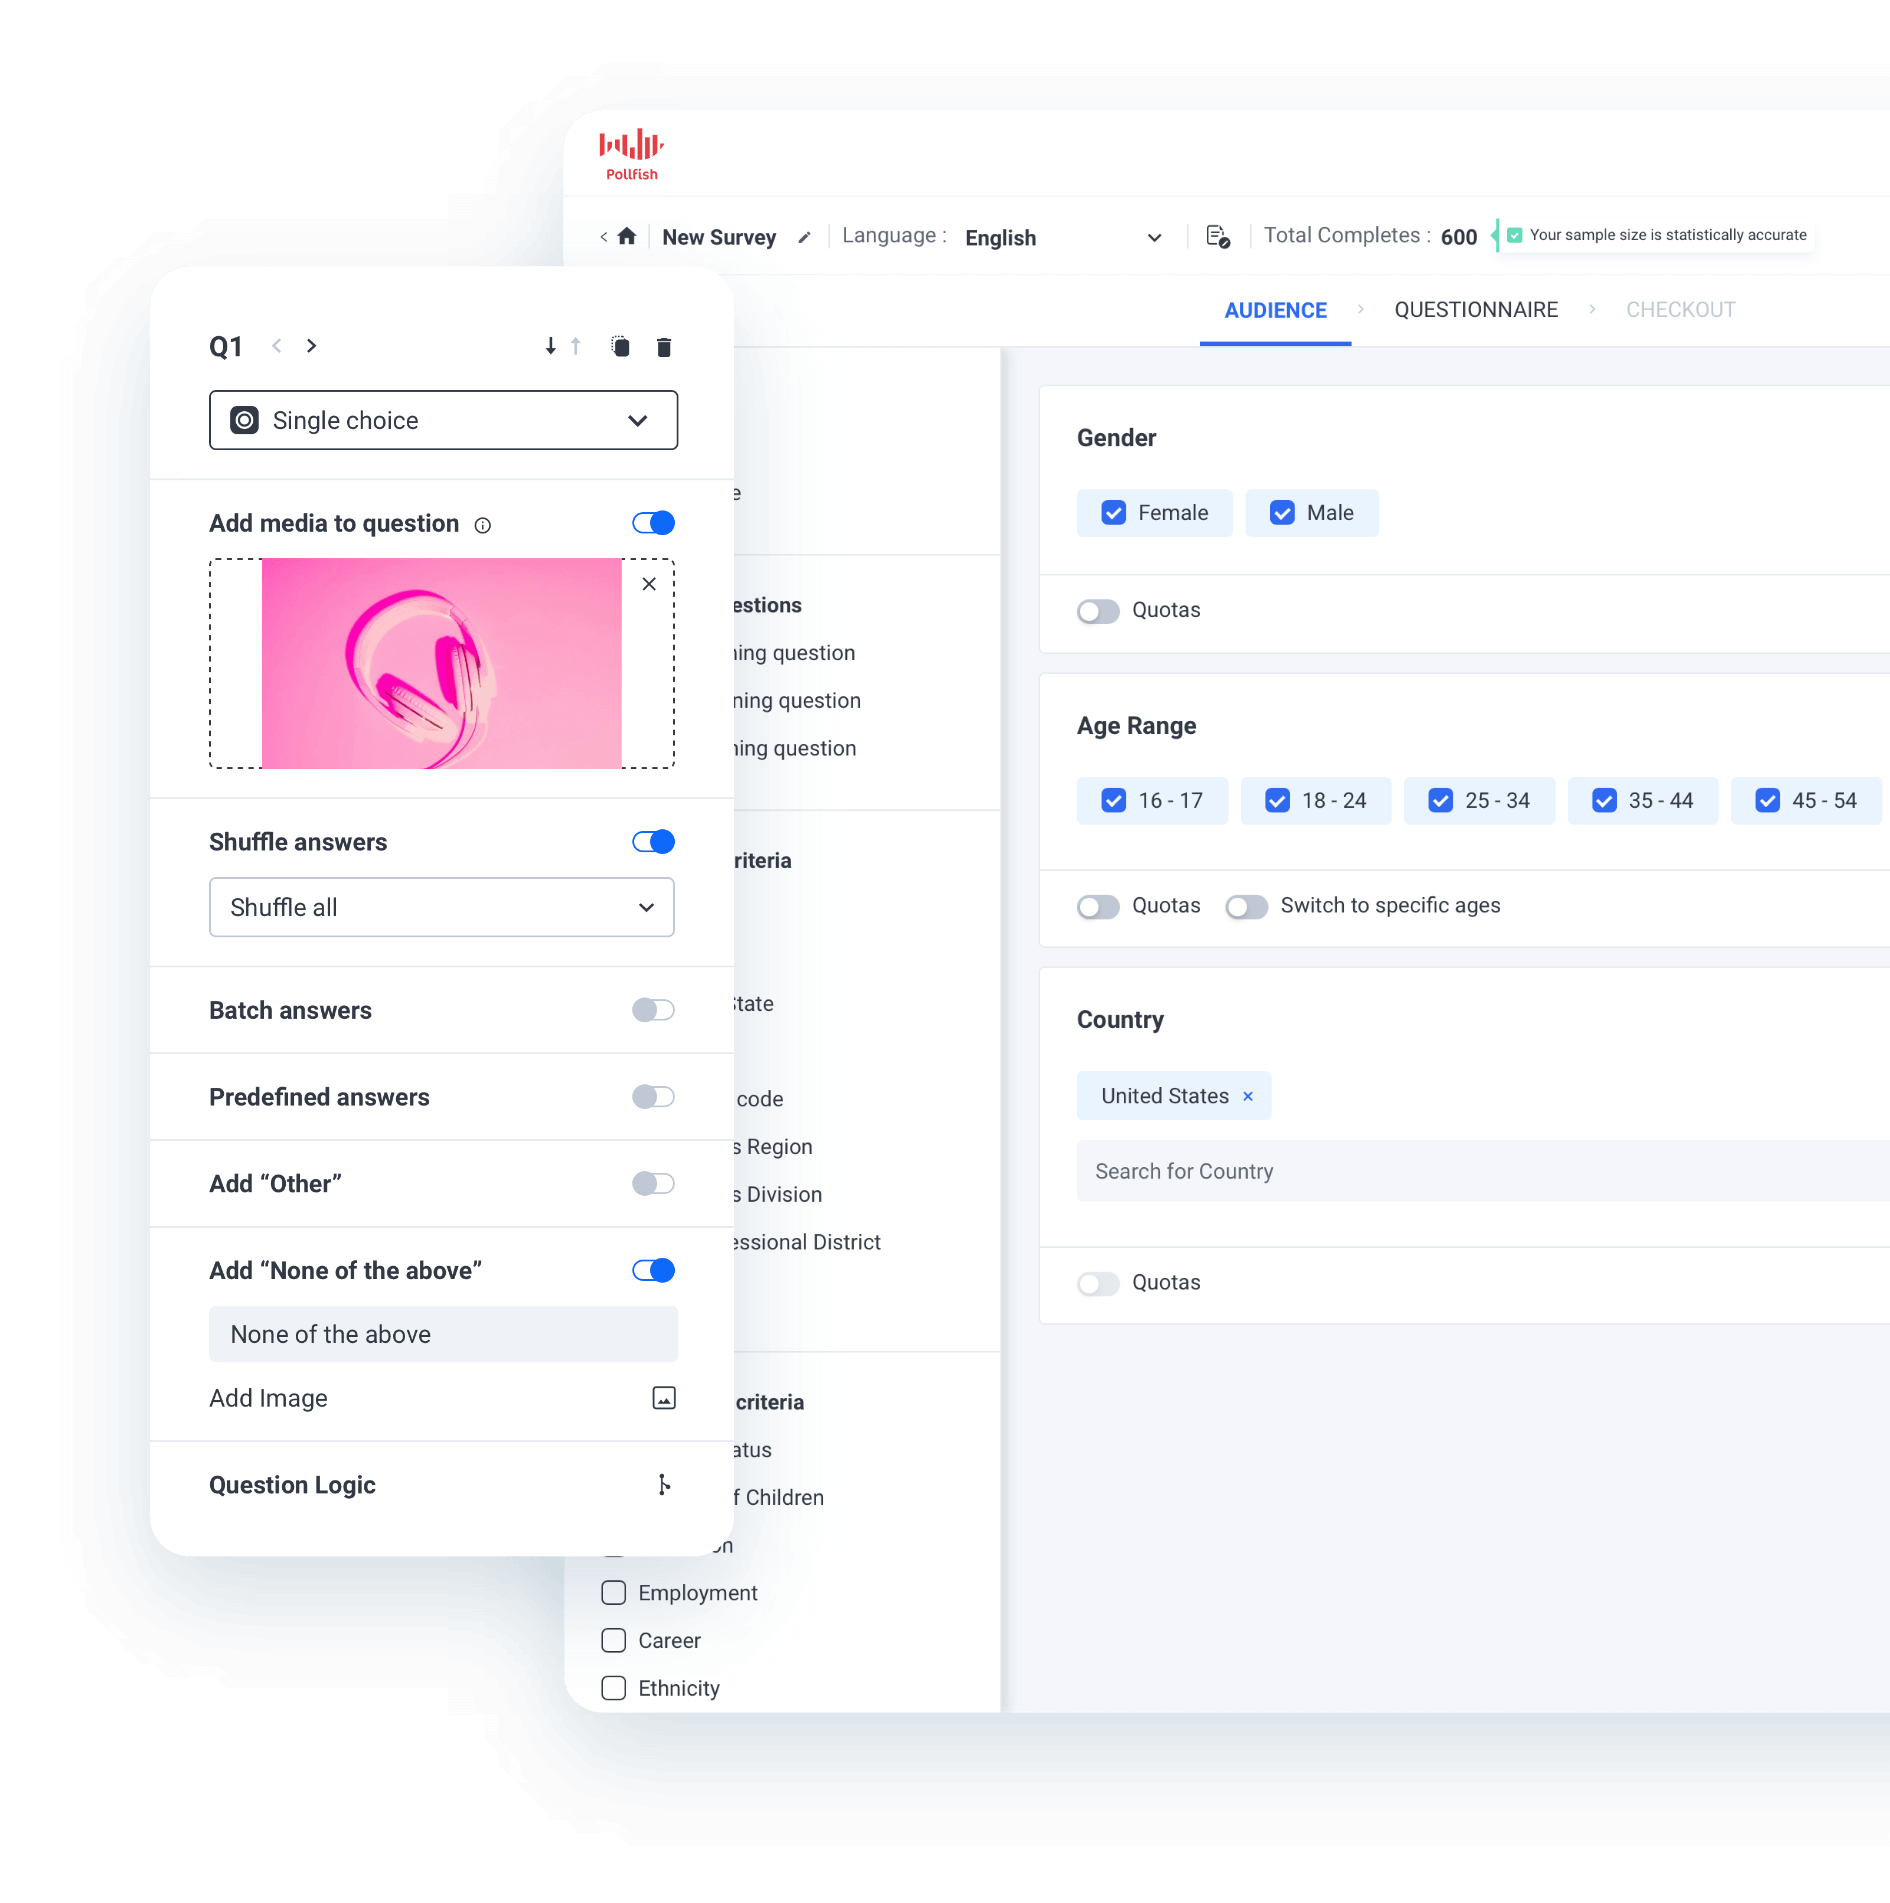

Pollfish understands that survey fraud and low-quality responses are significant concerns that can compromise the integrity of your research. In this section, we’ll outline our comprehensive approach to addressing these issues, which should be a top priority regardless of the survey software you use. Even a perfectly designed survey can be compromised if the software lacks strong safeguards against fraudulent and poor-quality responses.
Once we’ve covered this crucial aspect of maintaining data integrity, we’ll delve into the features and functionality of our survey market research platform. We’ll start with a concise summary of how it works, followed by a more detailed breakdown.
Finally, we’ll highlight three additional benefits of choosing Pollfish:
- Fast survey turnaround.
- Transparent, usage-based pricing.
- Stellar customer support, from basic inquiries to advanced research guidance.
Addressing Survey Fraud & Low-Quality Responses: Pollfish’s Multi-Layered Strategy
Survey fraud and low-quality responses have become major challenges in market research, particularly since the COVID-19 pandemic. Many companies struggle with bots, speedsters, and other forms of bad data, leading to inaccurate results and frustrated clients.
At Pollfish, combating survey fraud and ensuring high-quality responses isn’t just an afterthought — it’s part of our DNA. We’ve invested significant effort in developing a robust, multi-faceted approach that enhances the validity and reliability of our data, setting us apart in the industry.
Specifically, we own and nurture proprietary consumer communities worldwide. Our direct relationship with these consumers enhances the quality and authenticity of our survey responses.
One of our primary communities, Swagbucks, allows members to engage in activities such as downloading games, shopping online, and uploading receipts to earn “swag bucks,” which can be redeemed for cash or prizes.
Owning communities like Swagbucks offers several data quality benefits:
- Our long-standing relationships with panel members allow us to closely monitor behavior and verify authenticity. For instance, if a member makes a purchase through our shopping channel, we can be confident they’re a genuine person, not a bot.
- New members undergo a 30-day evaluation period, completing internal profiling surveys to ensure they are reliable respondents before they can participate in client surveys.
- When members submit purchase receipts, we store that information in our database. This enables Pollfish users to create targeted audiences based on behavioral data, such as filtering respondents who have purchased specific products (e.g., Frosted Flakes cereal) or shopped at particular stores (e.g., Dollar General). Leveraging this purchase data improves the accuracy of audience targeting.
To further ensure the quality of our survey responses, we employ advanced data cleaning techniques, including:
- Unique user ID: We prevent duplicate survey takers by assigning individual user IDs.
- Technical consistency: We verify that the respondent’s carrier and targeting information align.
- Verified partnerships: We remove low-quality respondent pools to maintain data integrity.
- Trap questions: We incorporate “captcha” type questions to identify and eliminate bots.
- Speeding prevention: We set time minimums for each question to ensure thoughtful responses.
- Anti-VPN measures: We only allow responses from verifiable locations to prevent fraud.
- Gibberish detection: We filter out nonsensical or irrelevant responses.
- Straight-lining detection: We identify and remove respondents who repeatedly select the same answer.
- Human review: We manually check text responses for quality and coherence.
- Ranking system: We assign trust scores to our panelists based on their response quality history.
Brief Overview: How Our Survey Market Research Software Works
Creating a market research survey with Pollfish involves three key steps:
Step 1: Define Your Target Audience
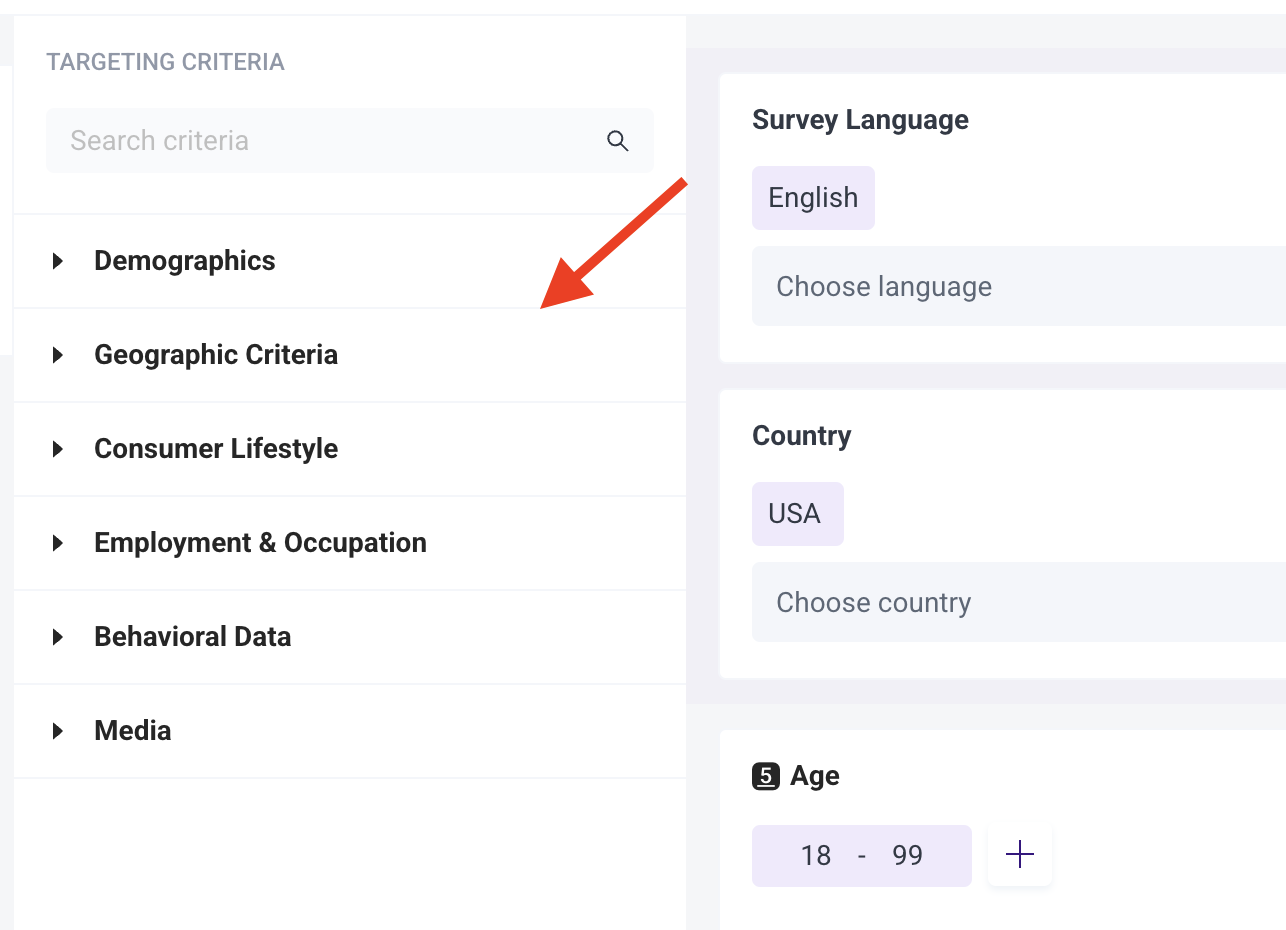
Select from a wide range of targeting criteria, organized into six categories: Demographics, Geographic Criteria, Consumer Lifestyle, Employment & Occupation, Behavioral Data, and Media. This flexibility allows you to tailor your audience to be as specific or broad as needed for your research goals. Pollfish also enables you to set audience quotas to ensure a balanced sample and prevent skewed results.
Step 2: Craft Your Survey
Pollfish offers dozens of question types, allowing you to choose the best format for your needs, including single selection, multiple selection, open-ended, numeric open-ended, rating stars, slider, ranking, matrix (single and multiple selection), Net Promoter Score (NPS), and more.
Enhance data quality by adding screening questions, shuffling answer options, and utilizing skip logic to create custom survey paths based on participants’ responses.
Step 3: Analyze Your Data
Utilize our powerful, user-friendly reporting tools to uncover meaningful insights. Results can be visualized in table formats, color-coded charts, pie charts, and more.
You can also apply targeting filters to focus on specific subgroups or demographics, as well as response-based filtering to refine data based on specific survey responses. The Insights Builder tool, available on the Elite plan, enables you to perform advanced data manipulation and analysis, making it easy for you to create complex graphs and sort and filter variables without the need for Excel. You can also customize the colors of your graphs to match your brand’s color palette, ensuring a consistent and professional look across all your visualizations.
Note that while Pollfish is a user-friendly, DIY platform for market research that lets you easily create and launch surveys, we also offer a full-service option.
This can be useful if you have more complex requirements, need customization or functionality not currently available within Pollfish, or are new to conducting surveys and unsure about best practices. Many of our customers choose this route, where we meet to discuss your specific needs, identify the most appropriate type of research for your goals, and provide complete assistance in running your survey from start to finish.
Note: We invite you to register for a free account or book a demo call with our team, where we’ll provide personalized recommendations on how to get the most out of Pollfish.
In-Depth Overview: A Closer Look at How Our Survey Market Research Software Works
Now that we’ve provided a brief overview of creating a survey with Pollfish, let’s take a closer look at each of the three steps and explore the platform’s capabilities in greater detail.
Step 1: Precisely Define Your Survey’s Target Audience (Choose from an Extensive Range of Targeting Criteria)
We offer an unparalleled range of targeting criteria, allowing you to precisely define your survey’s target audience, whether it’s broad or extremely niche.
The targeting options are conveniently organized into six main categories:
- Demographics
- Geographic Criteria
- Consumer Lifestyle
- Employment & Occupation
- Behavioral Data
- Media
Below, we’ll dive into the details of each category to explore the available options.
Note that while most customers will use only a handful of these targeting options, we want to showcase the full spectrum of possibilities. Pollfish empowers you to be as specific and meticulous as your research goals demand, ensuring you get insights from the most relevant respondents.
Demographics
Age, Gender, Hispanic Origin, Marital Status, Languages Spoken, Education Level, US Voter Registration, Household Income (US), Age & Gender of Child(ren) in Household, Type of Home, Pets in Household, Political Party Support, Hispanic Level of Acculturation, Parental Status / Pregnancy Status, Race, Device Type, Device Operating System (OS), Ethnicity, Number of Children in Household
Geographic Criteria
US State, US Division, US DMA, US Region, US Statistical Area (CBSA), US County, US Zip Code
Consumer Lifestyle
Beverage Consumption, Hobbies & Interests, Sports Participation, Gambling Participation, Music Streaming Services Use, Movie Theater Frequency, Home Movie Viewing Frequency, Video Game Participation, Video Game Consoles, Video Game Genres, Travel by Air for Business/Leisure, Vehicle Make/Brand Own or Lease, Vehicle Type Own or Lease, Health Ailment Diagnosis
Employment & Occupation
Employment Status, Industry Work In, B2B Department, Number of Employees, Job Title
Behavioral Data
Brands Purchased (In-Store), Online Shopping: Retailer, In-Store Shopper, Category Buyers, Retail Channels Shopped (In-Store), Websites Visited, Retail Channels Shopped (Online)
Media
Video Streaming Services Used
Pollfish provides you with the flexibility to be as narrow or as broad as your project demands.
If you’re unsure about the best targeting filters for your research objectives, our team is here to help. We’d be delighted to schedule a call to understand your goals and provide personalized recommendations on the most effective filters to employ, ensuring your survey reaches the ideal audience.
Optionally Set Audience Quotas (to Ensure a More Balanced Sample)
Pollfish enables you to set quotas on your target audience to ensure that your survey results are not heavily skewed towards any particular group.
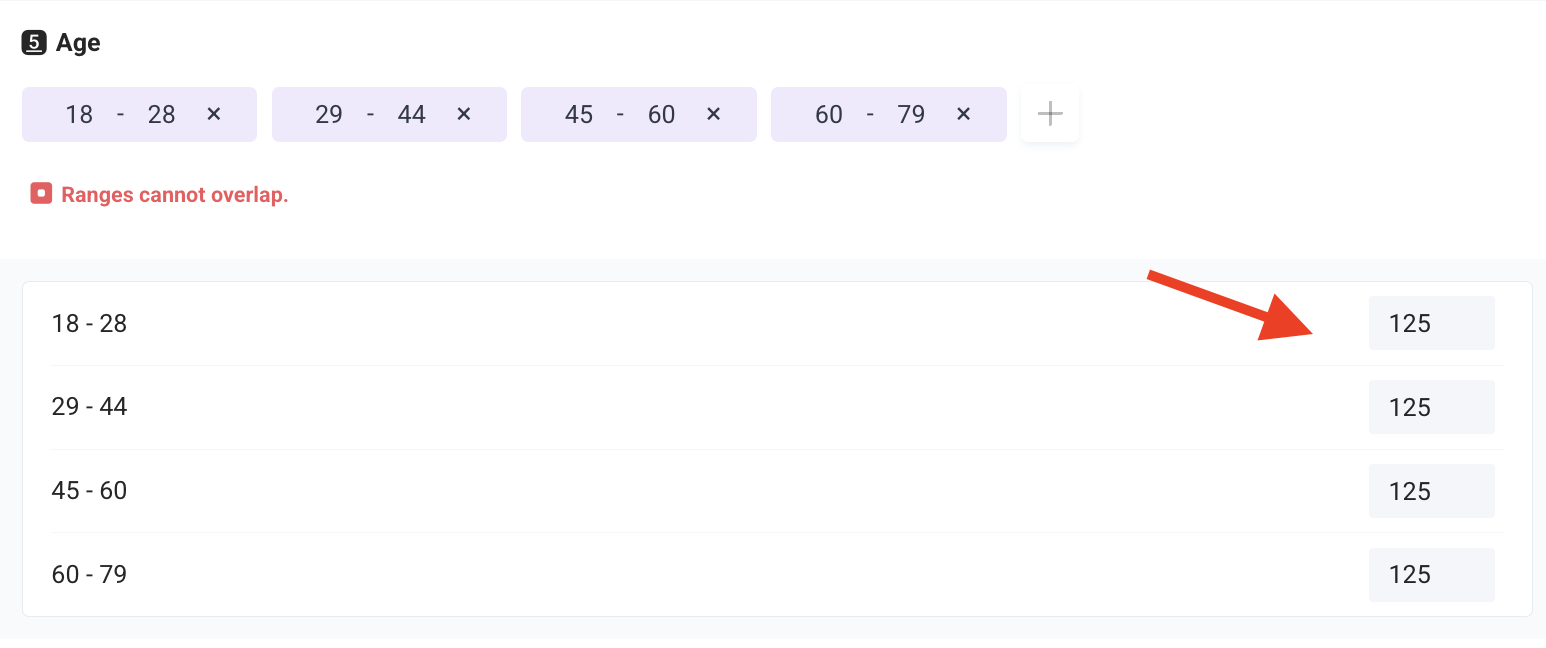
Age quotas are a popular way to utilize this feature. For example, if you want to set quotas based on age groups, you can define four distinct age ranges:
- Gen Z (18–28 years old)
- Millennials (29-44 years old)
- Gen X (45–60 years old)
- Baby Boomers (61–79 years old)
If you’re aiming for a total of 500 survey responses, you can choose to distribute the responses equally among each age group. In this scenario, you’d set a quota of 125 responses per age category, as shown below:
As another option, you can set quotas to have a higher representation of certain age groups, such as Millennials and Gen X, while having fewer respondents from other age ranges, like Gen Z and Baby Boomers.
Step 2: Craft Your Survey Using a Wide Range of Question Types That Align with Your Research Objectives
Pollfish offers a comprehensive set of question types and features to help you create surveys that align with your research objectives.
Choose from 14 Question Types
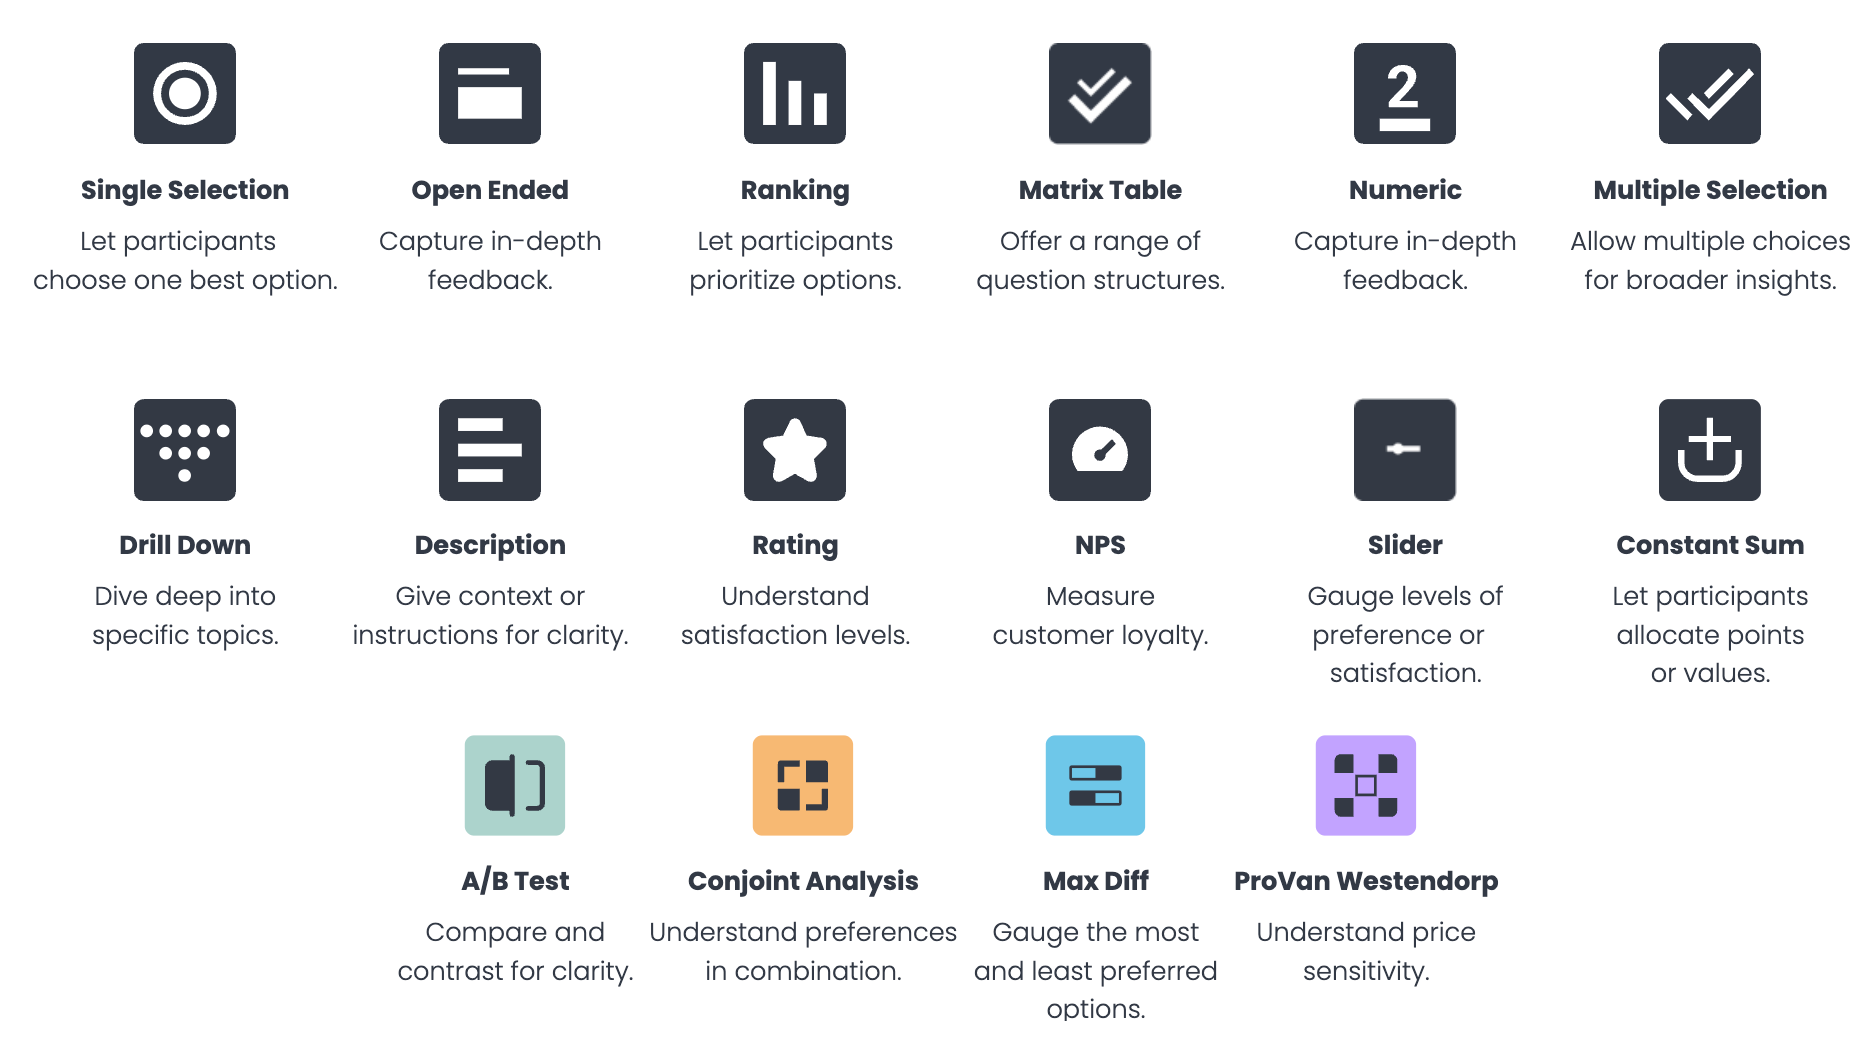
With so many question types available, you can choose the best format for your needs:
- Single selection
- Multiple selection
- Open ended
- Numeric open ended
- Description
- Rating stars
- Slider
- Ranking
- Matrix single selection
- Matrix multiple selection
- Net Promoter Score (NPS)
- A/B test
- Conjoint analysis
- Max Diff
- Van Westendorp
Click here for a more in-depth explanation of each survey question mentioned above, and guidance on choosing the most appropriate ones for your survey.
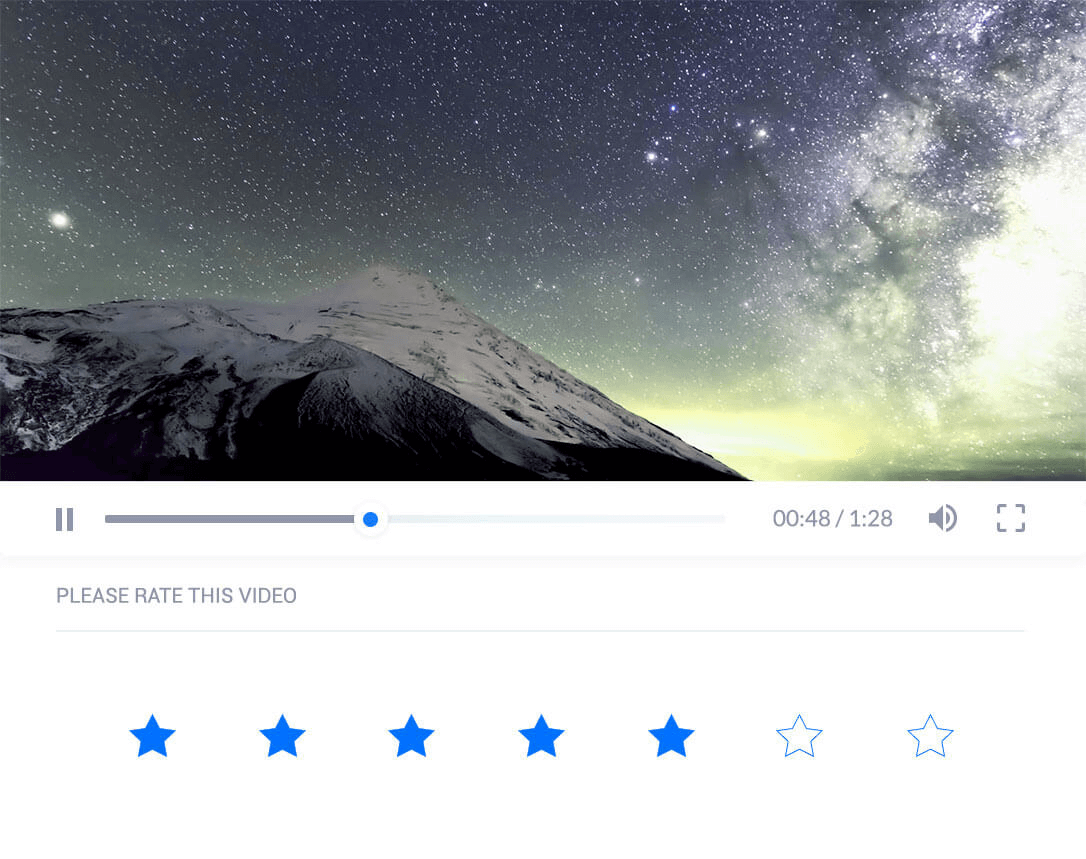
Add media files to questions
Enhance your questions by adding media files, such as videos. You have the option to require respondents to watch the entire video before they can continue with the survey (ensuring genuine engagement and higher quality responses).
Add screening questions
Screening questions allow you to filter respondents based on their answers, ensuring that only relevant participants complete your survey.
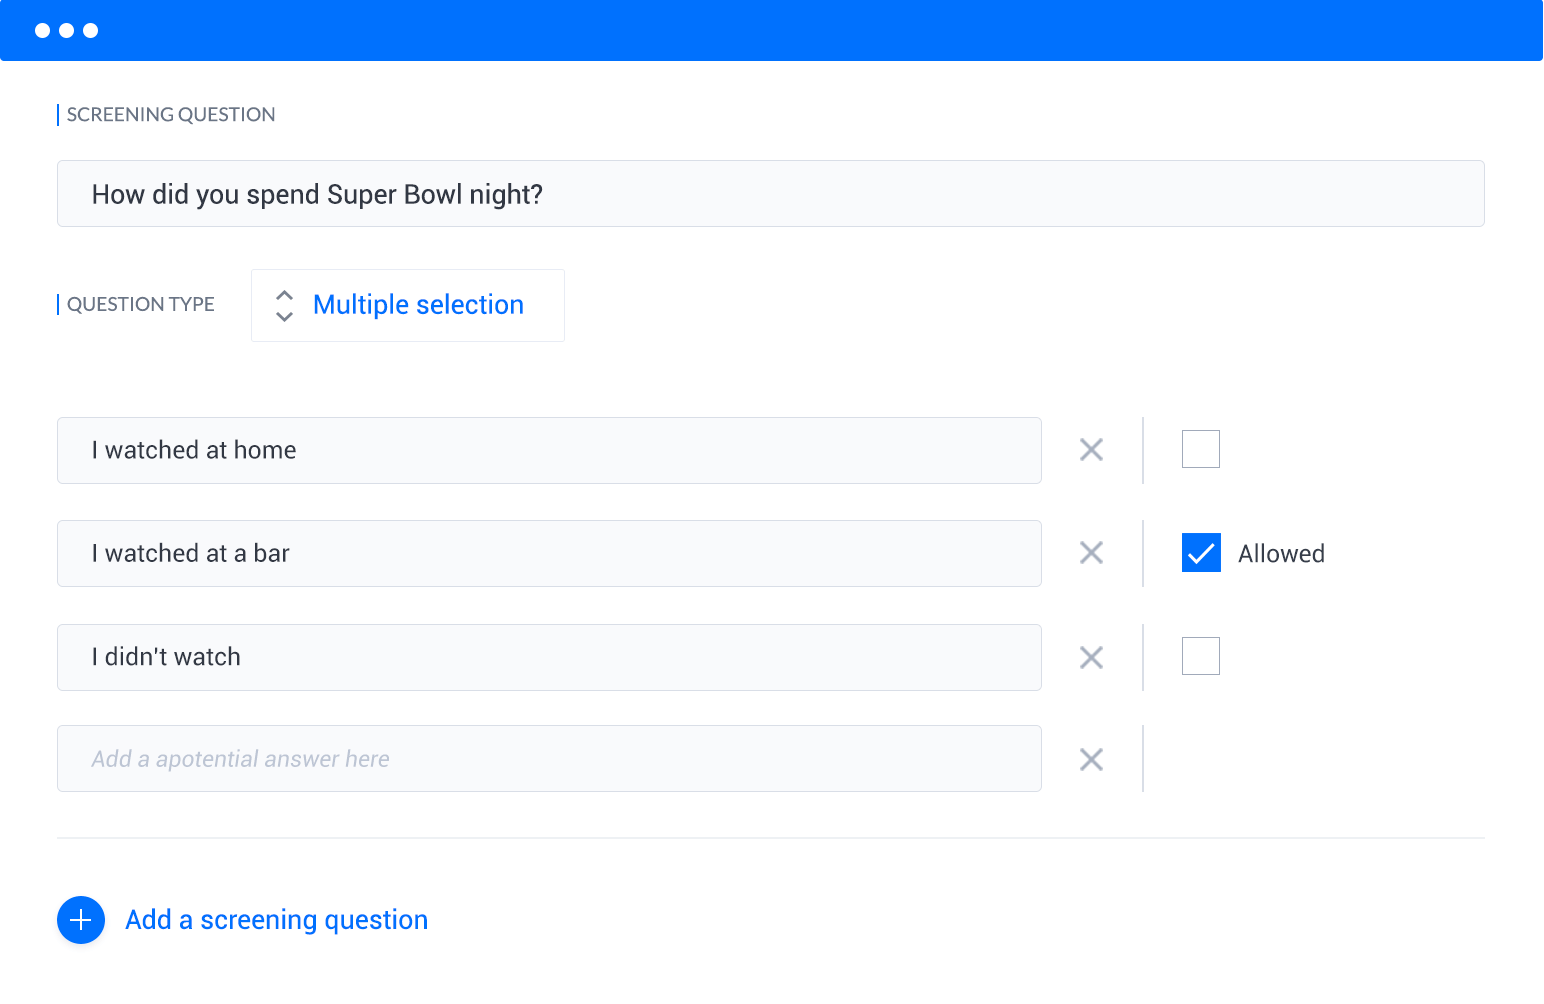
Per the above example, if you asked, “How did you spend Super Bowl night?” and wanted to focus solely on responses from individuals who watched the game at a bar, the survey would be designed to screen out those who selected “watched at home.” Only participants who chose “watched at a bar” would be able to proceed with the remainder of the survey questions.
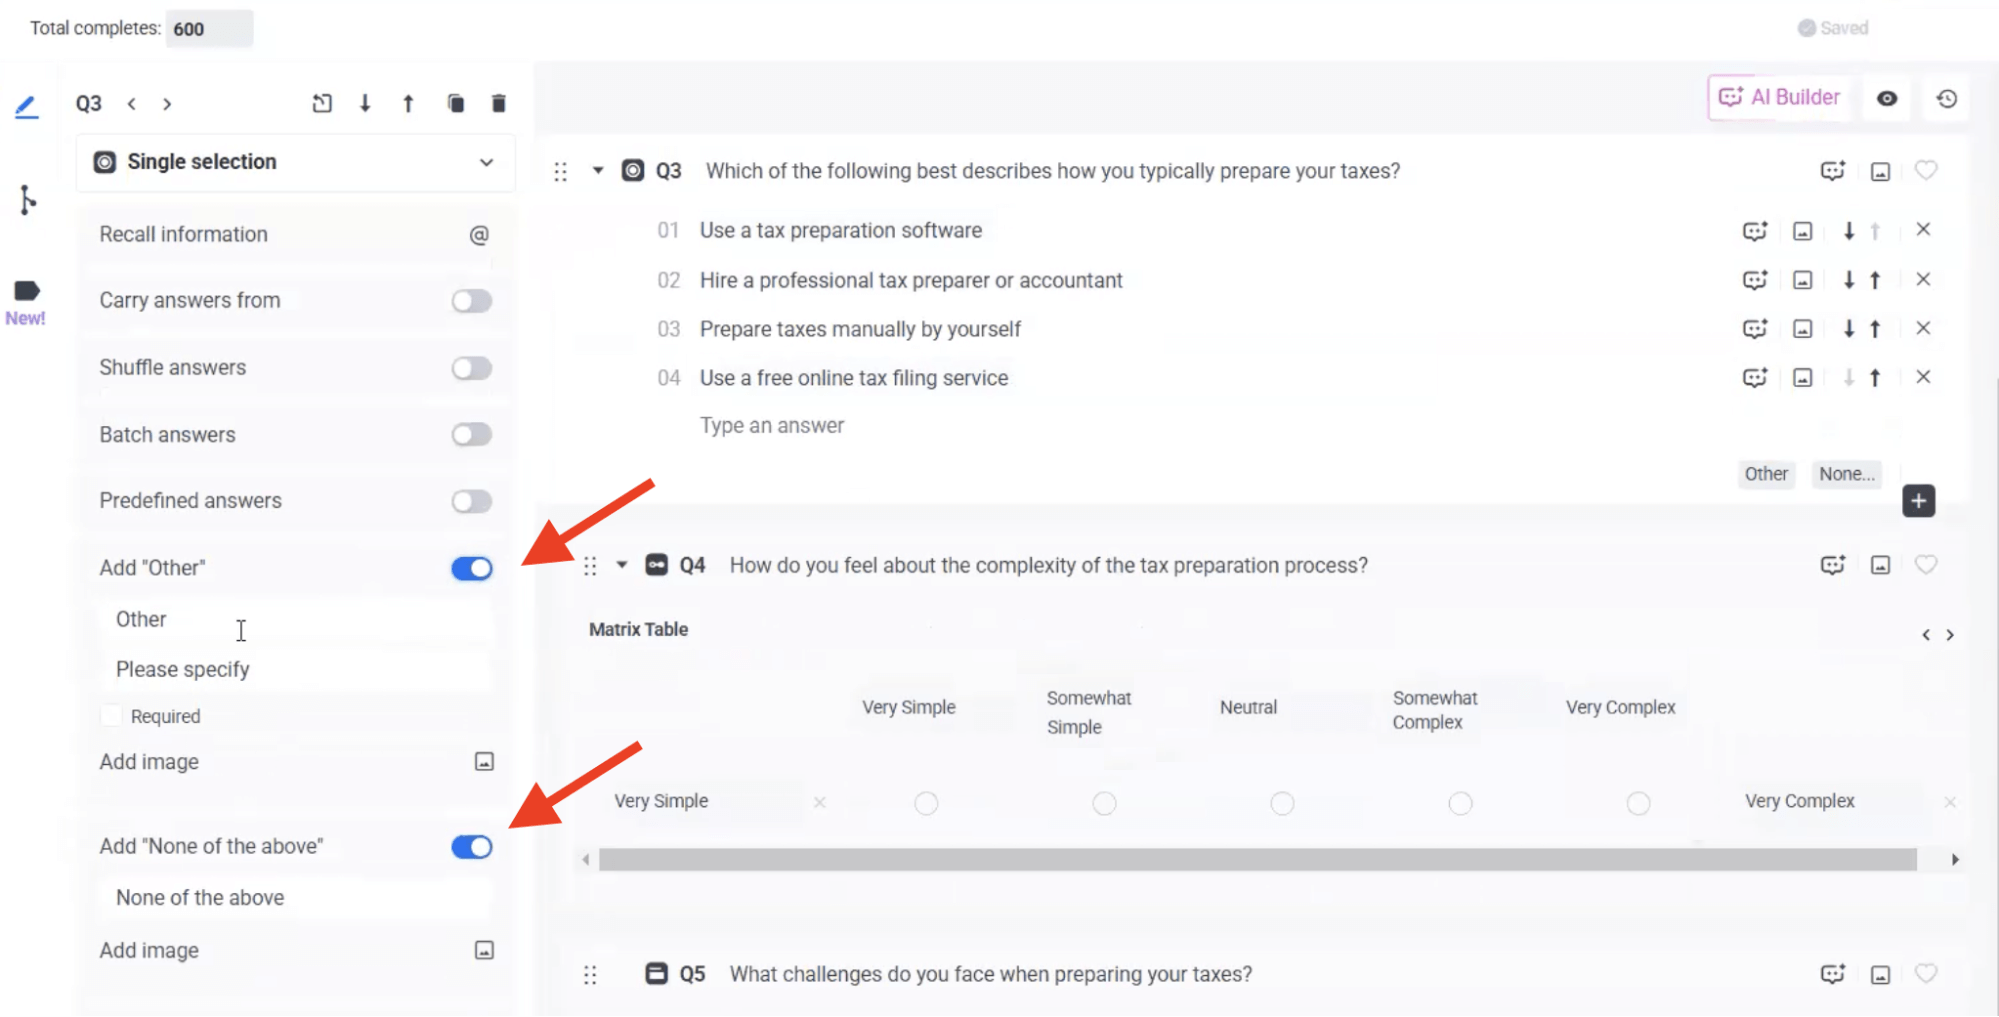
“Other” and “None of the above” Answer Choices
A common frustration for researchers is the need to repeatedly type and add “Other” and “None of the above” as answer choices for each relevant survey question. This repetitive task not only takes valuable time but also increases the risk of forgetting to include these options in some questions.
At Pollfish, we’ve addressed this issue. By simply toggling the “Other” or “None of the above” options, these choices will automatically populate for all relevant question types. The platform ensures that these options always appear as the last choices in the question, even when the answers are randomized or shuffled (a feature we’ll cover next).

Shuffle Answers
Pollfish lets you randomize the order of answer choices, reducing potential bias and ensuring more accurate and reliable data.
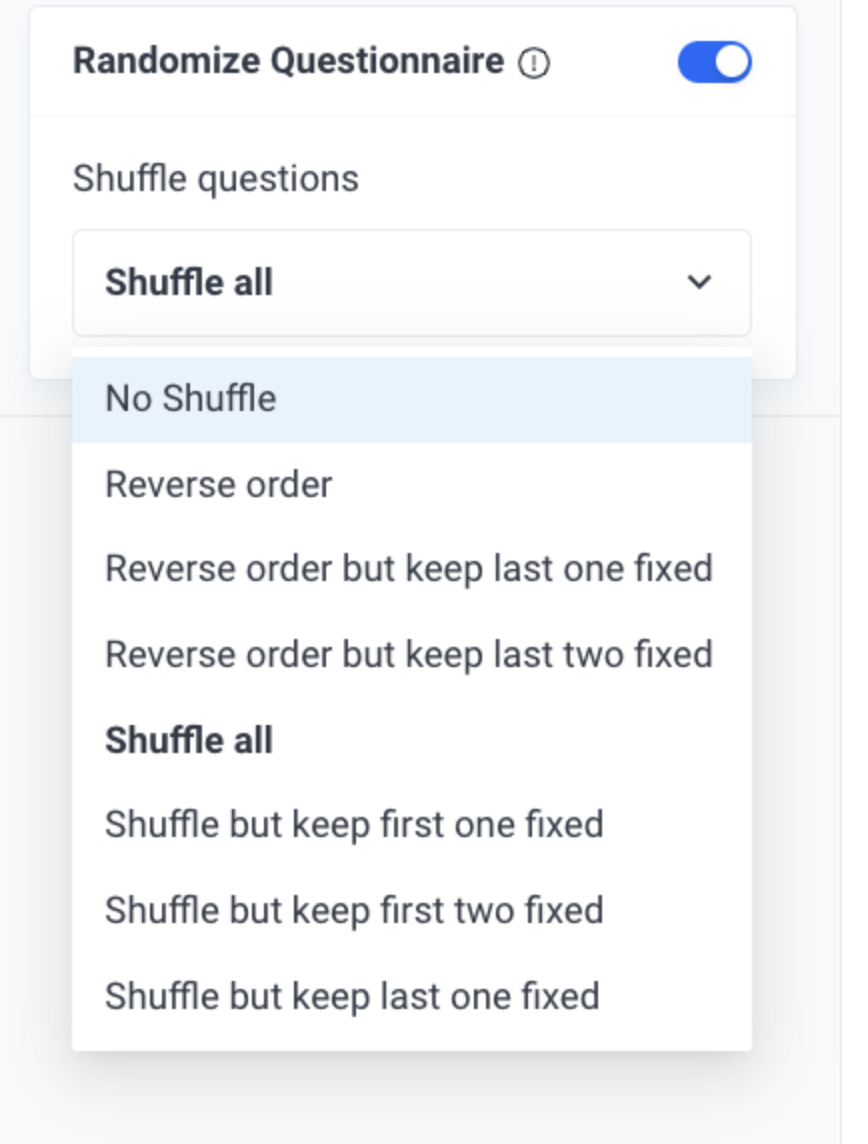
Various shuffling options are available, such as shuffling answers in reverse order, keeping the last answer fixed, and more.
Add Skip Logic (Conditional Branching)
Skip logic allows you to direct respondents towards different survey paths based on their previous answers. For example, if a respondent selects “cost” as an important factor in the first question, you can direct them to a series of cost-related questions (while skipping other irrelevant questions).
This helps respondents be served questions that are more relevant to them, increases survey completion rate, and gets you higher quality data.
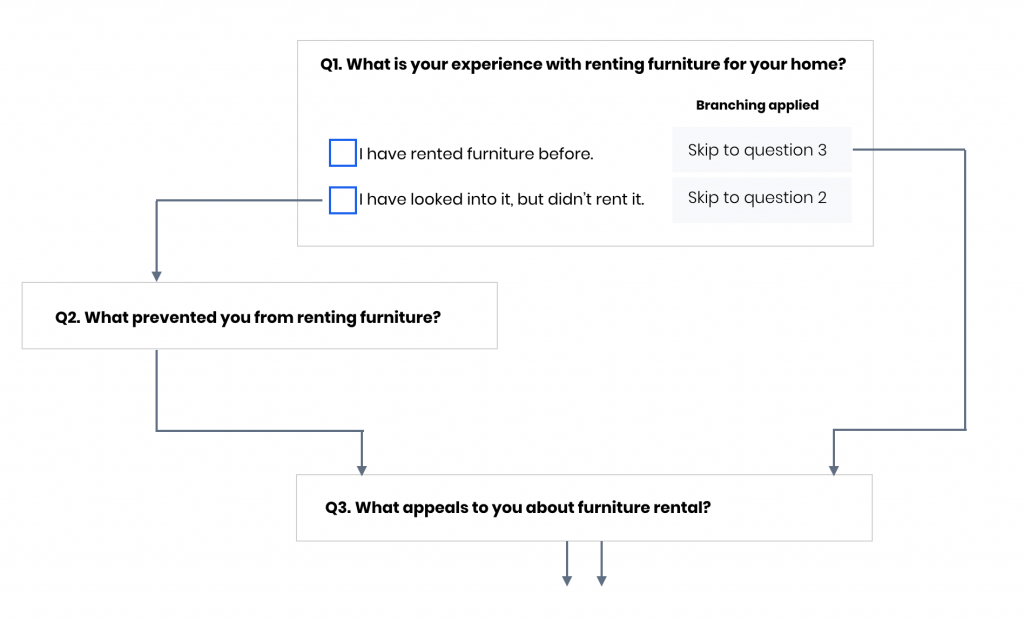
Per the above example, say you’re conducting a survey about furniture rentals. In the first question (Q1), you ask “What is your experience with renting furniture for your home?”. Using skip logic, you can guide respondents to different follow-up questions based on their answer:
If they have rented furniture before, they skip Q2 and proceed to Q3, which asks what appeals to them about furniture rental.
If they have looked into it but didn’t rent, they are directed to Q2, asking what prevented them from renting, before moving on to Q3.
Advanced Logic Path
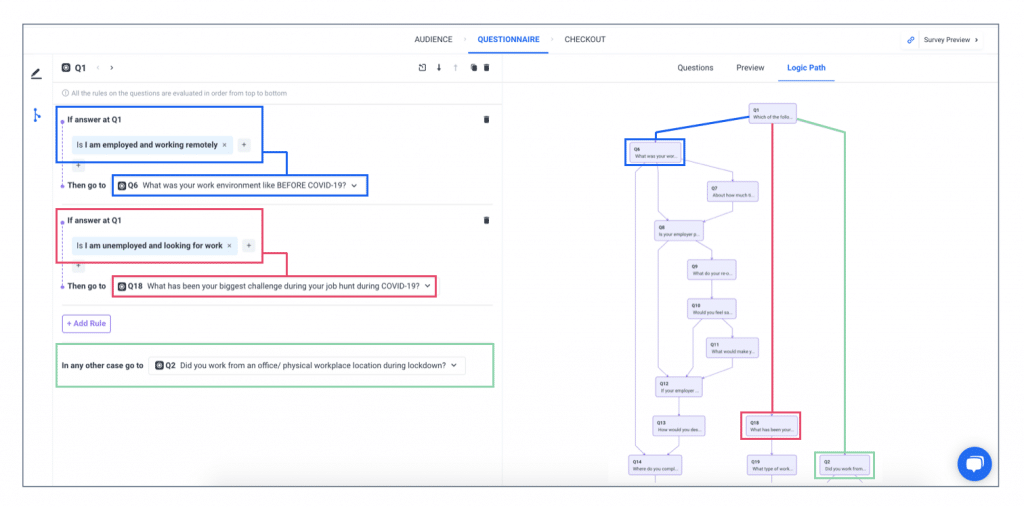
An advanced logic path is a more sophisticated version of a standard skip logic sequence.
A common use case for this feature is aided awareness, where respondents are asked about their familiarity with specific brands. If a respondent indicates they are unaware of the brands, they can be skipped to a later question.
To illustrate this concept, consider a survey where in question 1 (Q1), respondents are asked which sodas they have purchased in the past month.
If a respondent selects Diet Coke, Pepsi, and Fanta, the next series of questions (Q2–Q5) will be related to those three brands. If they had selected “Don’t know, can’t recall”, they would have been directed to question 6 (Q6), skipping questions about those brands altogether.
Step 3: Uncover meaningful insights from your survey data with our powerful, user-friendly reporting tools
Now that we’ve explored the versatility and customization options available when crafting your survey questions and setting your target audience, let’s dive into the next critical phase: analyzing your survey results and extracting meaningful insights once your survey is launched.
Note: One of Pollfish’s standout benefits is its quick turnaround time — most surveys are completed within two days, with some finalized in just a matter of hours, allowing you to start analyzing your results promptly.
Interact with Our Survey Results Dashboard: A Hands-On Experience
In the upcoming section, we’ll explain how our Survey Results Dashboard works. However, words alone can’t fully convey the experience, so we encourage you to explore the dashboard firsthand and see Pollfish in action.
Follow this link to access a live demo of our Survey Results Dashboard. This interactive experience will let you navigate the features, explore the intuitive interface, and see how your survey results can be beautifully visualized and analyzed.
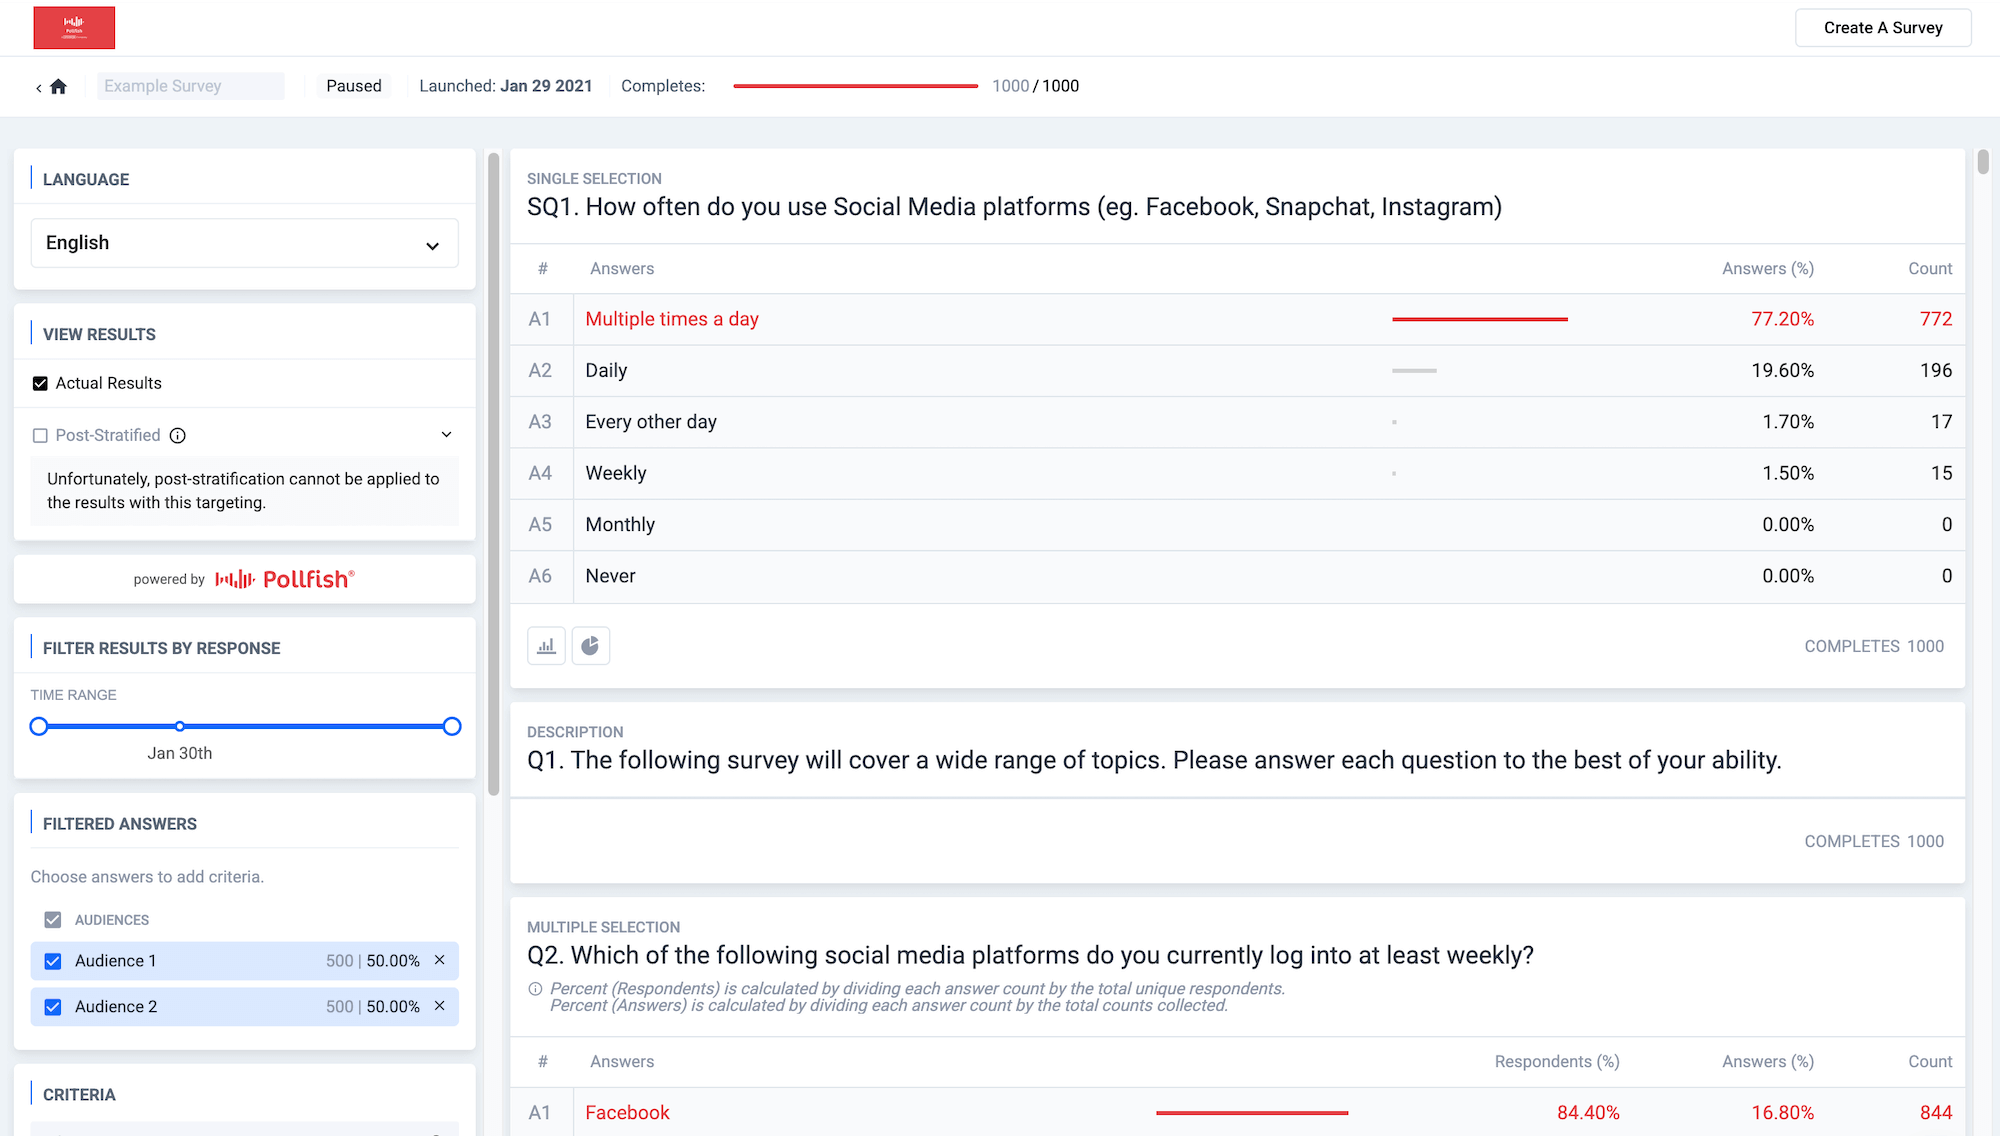
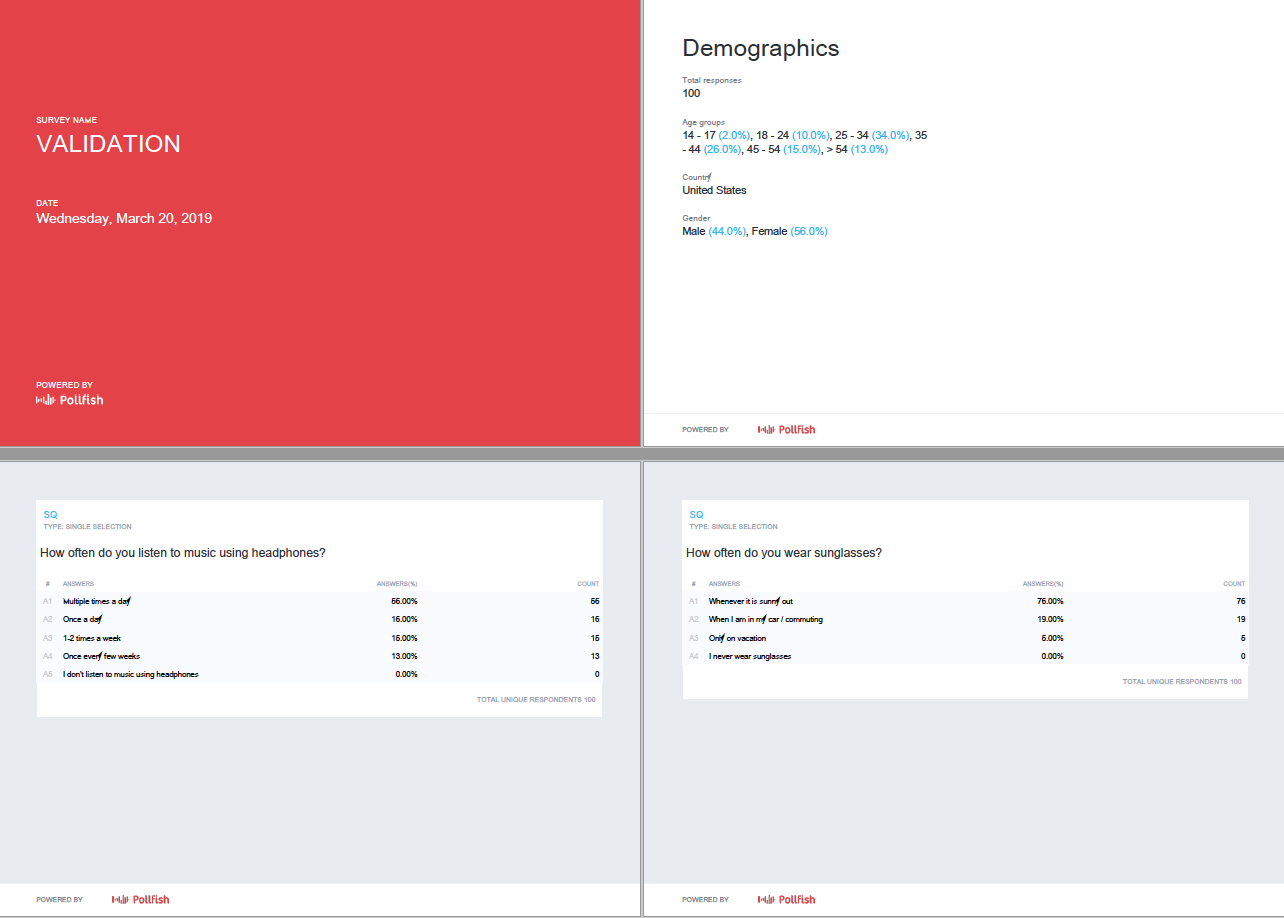
Multiple Options to View Your Survey Results
There are several ways to visualize and analyze your survey results.
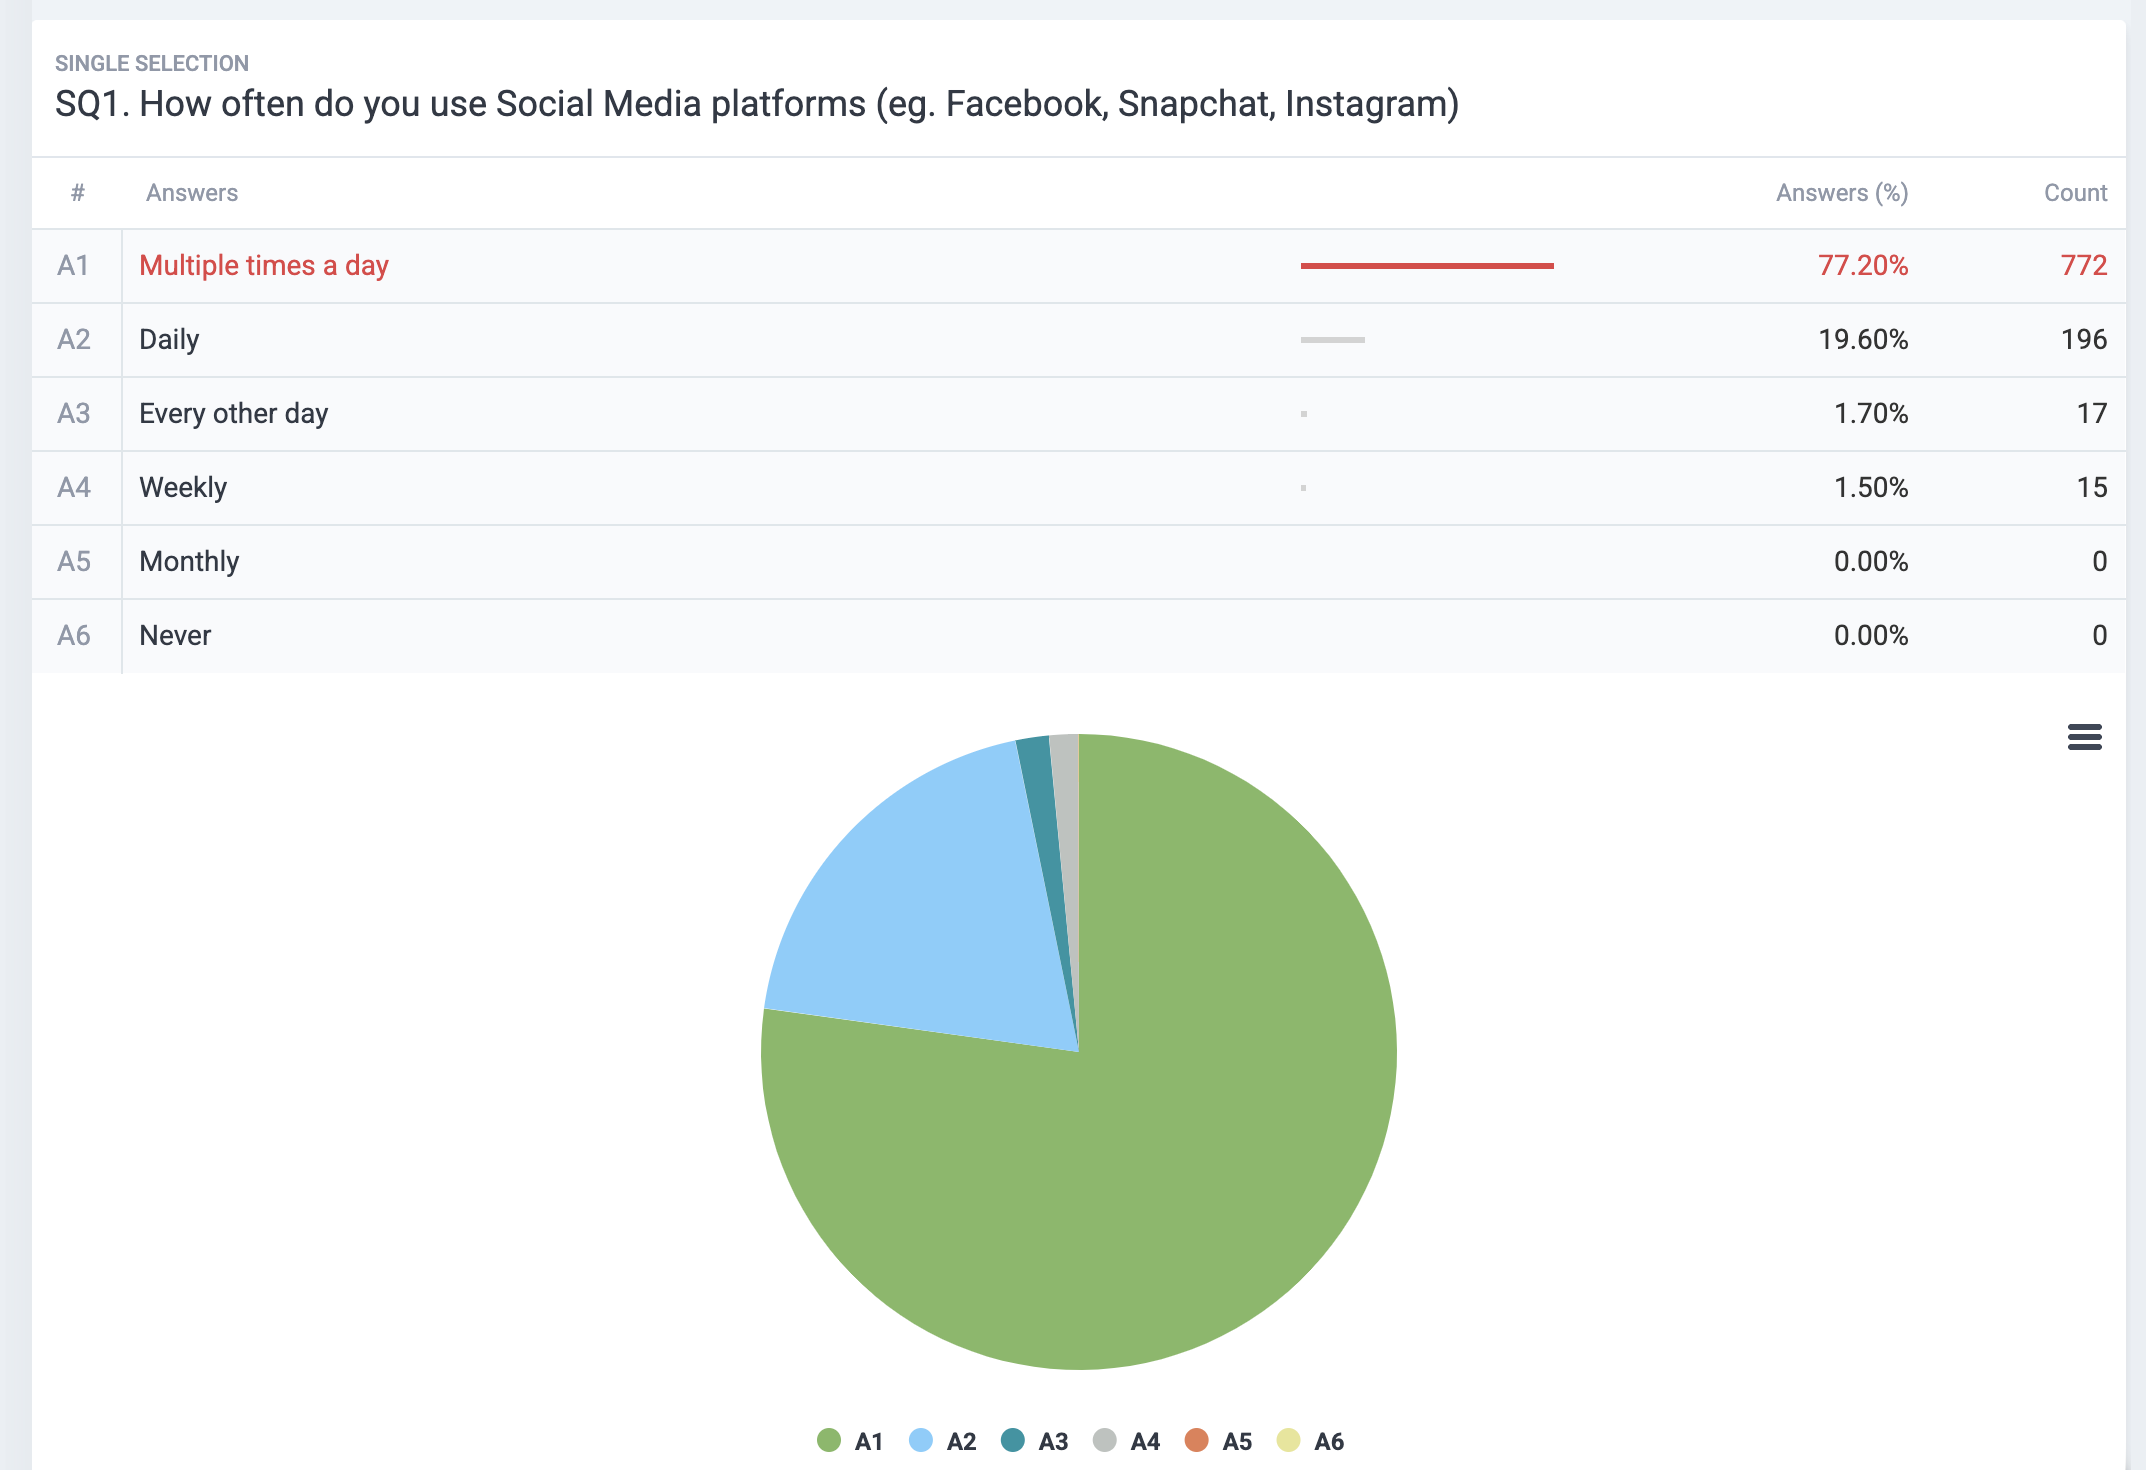
One option is viewing the data in a simple table format, showing questions, corresponding answers, and the count and percentage of respondents for each answer.
For a more visual representation, you can use color-coded column charts or pie charts, making it easy to quickly understand the proportional distribution of answers.
Targeting Filters: Focus on Specific Subgroups
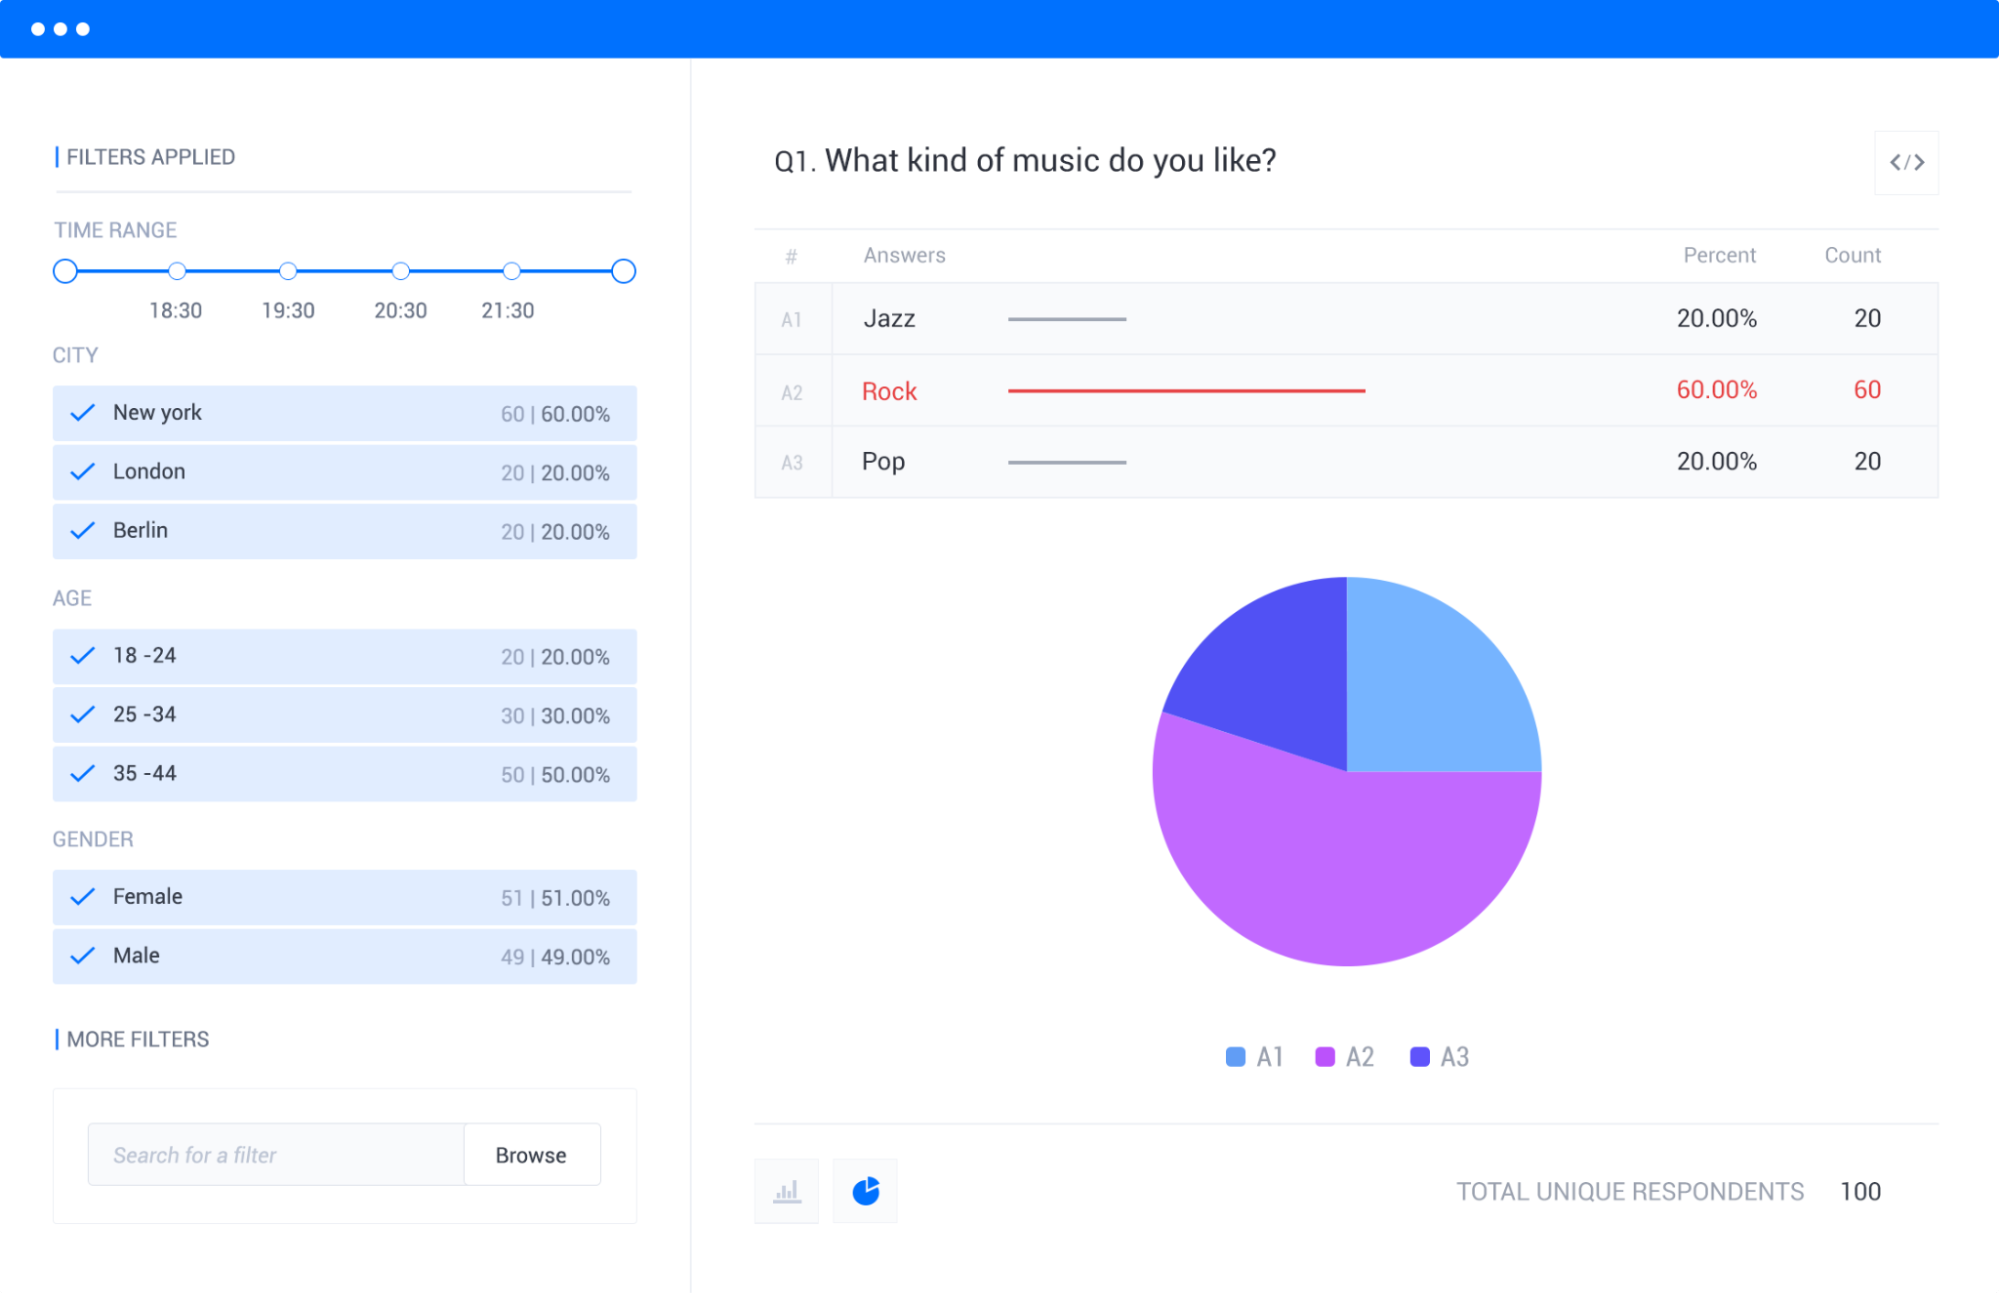
On the left side of the dashboard, you’ll see the targeting criteria you’ve selected.
Simply choose the filters that correspond to the specific subgroups or demographics you want to focus on, and your results will automatically adjust to reflect those criteria.
For instance, say you created an audience that includes four age groups:
- Gen Z (18–28 years old)
- Millennials (29–44 years old)
- Gen X (45–60 years old)
- Baby Boomers (61–79 years old)
If you wanted to dive deeper into the survey data for a specific group, such as Millennials (29–44 years old), you’d simply select that filter on the left-hand side. The results would then dynamically update to showcase only the data relevant to that particular age group.
You could also combine multiple filters, such as “Age” (Millennials), “Gender” (Female), and “City” (New York), and view results tailored to those highly precise demographics.
Response-Based Filtering
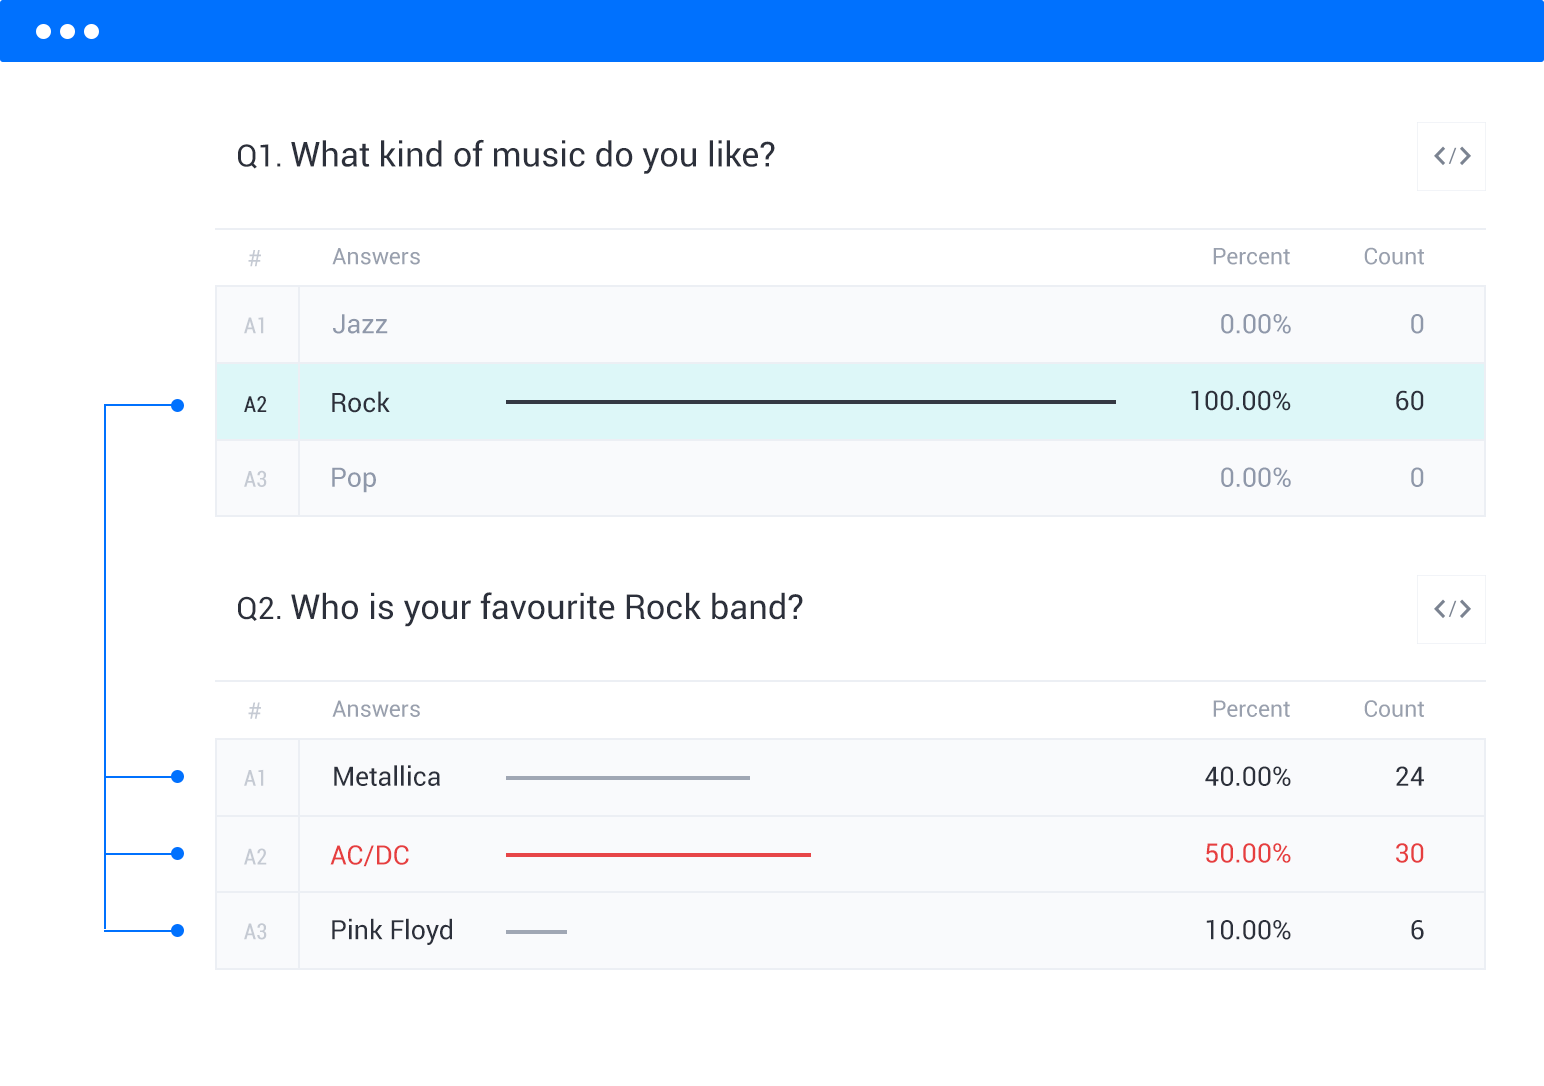
In addition to audience filters, you can also refine your data by specific survey responses.
For example, if your survey asked, “What kind of music do you like?” and you only wanted to analyze responses from those who chose “Rock,” you can filter the data to only include those respondents.
Insights Builder: Advanced Data Manipulation & Analysis

Market researchers often spend a significant portion of their day sorting, filtering, and manipulating Excel data to create complex graphs. It’s a tedious and time-consuming process.
But what if there was a tool that made this task a breeze? Enter Insights Builder, available on the Elite plan. This powerful tool allows you to effortlessly manipulate, sort, and graph data directly within our platform, saving you time and effort compared to working in Excel.
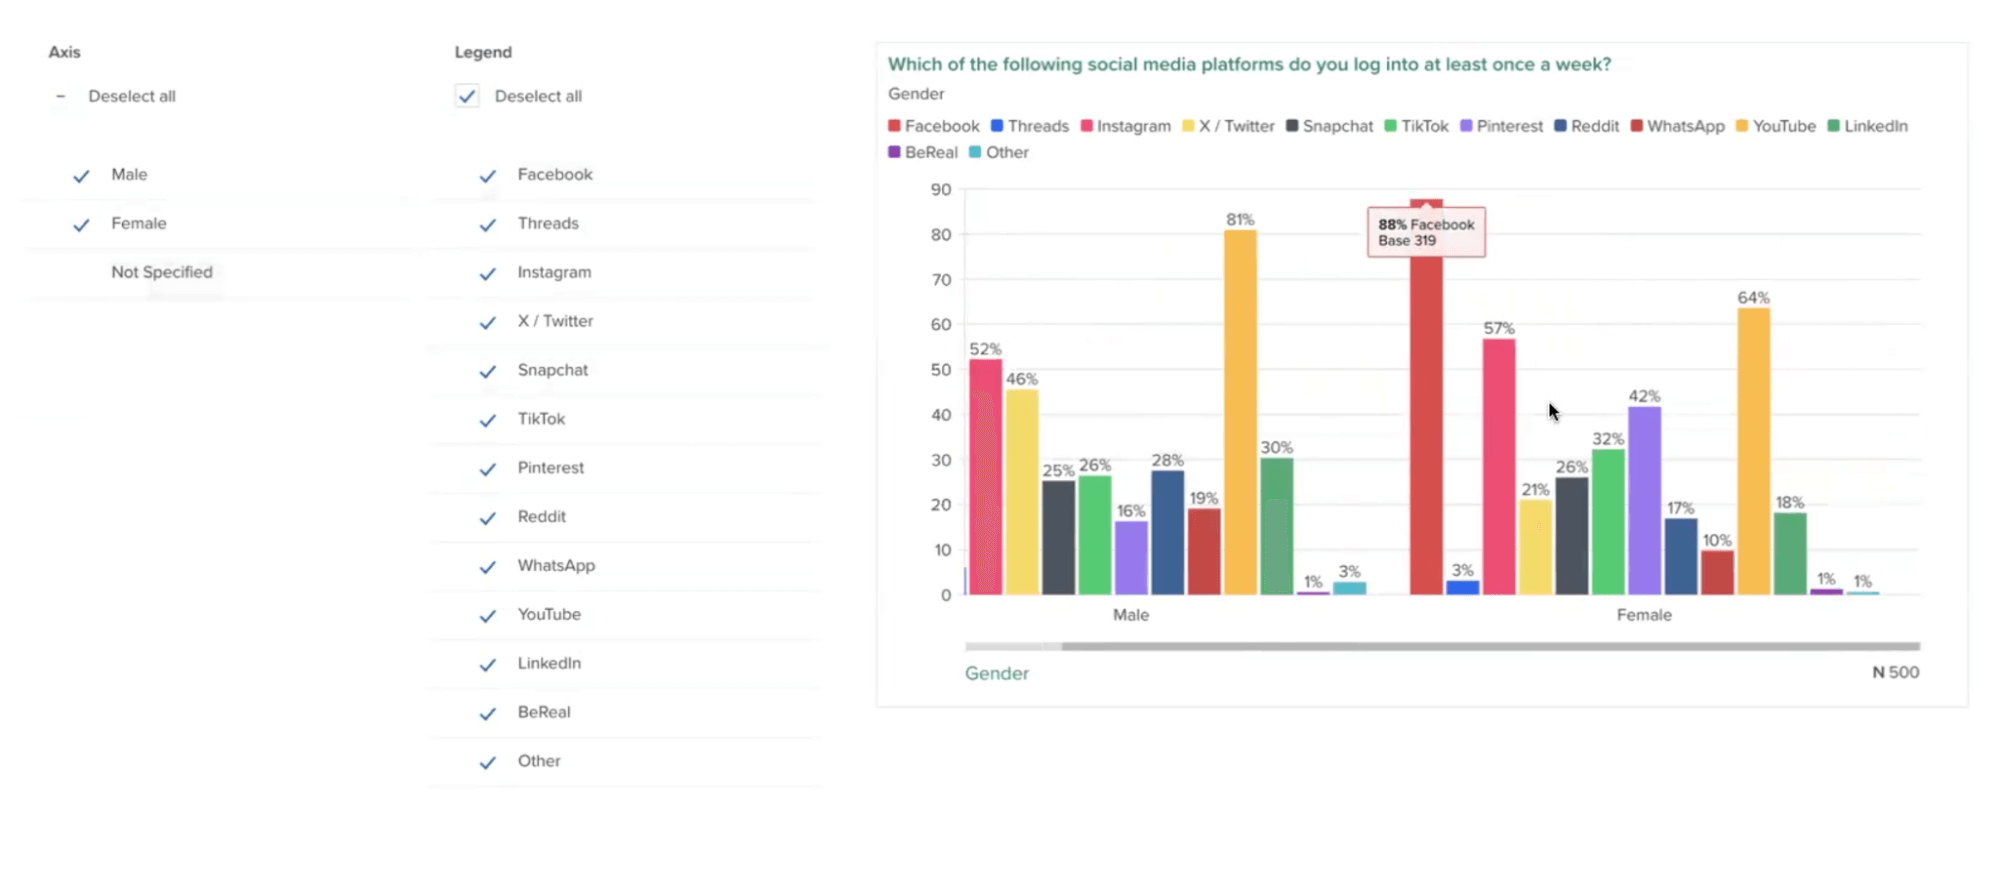
To show you just how easy it is to work with graphs in Insights Builder, let’s look at the survey question, “Which of the following social media platforms do you log into at least once a week?” (see screenshot below).
With Insights Builder, you can quickly manipulate the graph variables to suit your needs. For example, if you want to focus on the responses from males and females, but exclude the “Not Specified” gender category (which only had 3 respondents), simply deselect the “Not Specified” option on the left-hand side, and voila! The graph instantly updates to reflect your changes.
Insights Builder also offers more easily digestible charts (see screenshot below).
For example, let’s say you want to analyze the social media usage question by gender. With just a couple of clicks, you can apply the gender filter and see a beautifully clear chart that breaks down the responses by male and female:
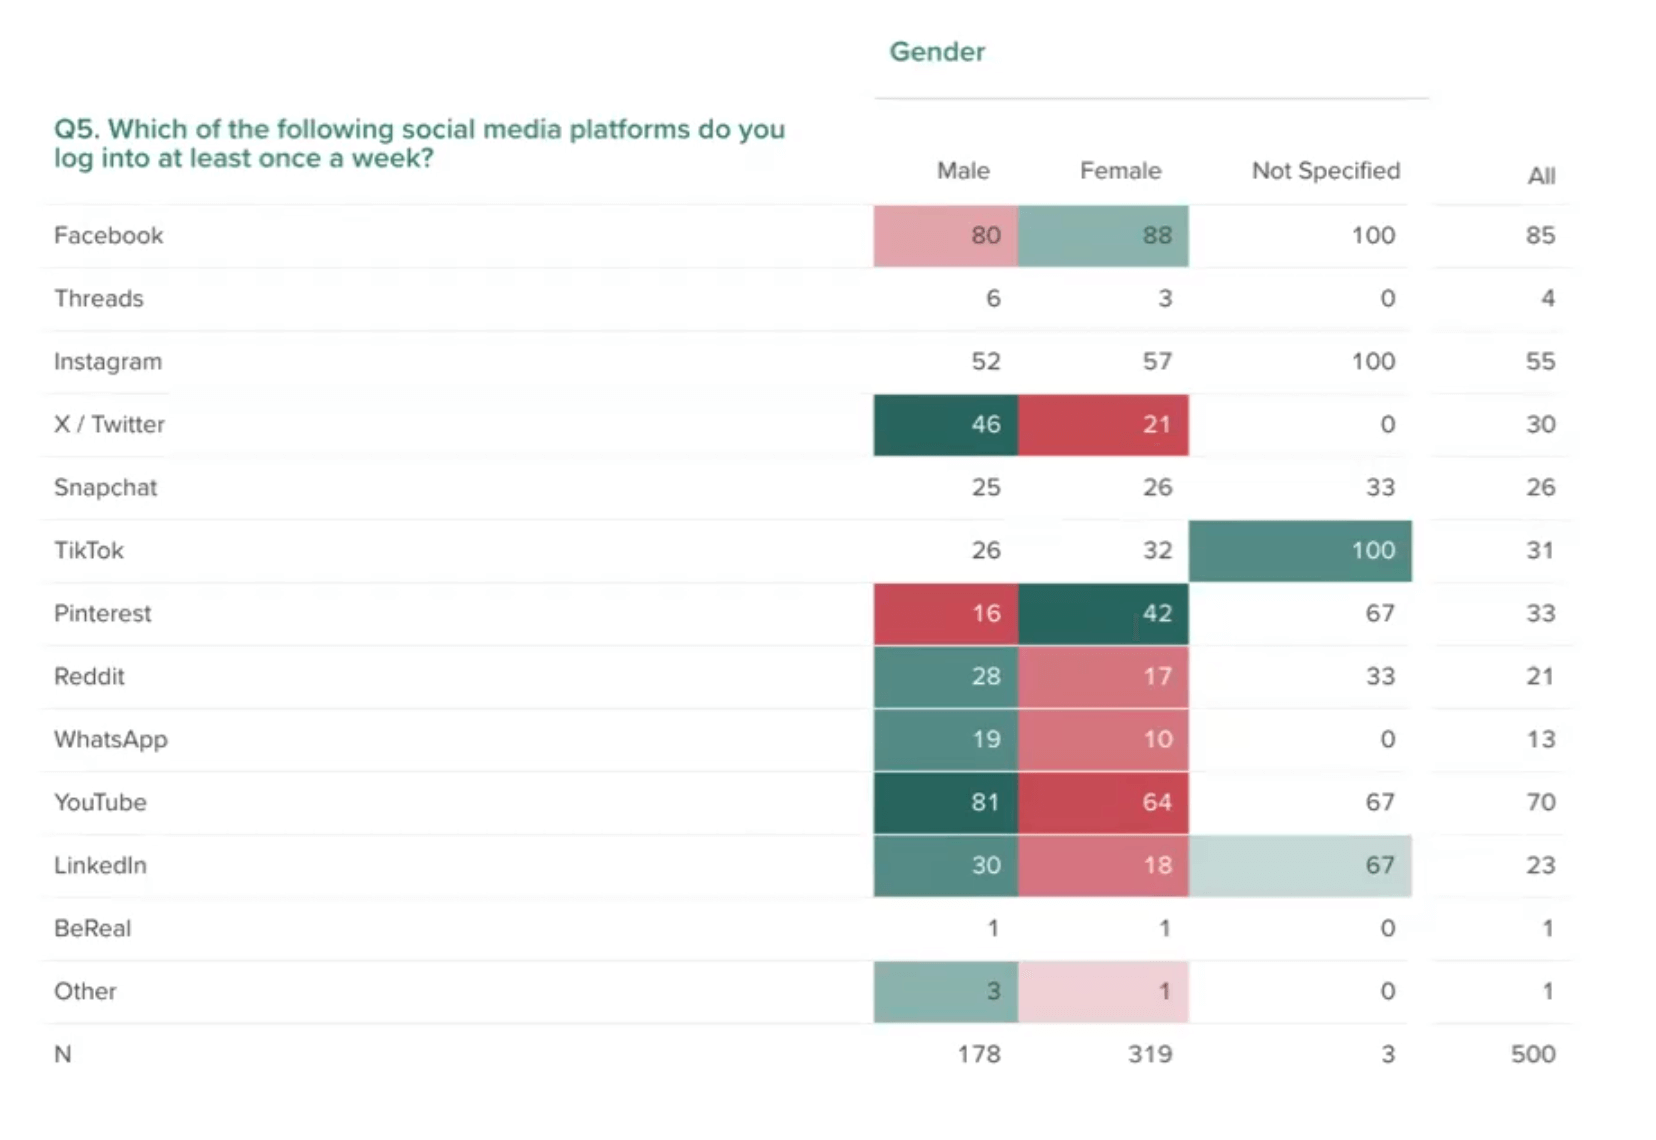
From this chart, you can easily identify that Pinterest, for example, heavily skews towards female users (along with other valuable insights).
If you want to dive deeper into the data, you can turn on stat testing to see which results are statistically significant. The darker the green, the higher the significance.
Plus, if you need to export the image, you can choose to display the results with traditional stat testing, using capital and lowercase letters to indicate significance.
But the customization doesn’t stop there. With Insights Builder, you can effortlessly apply your brand’s unique color palette to each graph, ensuring consistency and cohesion across all your visualizations. You can even upload your own PowerPoint presentation, and all your graphs will automatically adopt the design elements from your slides.
We’ve just scratched the surface of what’s possible — our dedicated Insights Builder team is here to walk you through the survey results and show you how to leverage the platform to meet your specific needs.
Export the Results (PDF, Excel, Crosstabs, SPSS)
Pollfish offers 4 versatile export options for your survey results, allowing you to analyze and present your data in the format that best suits your needs:
- Excel
- Crosstabs
- SPSS
Visit this comprehensive article to learn more about these four export options and how to make the most of them.
Beyond DIY: Pollfish’s Full-Service Solution
As we’ve mentioned, Pollfish offers a user-friendly, DIY platform that lets you easily launch surveys on your own. However, we understand that some projects may require advanced customization or functionality beyond our standard offerings. If you’re new to conducting surveys or need guidance on best practices, our full-service option is the perfect solution for you.
With our full-service option, you’ll work directly with our Insights team, who will take the time to understand your unique needs, identify the best type of research methods, and guide you through the entire process from start to finish. We act as an extension of your market research team, allowing you to focus on other essential aspects of your work while we manage the survey programming and execution.
Additional Benefits to Using Pollfish
Not only does Pollfish provide a powerful set of features and functionality, but there are also several additional benefits to choosing our platform:
Fast Survey Turnaround Time (Typically From a Few Hours to a Few Days)
A common issue raised by users of other survey platforms is the lengthy wait time for responses.
However, at Pollfish, we have cultivated consumer communities that enable us to deliver results within a few hours to a few days in most cases, setting us apart from our competitors.
The turnaround time for receiving responses varies depending on the target audience. For instance, we recently assisted a client in conducting a survey about Super Bowl commercials and gathered 500 responses within a matter of hours. However, if you’re targeting a niche group (e.g., aerospace engineers with advanced degrees in research facilities), it will take more time to gather responses than a broader audience.
If a quick turnaround is a crucial factor for your project, we encourage you to reach out to us via live chat. Our team will be happy to provide you with an estimated timeline tailored to your specific audience and requirements.
Usage-Based & Transparent Pricing (What You See Is What You Pay)
Before switching to Pollfish, users often encounter three pricing issues with competitors:
- Subscription-based pricing models, which require you to pay a significant amount each month or year, regardless of your actual usage.
- The subscription-based pricing structure also means that adding additional licenses can be costly.
- Lack of transparency, with unexpected extra charges for additional work.
Pollfish addresses these issues with a usage-based pricing model. You only pay for what you actually use, rather than being locked into a subscription. If you expect to conduct a large number of surveys, you can pay in advance and receive a discount. Additionally, you can add an unlimited number of licenses for each account.
Pollfish also provides complete transparency. Before designing your questionnaire, the platform shows the final cost per interview (CPI) for your selected audience.
For example, if the CPI is $1.50 and you need 1,000 respondents, your total cost will be $1,500 (CPI x respondents). There are no hidden fees — what you see is what you pay.
Stellar Customer Support (From Basic Inquiries to Advanced Research Guidance)
When designing surveys to align with your market research objectives, it’s natural to have questions along the way. Exceptional customer support is crucial, even more so than with other types of software.
At Pollfish, customer support is one of our greatest strengths. In fact, when people switch to us from competitors, they often cite our superior support as a key reason for their decision.
We offer live 24/7 chat support directly within the Pollfish platform, staffed by real people who understand research, not just chatbots. Whether you’re seeking help with simple feature inquiries or need guidance on research best practices and survey design to ensure data reliability, we’re here to assist.
Interested in Learning More?
For more information, we invite you to visit our site and create a free account.
We also encourage you to book a demo call with our team, where we can discuss your specific needs and provide personalized recommendations on how to get the most out of Pollfish.
2. Qualtrics
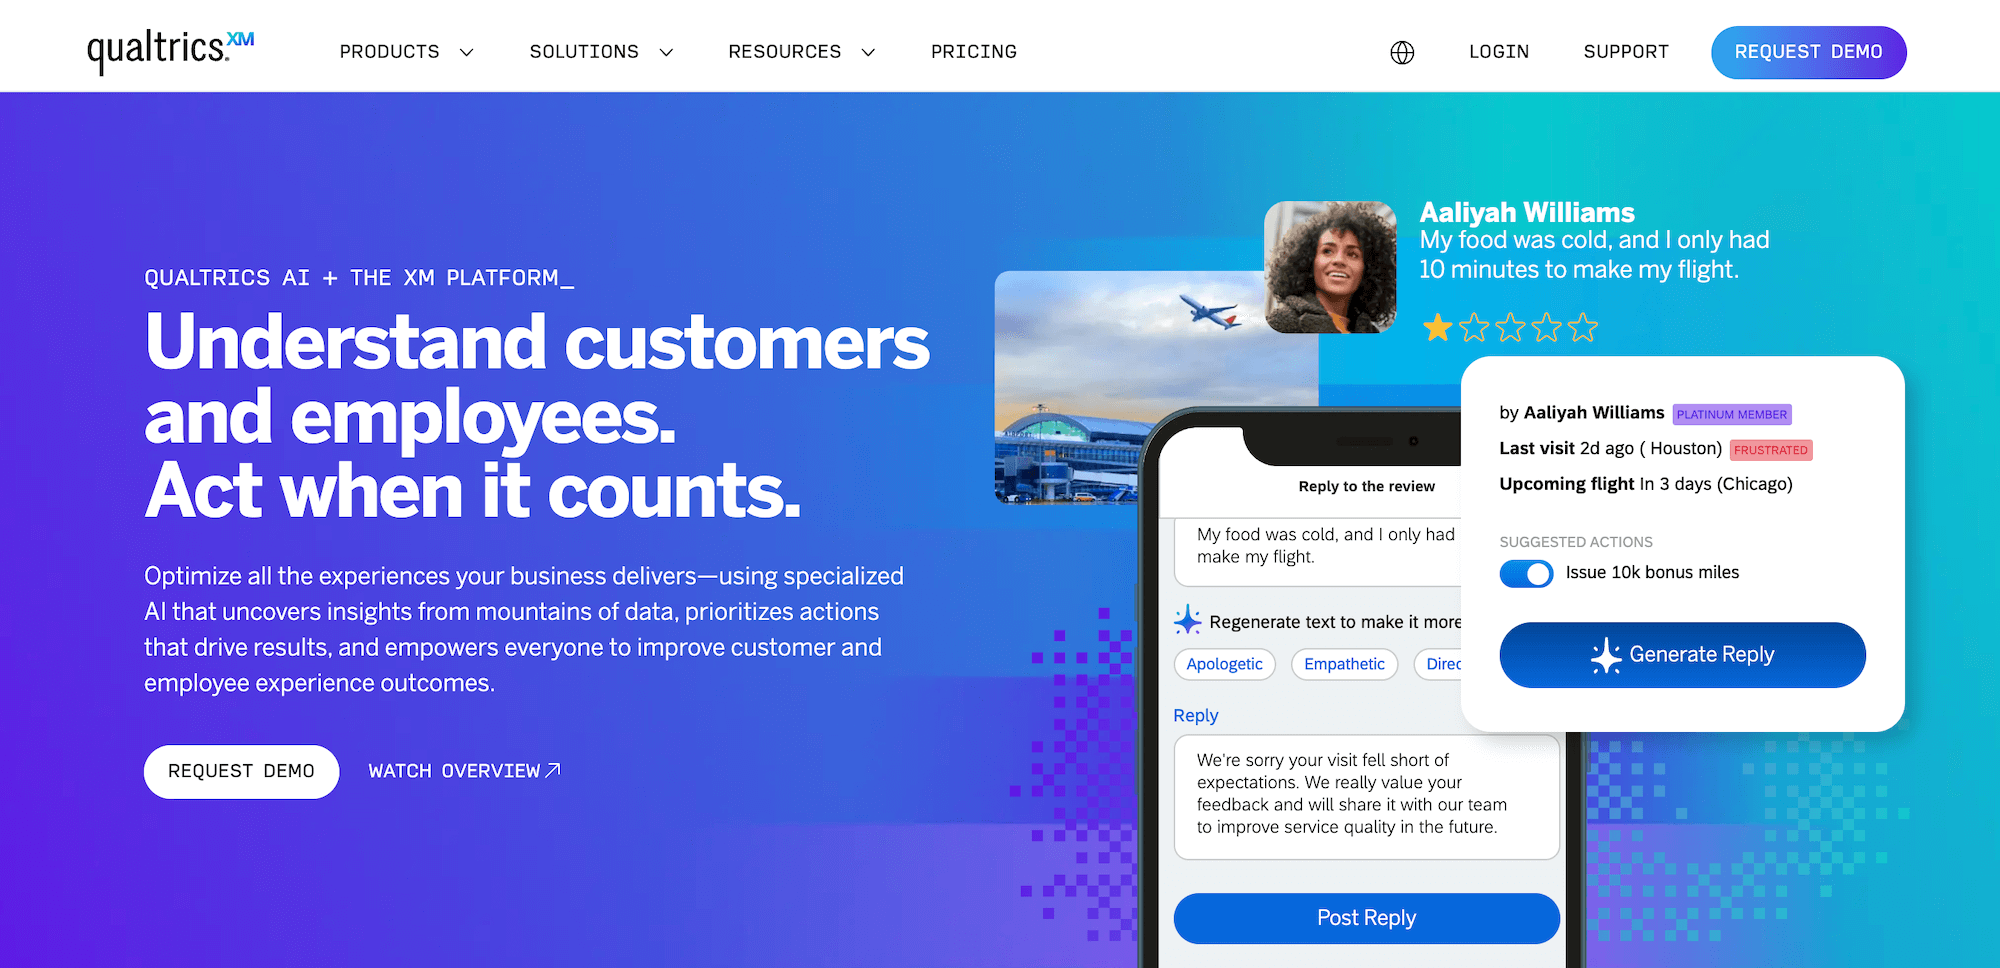
Qualtrics is a market research platform that provides an extensive array of features. Surveys are one of its core strengths, providing users with:
- Ability to reach respondents through various channels like email, social media, websites, and SMS.
- Drag-and-drop interface for creating advanced surveys.
- Different question types and logic.
Beyond surveys, some of Qualtrics’ popular use cases include Brand Tracking, Website & App Feedback, Customer Analytics, NPS Software, Pulse Surveys, and more.
For a more detailed comparison between Pollfish and Qualtrics, see our post on the best Qualtrics competitors.
3. Suzy
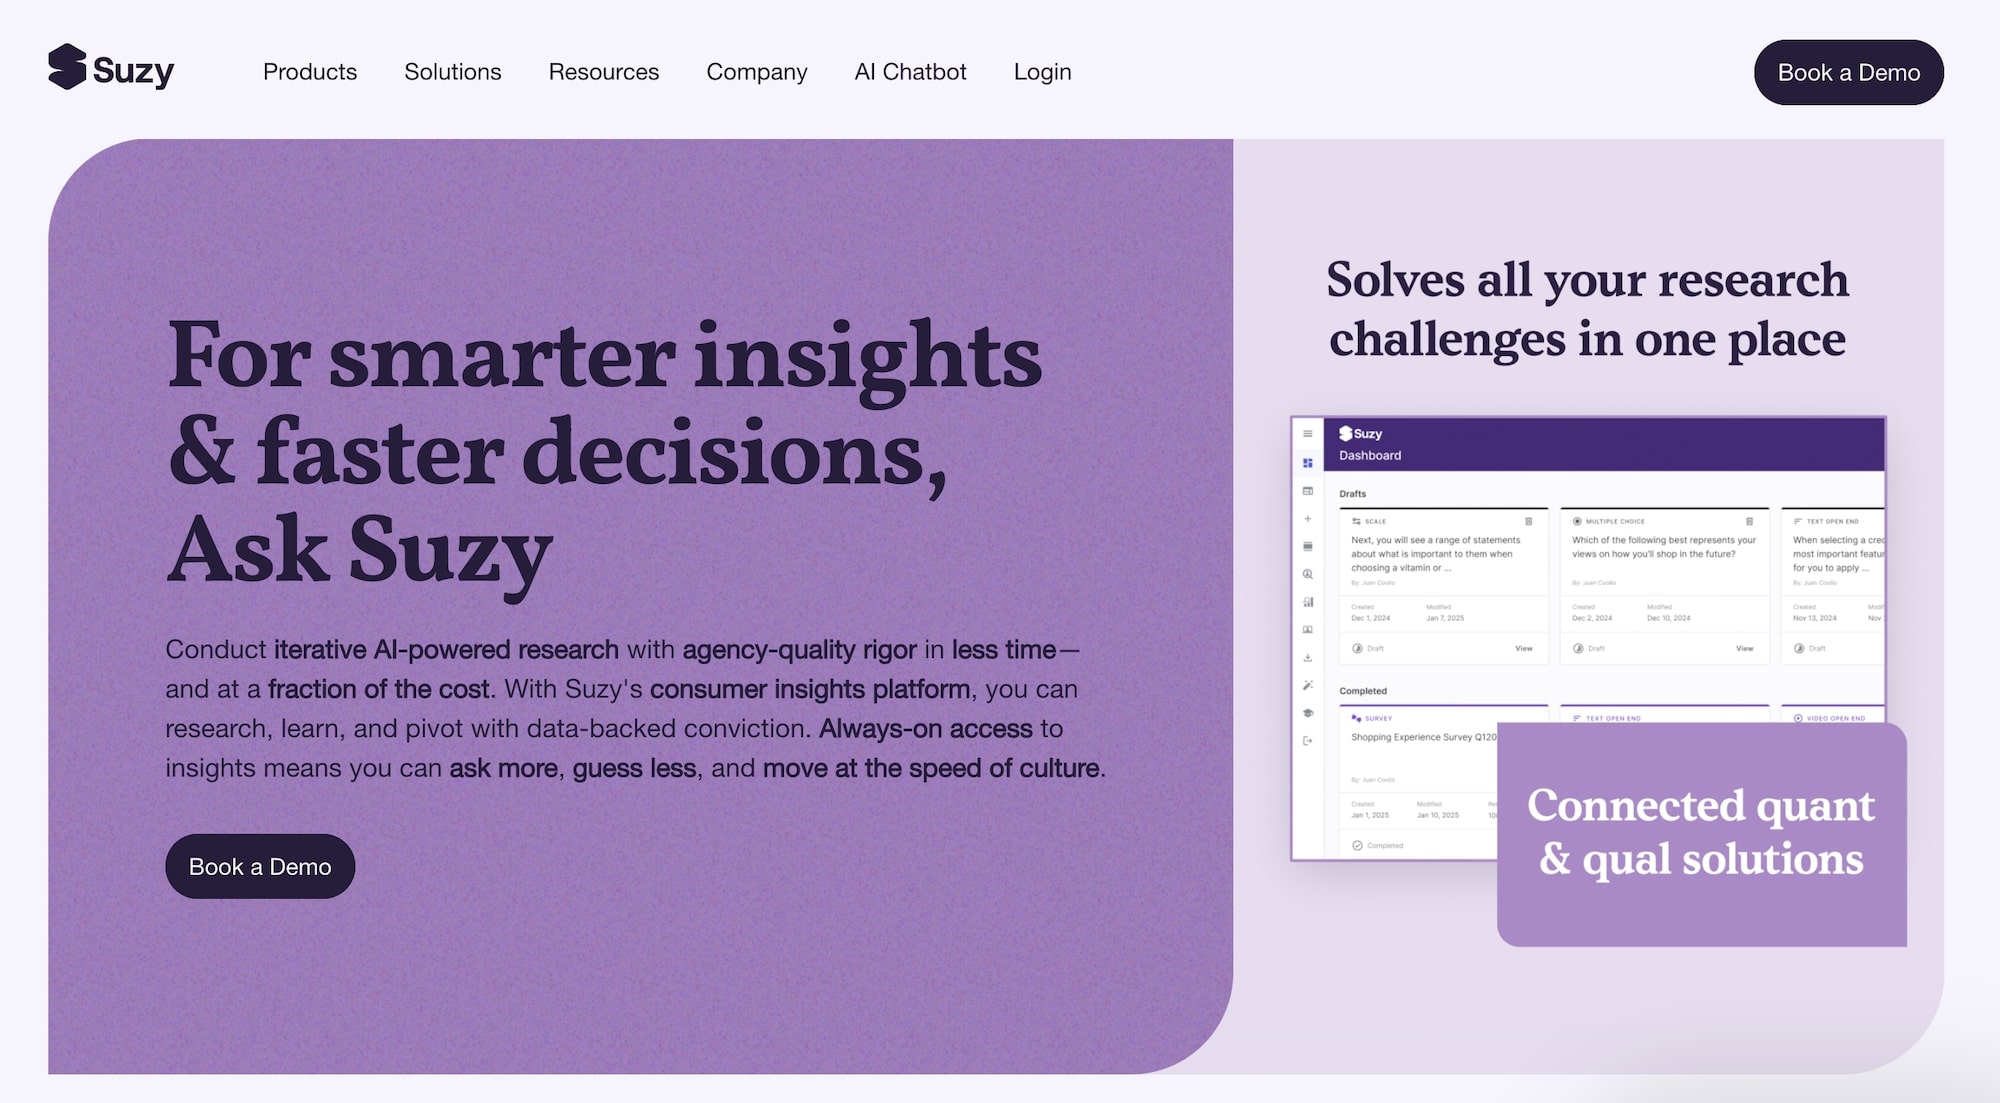
Suzy is one of the best market research tools on the market, and they offer a range of powerful features and benefits. Here are some of the key advantages of using Suzy for your market research needs:
- Conduct AI-powered surveys quickly and cost-effectively.
- Access a panel of consumers to gather insights, test concepts, and make data-driven decisions.
- Pay per question, rather than per response.
- Receive help from experienced researchers.
For a more detailed comparison between Pollfish and Suzy, see our post on the best Suzy competitors.
4. SurveyMonkey
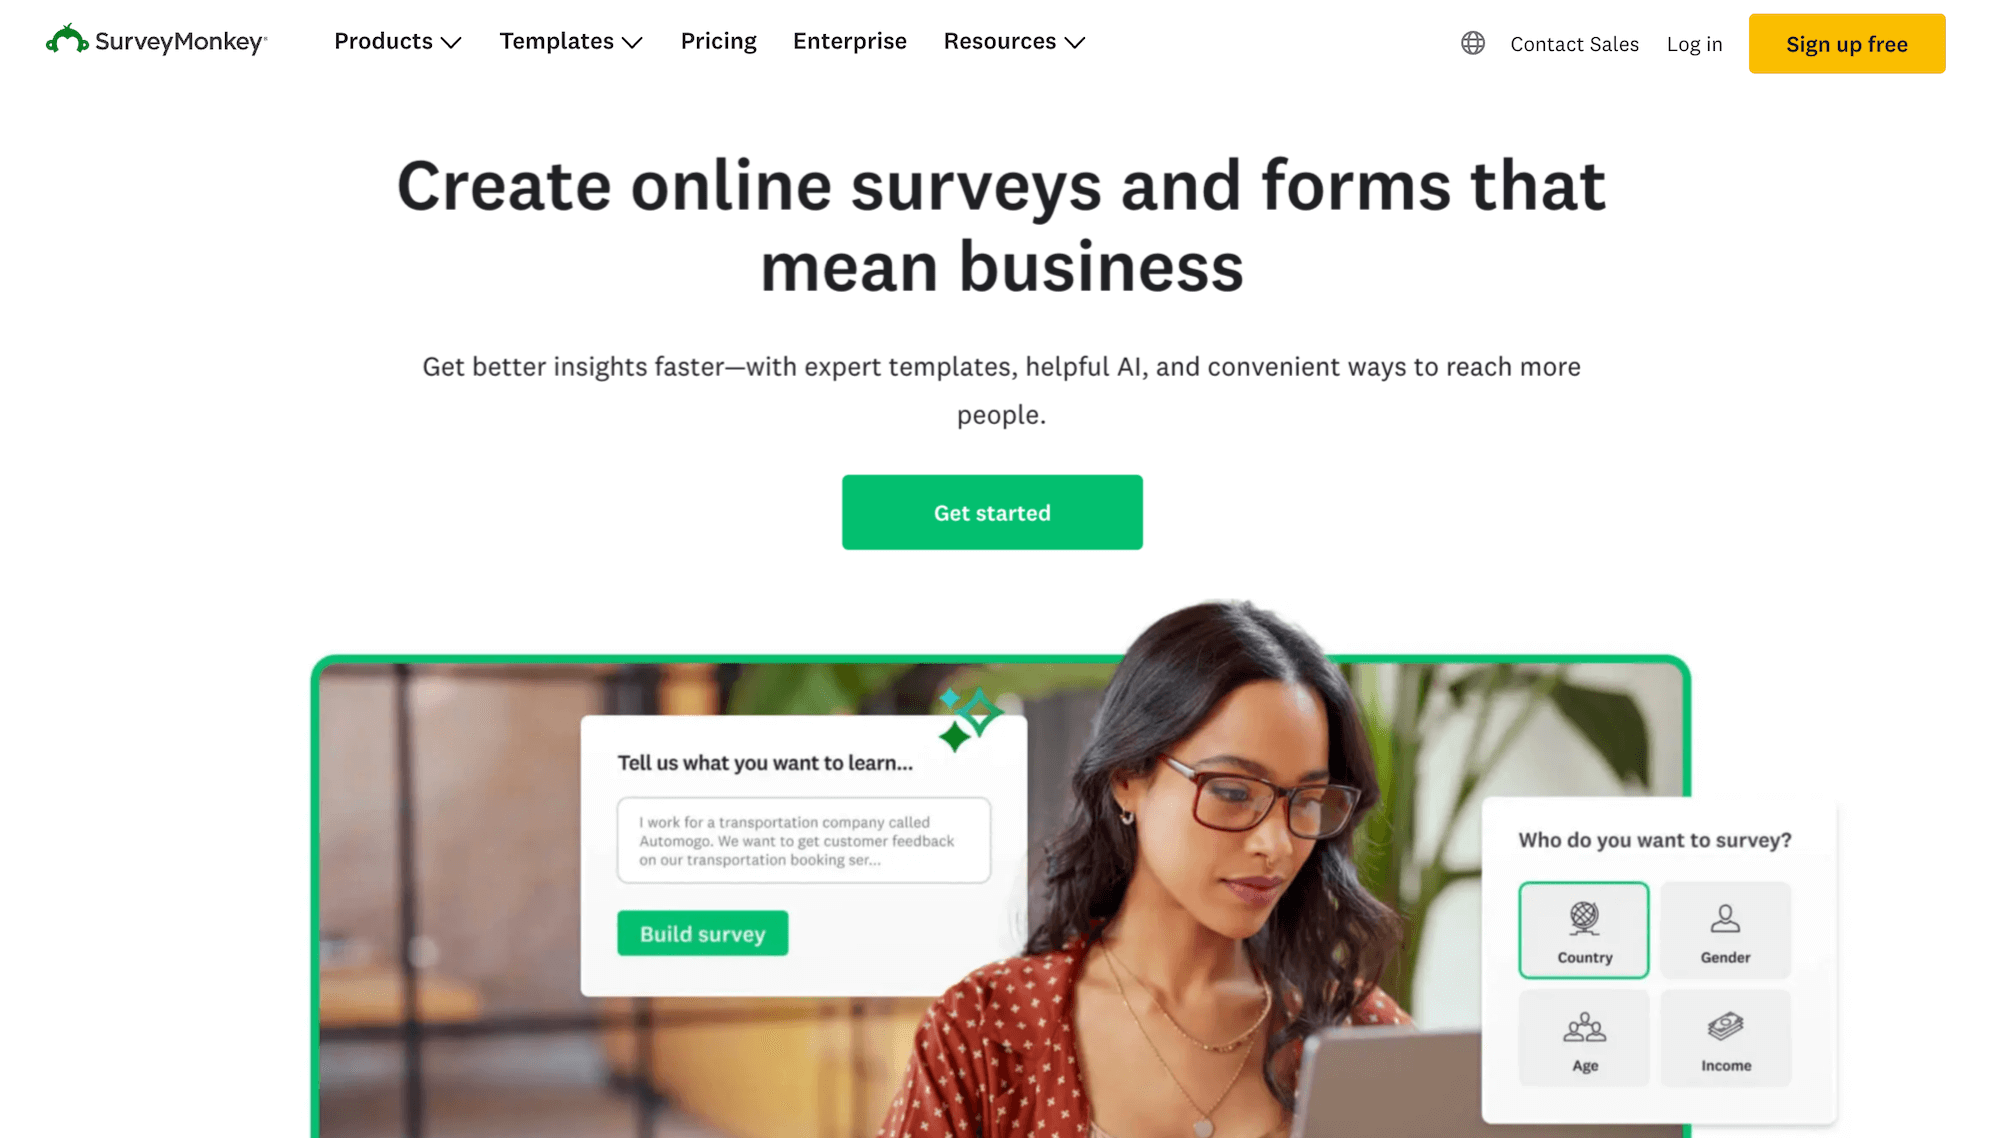
SurveyMonkey is a widely-used market research tool, with surveys being one of its core features. Consider these main benefits when choosing SurveyMonkey for your market research needs:
- Choose from over 400+ survey templates or create your own survey.
- Use AI to quickly build your survey.
- Employ advanced skip logic and branching.
- Reach respondents both online and offline via email, web links, social media, SMS, website embeds, QR code, and kiosks.
- Schedule recurring surveys.
- Visualize insights via custom dashboard, charts, word clouds, and more.
Focus Groups & Interview Tools (Qualitative Market Research)
So far, we’ve discussed widely used market research survey tools. In the following segment, we’ll explore software that can help your qualitative research efforts, such as facilitating focus groups and conducting interviews.
5. itracks
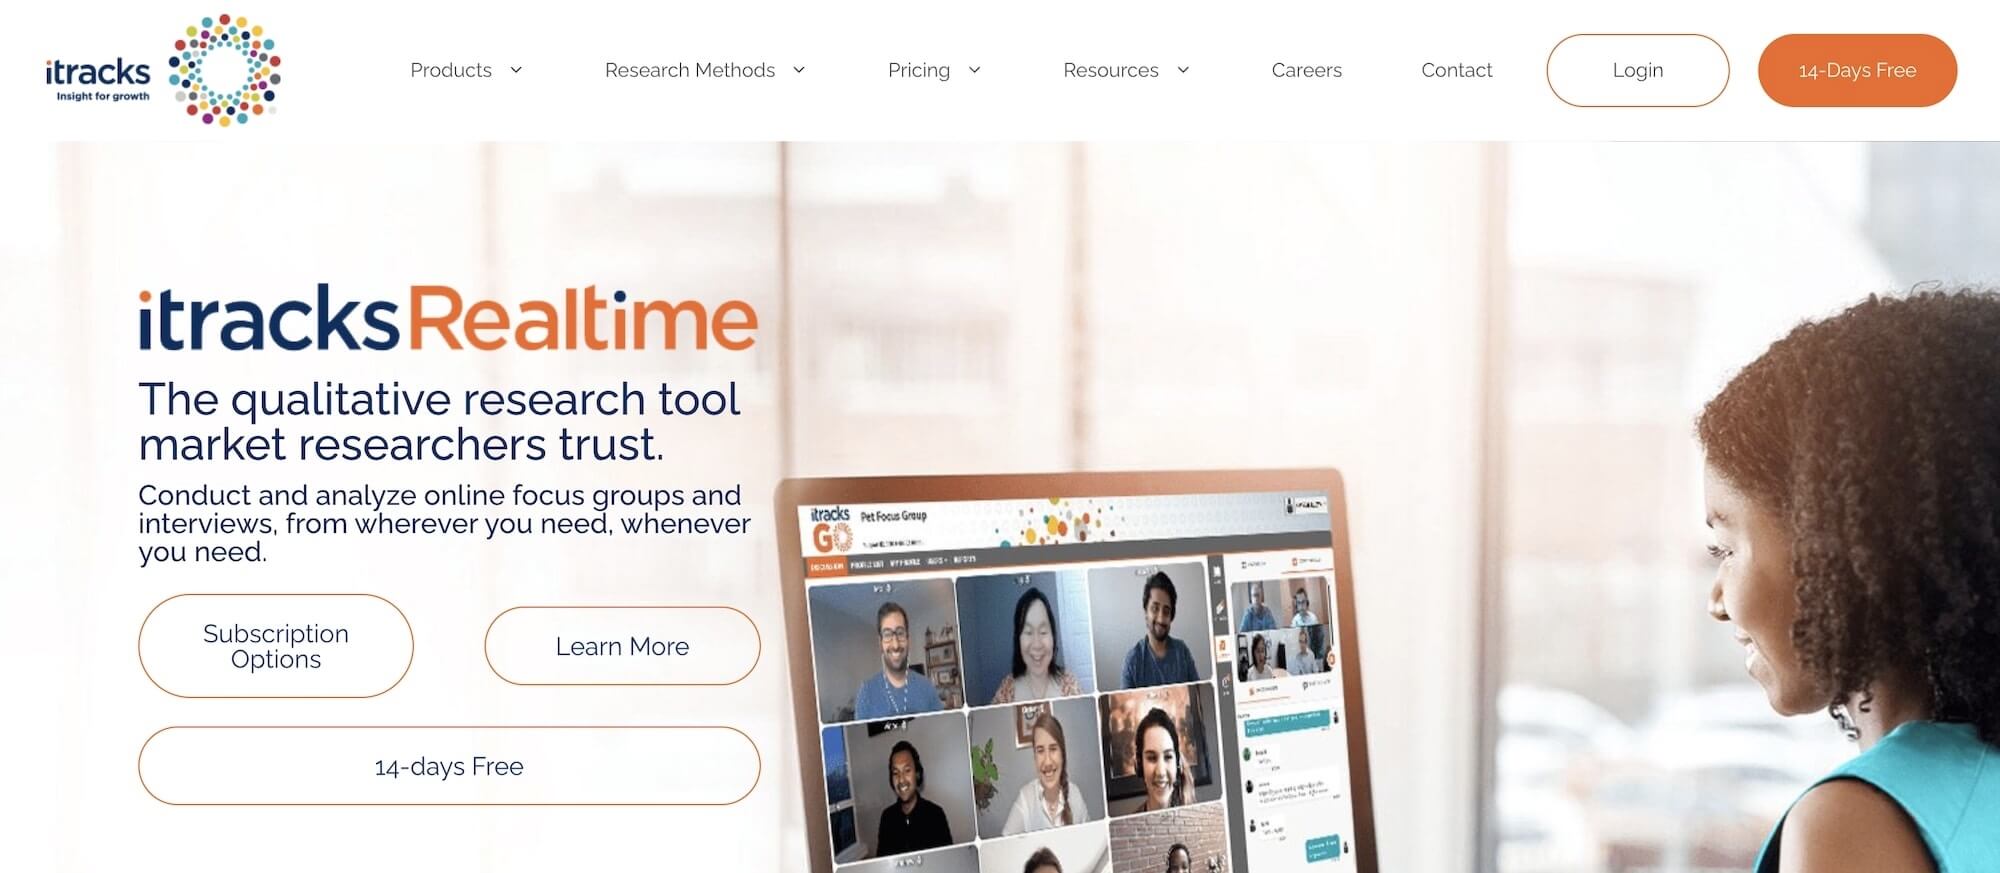
itracks is one of the best qualitative market research tools on the market. Here are some of the key advantages of using itracks for your market research needs:
- Easily conduct interviews, video focus groups, text groups, and more.
- Participants, Observers, and Moderators each have their own easy to use interface.
- You can easily create subgroups and segmented reporting.
- It integrates with the majority of survey platforms and research panels.
6. FOCUS by MarketResponse
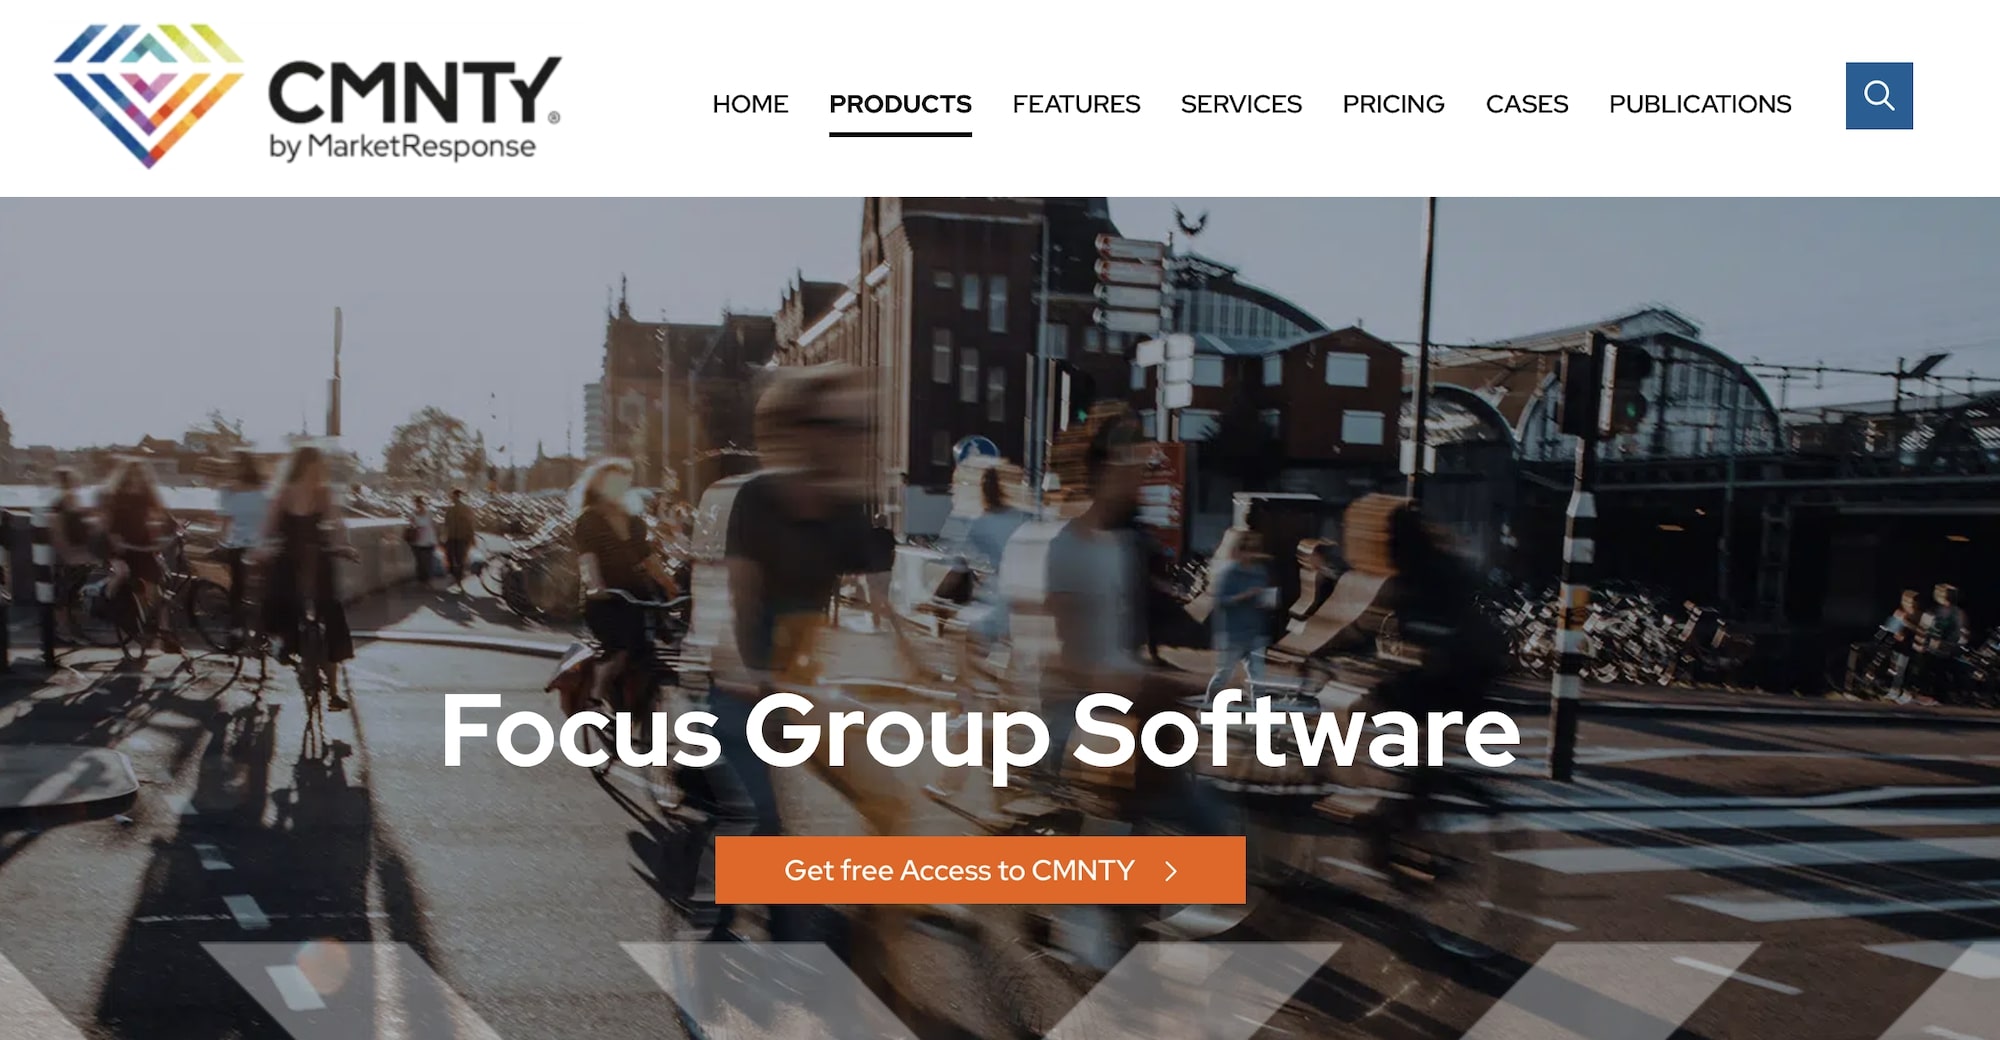
FOCUS by MarketResponse is another great market research tool that makes it easier to run qualitative research via focus groups and interviews. Here are some of its key advantages:
- When conducting panel discussions or interviews, you can highlight notable responses, download them as individual segments, and create a video compilation.
- You can utilize whiteboard, polls, visuals, videos and chats, backroom chat, automated transcription and analysis.
- You can integrate this software with several other survey solutions.
Data Aggregator Tools for Market Research
In the next segment, we’ll explore data aggregator tools that offer extensive statistics across various topics. Although the audience targeting might not be as precise as your requirements, when assembling research reports, you may find useful data within these tools that can be incorporated into your presentation (and bolster your arguments).
7. Statista
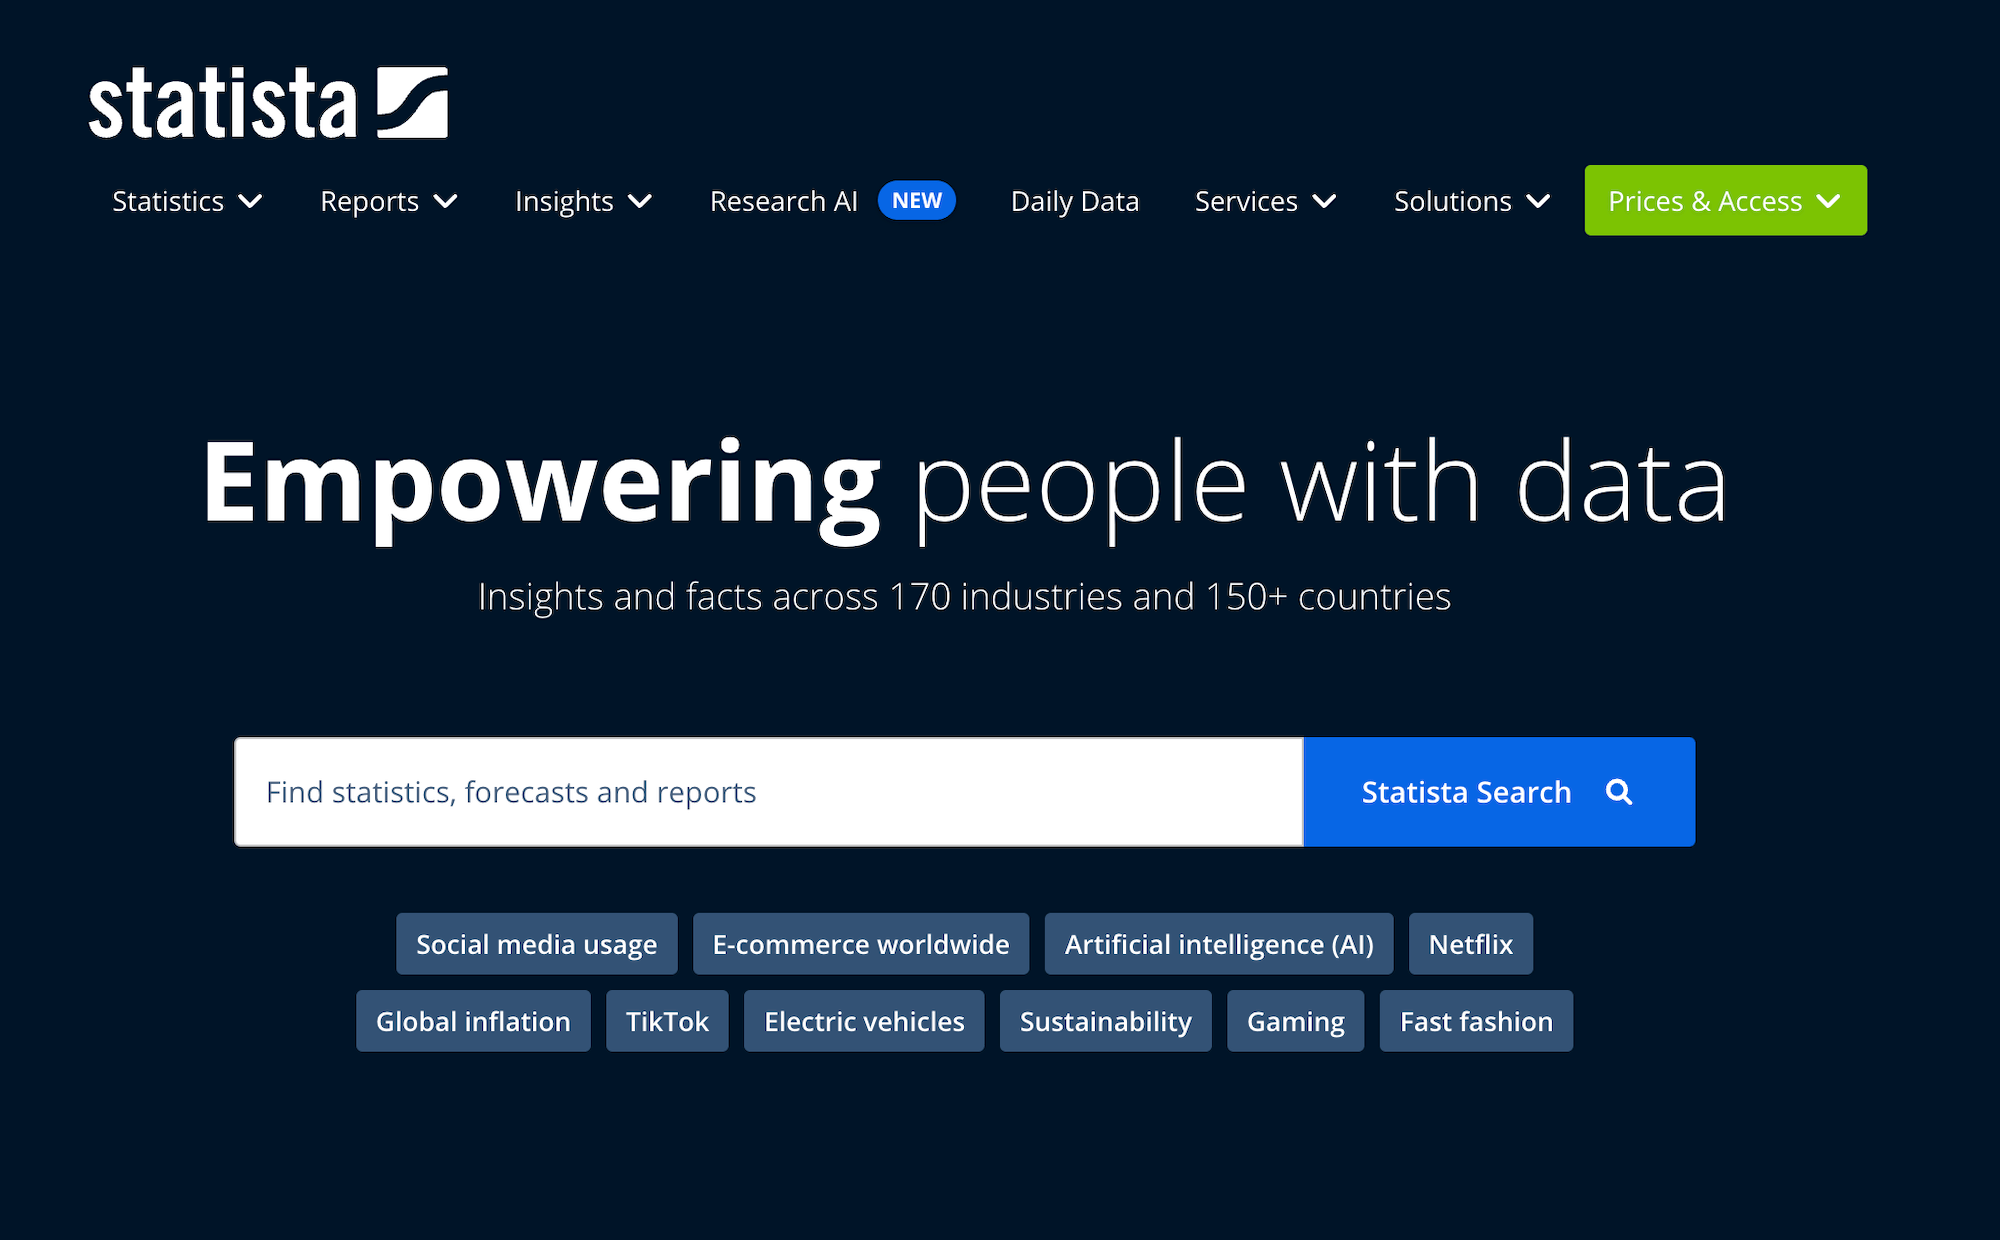
Statista is one of the most popular data aggregator tools in the market, and can be an excellent addition to your market research efforts.
Here are some of the key advantages of using Statista:
- There are statistics spanning 170 industries and 150+ countries.
- Among the most popular industries for which they offer statistics on include Consumer Goods & FMCG, e-Commerce, Economy & Politics, Energy & Environment, Internet, Technology & Communications, Transportation & Logistics, Tourism & Hospitality, and more.
- Gain insight on revenue metrics, key performance indicators, and much more.
- You can also take advantage of their full-service market research and analytics services.
8. U.S. Census Bureau
The U.S. Census Bureau can be a great tool for conducting market research, and it’s great for large and small businesses. Here are some of its key advantages:
- You get access to a wide array of filters, including geographic, topical, and more. You can choose the appropriate filters to generate tables and maps that align with your research goals
- Certain datasets can be accessed through an API.
- Some of the more popular topics the U.S. Census Bureau covers are Age, Sex, Business, Economy, Education, Emergency Management, Disasters, Employment, Families, Living Arrangements, Housing, Income, and the list goes on.
Social Media Sentiment Tools for Market Research
In the next segment, we’ll explore social media sentiment tools that can help you track mentions related to your brand, a competitor, or a specific topic. Anonymity on social media can often lead to more candid and unfiltered feedback compared to traditional qualitative research methods like focus groups or interviews.
9. BrandMentions
BrandMentions is a great platform that can help with market research. You can monitor everything that’s said about your brand (e.g., via mentions, hashtags, etc.) on the social media channels that matter, and easily identify overall sentiment. Also, besides brand monitoring, some of its key features and use cases include:
- Reputation Management
- Competitor Spying
- Media Monitoring
- Business Intelligence
10. Forsta
For this section, we will focus solely on the social listening capabilities of Forsta.
However, note that Forsta is an all-around market and consumer insights software that offers a wide array of other features beneficial to market researchers (including surveys, online focus groups, and more).
Here are some of Forsta’s key social listening advantages:
- Examine reviews from various platforms (e.g., Google, Facebook, and Yelp)
- Input your own social data for comprehensive text analysis.
- Easily track posts that refer to your brand (or any other topic) on social networks, blogs, forums, video platforms, and news outlets.
- Make sense of the data via powerful analytics tools.
Data Visualization Tools for Market Research
In the next segment, we’ll explore data visualization tools that can help you take raw, complex market research data, and turn it into more easily understandable visuals (e.g., graphs, charts, etc.), so it’s easier to identify the answers you need.
11. Tableau
Tableau is a widely used data visualization platform that simplifies the process of creating advanced graphs and other visualizations from your market research data. Here are some of its key advantages:
- You can easily create visualizations (e.g., charts, graphs, maps, etc.) via drag and drop functionality, and you don’t need to be a coder.
- You can perform advanced data analysis via forecasting, correlation detection, and much more.
- Tableau easily integrates with spreadsheets and a wide array of software.
12. Google Charts
While Google Charts may not be as feature-rich as Tableau, it is a free market research tool that can still provide sufficient functionality to meet your data visualization needs. Here are some of its key advantages:
- You can create various types of charts, from simple scatter plots to advanced hierarchical treemaps, and more.
- You can customize the charts to match your brand’s design, and there’s a great user experience.
- You can integrate Google Charts with a wide range of tools, so it integrates with your workflow.
- It’s completely free to use.
Note that Google also offers other free tools that can help with market research, such as Google Trends (which lets you analyze various market trends in real-time).
Competitor Research Tools for Market Research
In the next segment, we’ll explore software that can help you analyze competitors’ marketing campaigns (e.g., what are their best performing social media posts, blog posts, and so on).
13. BuzzSumo
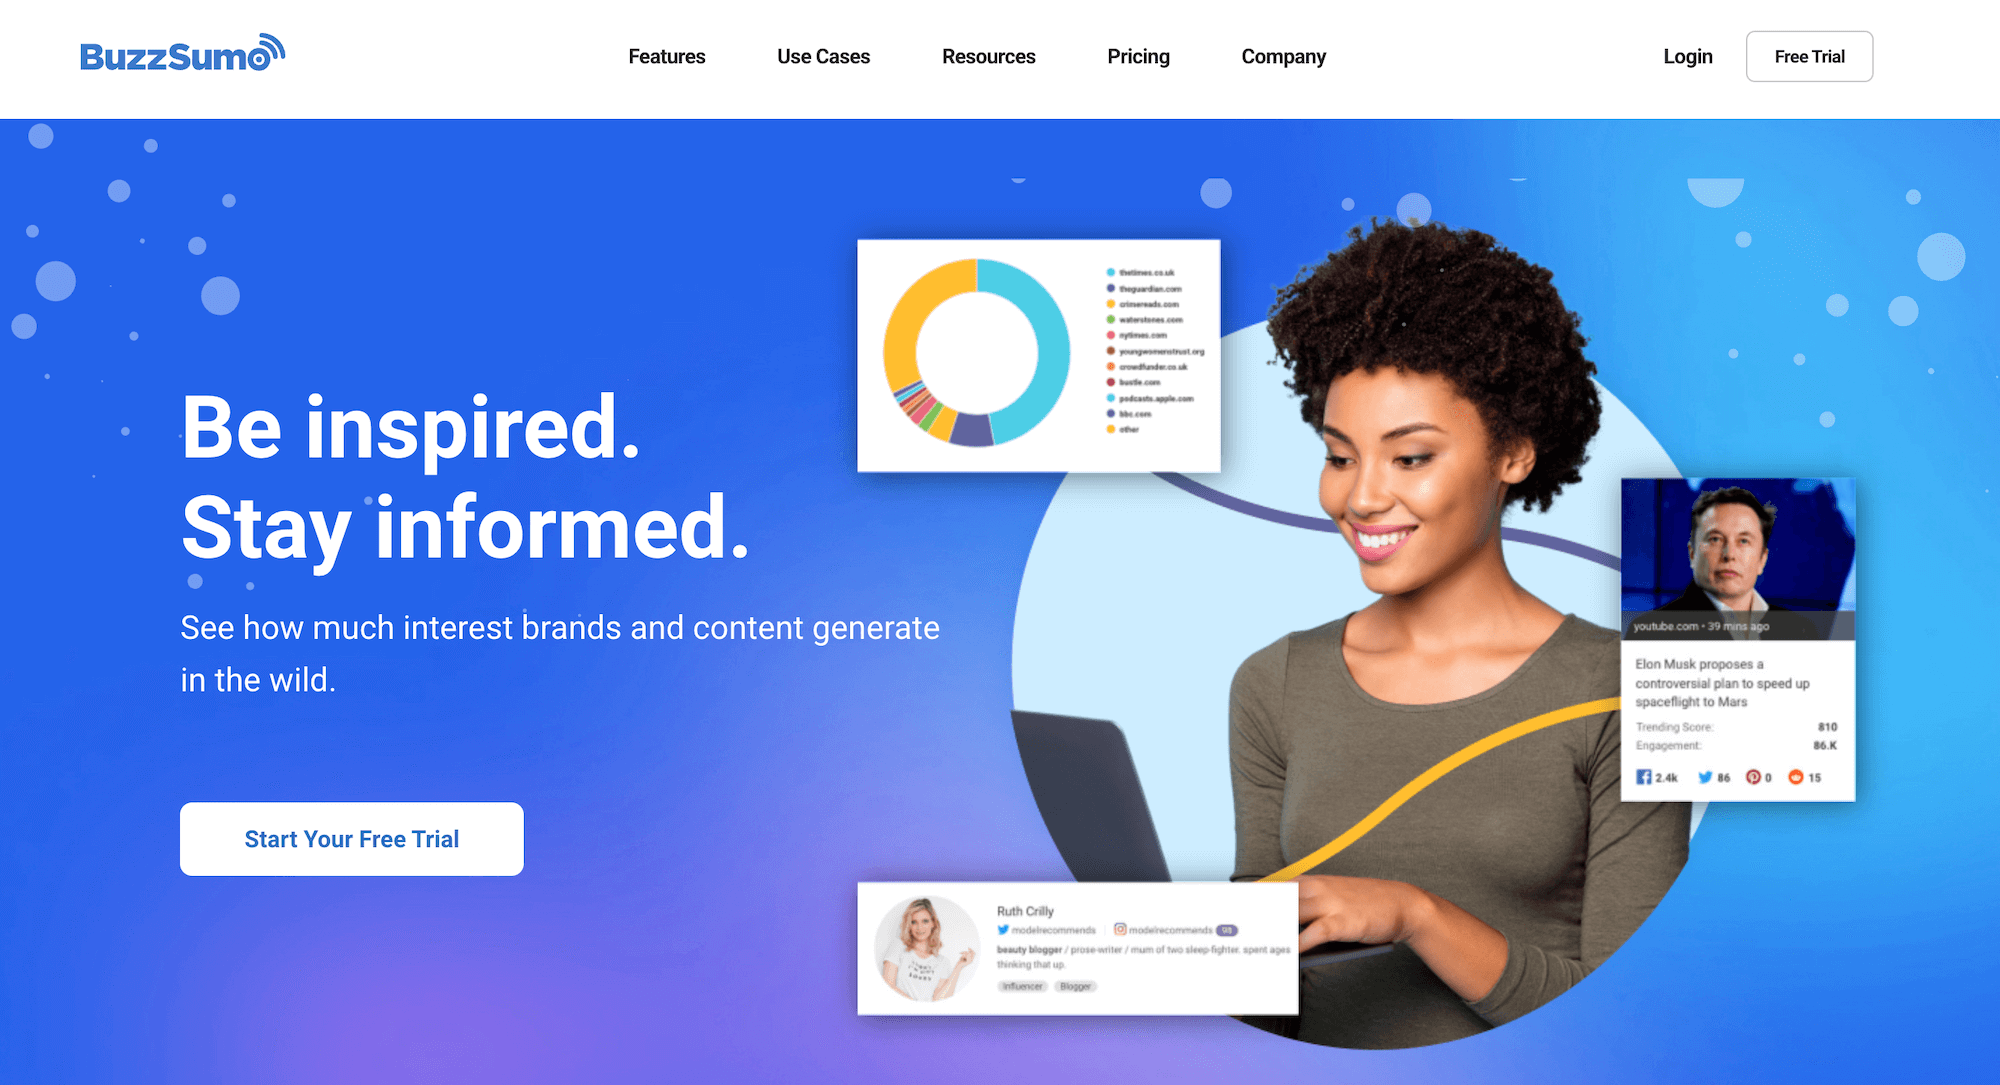
BuzzSumo is a great competitor research tool that offers several advantages:
- Determine which of your competitors’ content pieces have received the highest number of shares on social media platforms (e.g., most shares on Facebook, Reddit, X/Twitter, etc.), providing valuable insights into what type of content resonates with your target market.
- Create alerts for each time your competitors publish on social media or publish a blog post (e.g., this can be useful to see which features they are releasing, how they’re positioning their product, etc.), which may spark new ideas for you to test.
14. Ubersuggest
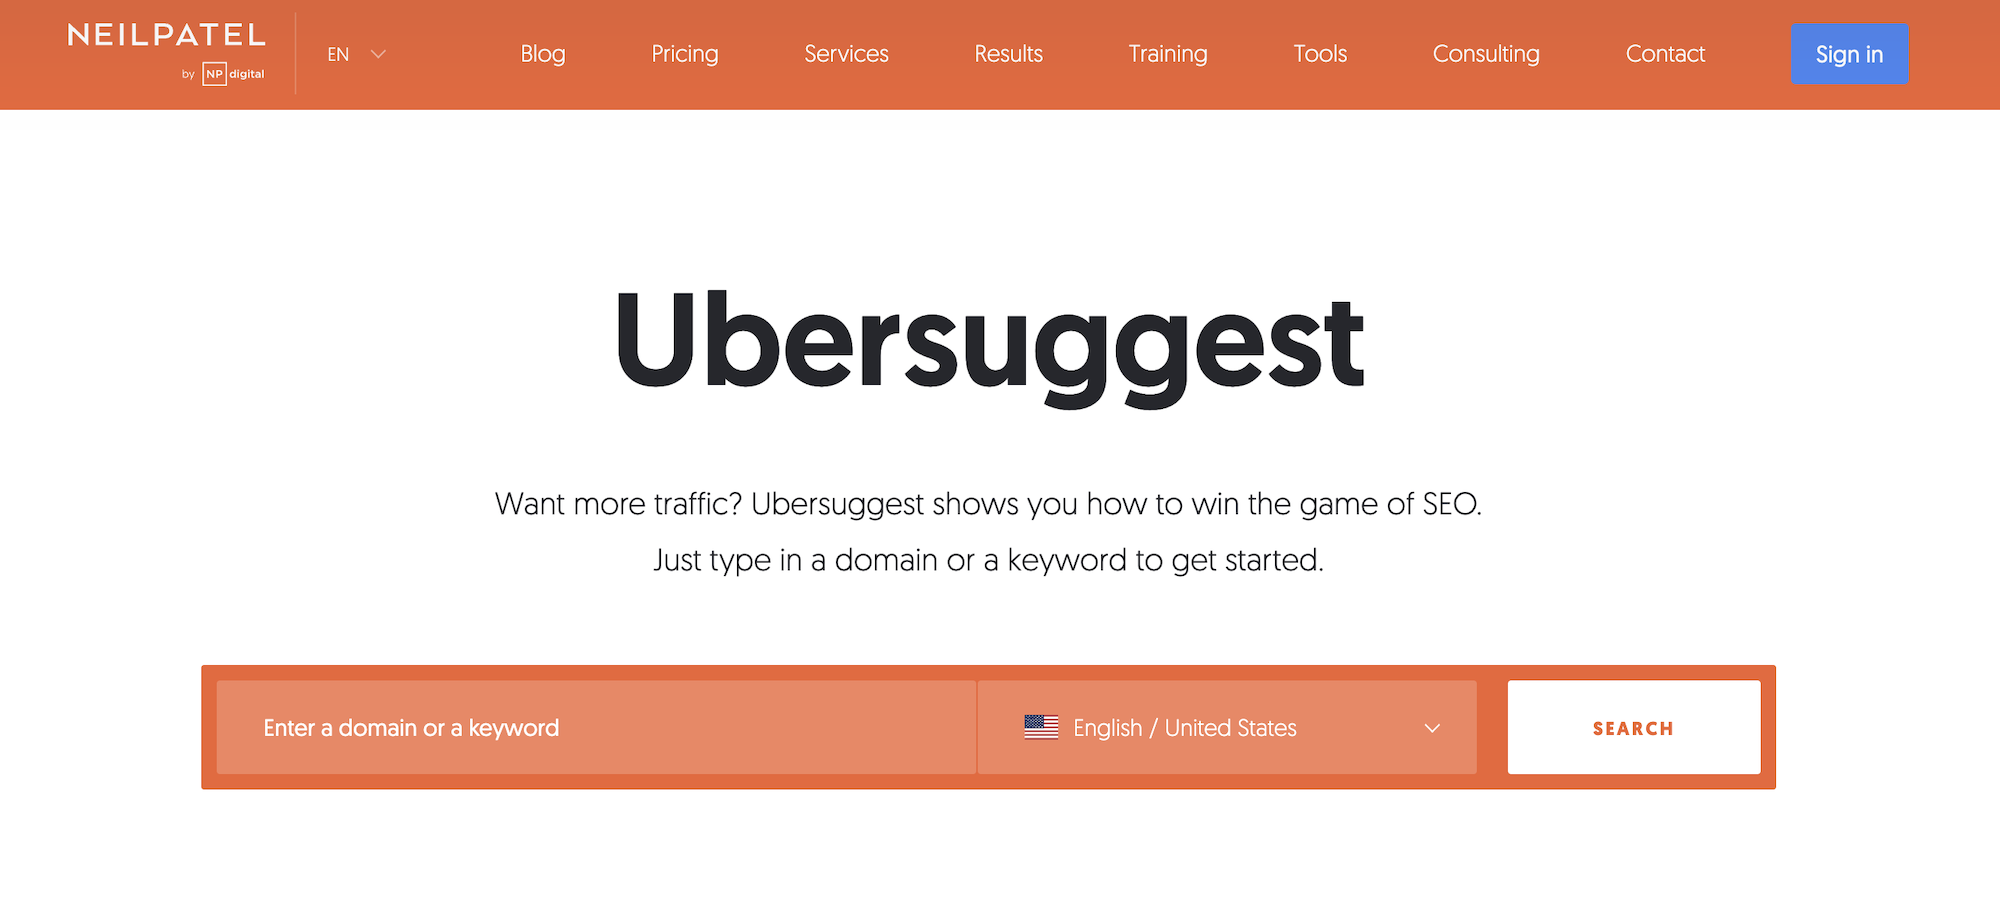
While Ubersuggest offers various features (which we’ll cover below), one of its primary applications is conducting organic keyword research for market analysis. For instance, if you are contemplating the launch of a new product line (e.g., such as red running shoes), you can input that phrase into Ubersuggest.
The tool will then provide you with valuable insights, including the average monthly search volume for that keyword on Google, and an assessment of the competitors that are ranking for that phrase (e.g., how strong is their site profile, how does your website compare, etc.)
Some of Ubersuggest’s other features include:
- Competitive analysis of similar websites (e.g., enter your competitor’s domains, and explore which SEO keywords they are ranking for on Google).
- Keyword visualization (e.g., enter a seed keyword and receive suggestions for related phrases, which you can explore via visually appealing graphics).
Interested in Learning More About Pollfish?
For more information, we invite you to visit our site and create a free account.
We also encourage you to book a demo call with our team, where we can discuss your specific needs and provide personalized recommendations on how to get the most out of Pollfish.