6 Best Suzy Competitors & Alternatives in 2025 (Key Factors)

Suzy is a popular market research platform, earning positive reviews on sites like G2. However, some users have reported challenges in certain areas:
🚫 The audience isn’t always diverse enough, making it hard to reach specific groups.
Several reviewers have mentioned that the sample can skew more heavily towards females and millennials, falling short when it comes to Gen Z, males, various ethnic groups, and other key demographics.
🚫 Some users have expressed difficulty trusting the survey data.
Without a clear understanding of where respondents come from and how they are vetted, some users have doubts about the accuracy and reliability of their survey answers.
🚫 Pricing can be restrictive for many companies.
Suzy uses a subscription-based pricing structure where costs are determined by the volume of questions asked. For many companies, a pay-per-response pricing model could be more economical and better suited to their needs compared to Suzy’s approach.
🚫 Some users feel Suzy’s built-in data analysis features are limiting.
In some cases, users find themselves having to export the data to external tools like Google Sheets in order to parse it by the specific metrics they require.
Based on the above feedback and drawing from our first-hand experience helping companies transition from Suzy to our survey platform, we’ve put together this comprehensive overview. First, we’ll present our solution, Pollfish, and then delve into other Suzy alternatives.
Best Suzy Competitors & Alternatives
1. Pollfish
Pollfish, our survey-focused DIY platform for market research, is a popular alternative to Suzy for several reasons:
✅ Diverse respondent pool for reaching broad and niche audiences.
Through our parent company, Prodege (a renowned market research giant and the largest single panel owner in the world), you’ll gain access to over 100 million respondents. This vast pool allows you to target any demographic you need, whether it’s specific age groups, gender, ethnicities, or other criteria. Additionally, you can target based on behavioral filters (such as products purchased, stores visited, etc.), as we’ll cover in more detail.
✅ Rigorous audience quality control for reliable data.
We employ several strict processes to ensure the integrity of your survey responses. These include a thorough 30-day evaluation period for new panelists, assigning trust scores to each respondent based on the quality of their answers, among other measures. We’ll provide a detailed breakdown of how these processes work. By being transparent about our audience quality control measures, we aim to give you complete confidence in the insights you gather through our platform.
✅ Transparent pay-per-response pricing model.
At Pollfish, we charge a flat fee per response, starting at $0.95 each, with discounts available for high-volume users. Our pricing is completely transparent — you can see the total cost update in real-time as you build your survey. There are no additional costs, such as subscription fees, base charges, or hidden fees, making the per-response price the only expense you’ll incur. This transparency allows you to plan your research budget effectively and confidently.
✅ Advanced built-in data analysis functionality.
Effortlessly segment your data using multiple variables and create custom-branded charts and graphs, all without ever leaving Pollfish. You’ll save a significant amount of time and effort by eliminating the need to export data to spreadsheets or other external tools for analysis.
Up next, we’ll explore each of these areas in more depth.
Diverse Respondent Pool for Reaching Broad and Niche Audiences
As we’ve mentioned, Pollfish, powered by our parent company Prodege (the world’s largest single-panel owner), offers access to an exceptionally vast pool of over 100 million respondents across 125+ countries. This extensive reach ensures you can effectively target even traditionally hard-to-reach groups, such as Gen Z, males, particular ethnic groups, and others, without limitations.
What sets Pollfish apart is not just the sheer size of our respondent pool, but also the wide range of targeting options available:
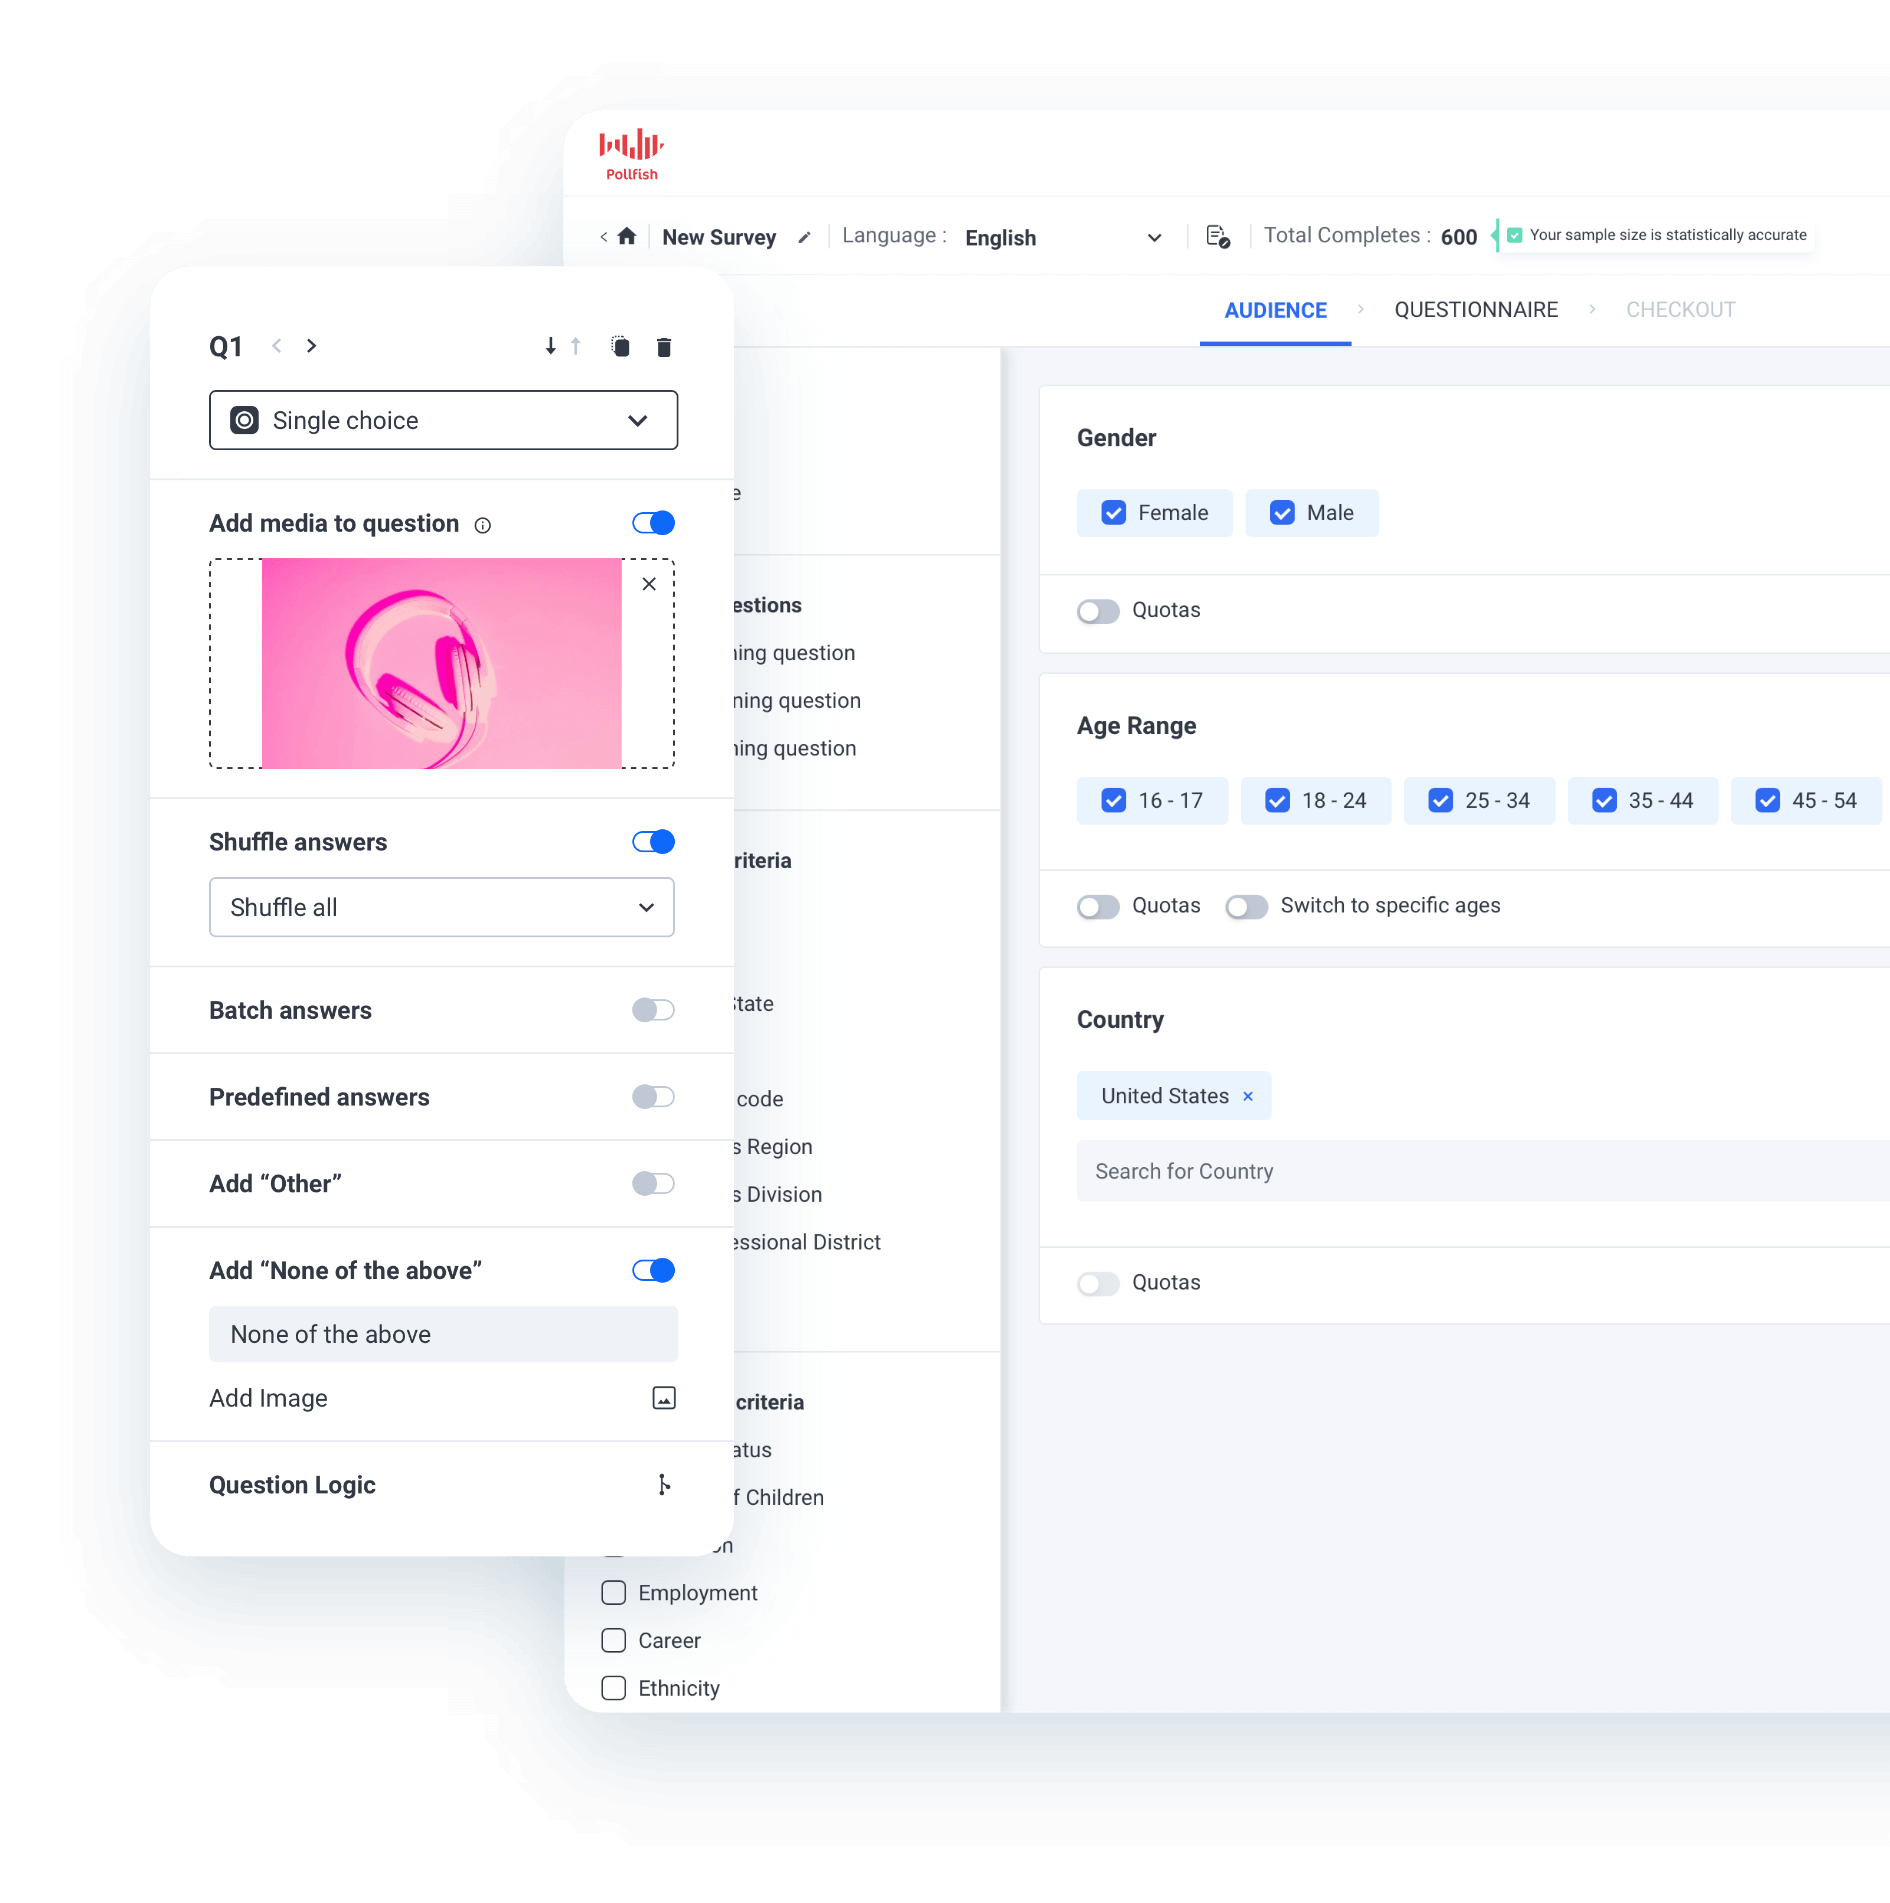
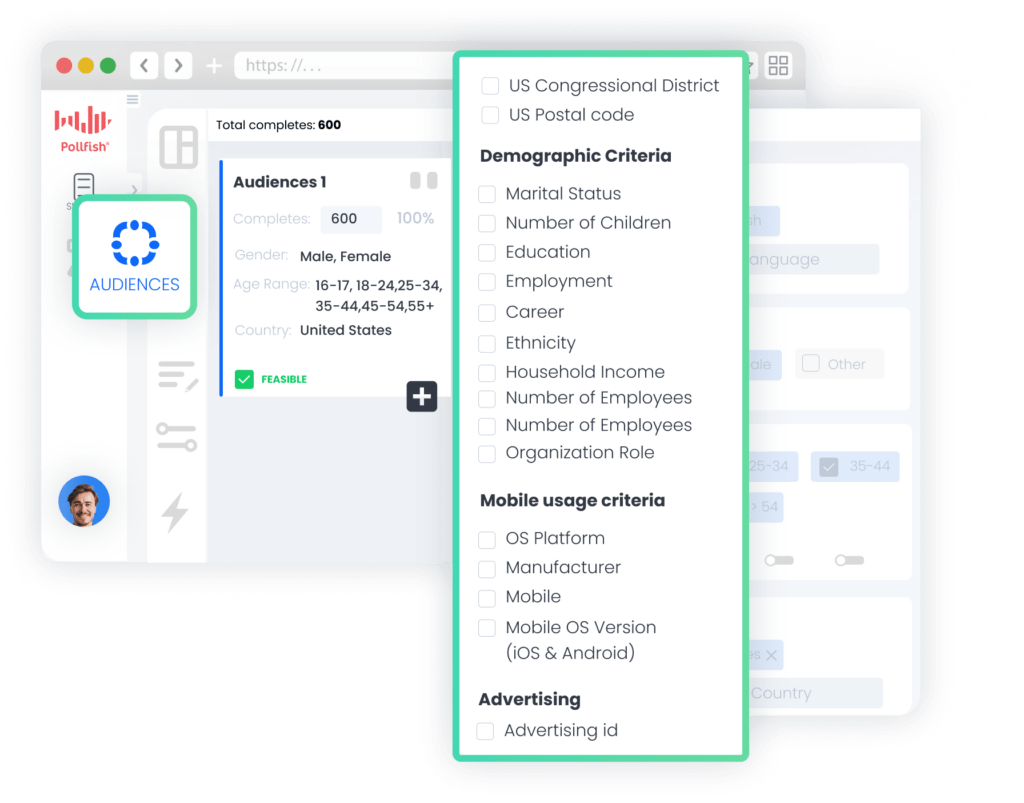
❇️ Choose from 50+ targeting filters in 6 key categories: Demographics, Geographic Criteria, Consumer Lifestyle, Employment & Occupation, Behavioral Data, and Media.
For example, an outdoor equipment company might leverage Pollfish to survey males and females aged 29–44 (Millennials) and 45–60 (Gen X), who live in Seattle, have a household income exceeding $200,000, and have recently made an in-store purchase of a high-end hiking or camping product (e.g., tent, backpack, sleeping bag).
❇️ Reach your precise target audience based on specific products purchased or stores visited.
Whether you need to survey recent buyers of Ben & Jerry’s or Häagen-Dazs, or frequent shoppers at Walmart or Target, and more, we can identify and target these individuals with high precision.
- What sets Pollfish apart is that we gather this information using self-uploaded receipts from our panelists, who are rewarded for their participation. By relying on actual receipt data instead of potentially misrepresented self-reported information, Pollfish ensures significantly higher data accuracy than other platforms.
- Conduct global research with ease. Reach respondents in over 160 countries and create multilingual surveys in more than 50 natively supported languages.
These are just a few examples of the extensive targeting capabilities Pollfish offers. If you have any questions about your specific audience needs, we invite you to reach out.
Rigorous Audience Quality Control for Reliable Data
At Pollfish, data quality is our top priority. We understand that even a perfectly designed survey can yield flawed results if the respondents are bots or real people providing rushed, low-quality responses. That’s why we have invested significant time and effort into developing robust data quality measures that are at the core of our company’s DNA.
Our commitment to data quality is what sets us apart in the industry. Here are some key aspects of our approach:
❇️ Diverse earning activities encourage optional survey participation, improving response quality.
When members join our panel communities (such as Swagbucks), they access a dashboard offering several activities to earn rewards. These options include playing games, watching content, uploading purchase receipts, and more. While surveys are another way to earn rewards, they are presented as just one more choice that members can optionally select via the dashboard.
The word “optionally” is crucial because, unlike many other providers, we don’t inundate our members with constant text messages and emails urging them to complete surveys. Such an approach can lead to survey fatigue and lower-quality responses. Instead, our members can participate in surveys at their own pace and on their own terms (without feeling pressured). This fosters more thoughtful, engaged, and higher-quality answers.
❇️ Members undergo a 30-day evaluation period before they can fill out client surveys.
Before new members can participate in client surveys, they must complete a mandatory 30-day evaluation period. During this time, they fill out internal profiling surveys, and we meticulously track their response quality.
Only those who consistently provide high-quality responses are allowed to participate in client surveys. This rigorous screening process sets us apart from providers who may be short on respondents and accept most sign-ups without thorough testing.
❇️ Each member of our community has a trust score, which increases response quality.
Each community member has a trust score that directly impacts their earning opportunities. Surveys are a significant component of this score, and members are aware that we track the quality of their responses through manual and automated means. This significantly incentivizes members to provide thoughtful, high-quality answers.
❇️ We employ a range of anti-fraud measures for each survey response, including:
- Human review of text-based responses
- Unique identifiers to eliminate duplicate responses
- Technical consistency checks to ensure the respondents’ carrier and targeting information align
- Carefully designed trap questions
- Minimum time limits for each question to prevent speeding
- Detection and removal of straight-lining (consistently selecting the same answer)
- Anti-VPN measures
This is just the tip of the iceberg. With Pollfish, you can confidently reach your target audience, no matter how specific or hard-to-reach they may be, while ensuring the highest level of data accuracy and quality.
Transparent Pay-per-Response Pricing Model
At Pollfish, our pay-per-response pricing model is designed to be cost-effective and give you complete control over your research costs:
❇️ No long-term commitments or minimum spend requirements.
With Pollfish, you have the flexibility to run surveys as often or as rarely as your research needs dictate. You only pay for the responses you receive, and you’re not locked into long-term contracts.
❇️ Unlimited team members at no extra cost.
Your entire team can access Pollfish to create surveys, view results, and generate reports, all under a single account at no additional cost per user. There’s no need to worry about individual license fees or seat restrictions. Plus, if your organization has multiple teams using Pollfish, each with their dedicated dashboard, you can effortlessly switch between them in just a few clicks.
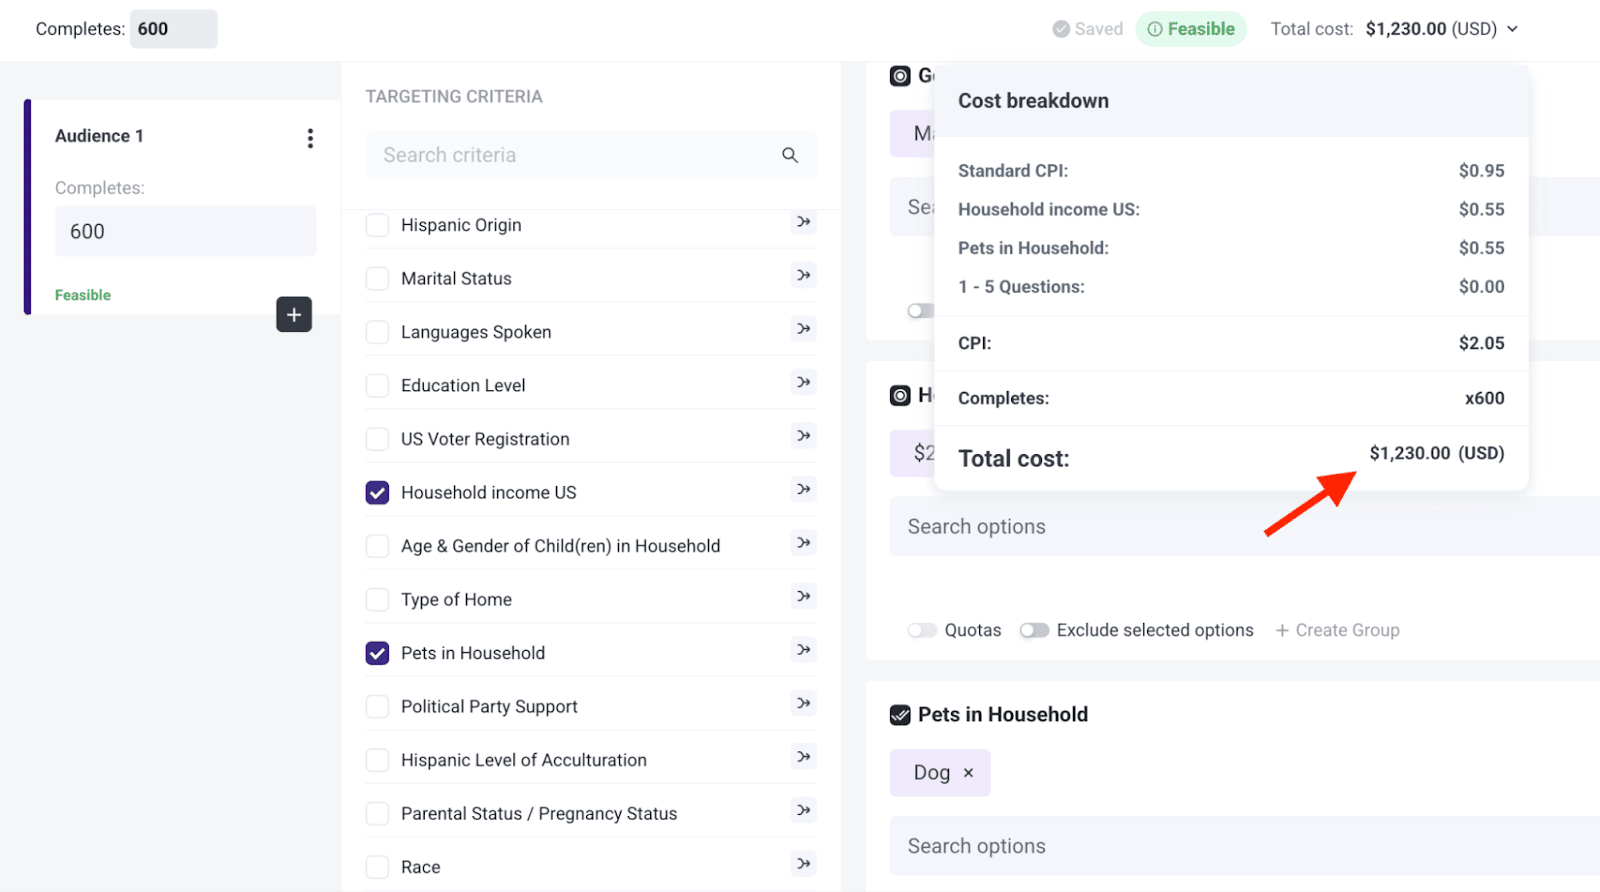
❇️ Transparent pricing displayed as you build your survey.
As shown in the above photo, let’s say you start with the base cost of $0.95 per response, and add two additional audience filters, such as:
- US household income between $75,000–$99,999.
- Type of home is a rented apartment.
Each of those filters would add $0.55 to the per-response cost. The total cost per response would now be $2.05 ($0.95 base + $0.55 + $0.55).
If you set your desired number of responses to 700, the total cost for your survey would be clearly displayed as $1,435 before you confirm your purchase.
You’ll see the full price upfront with no hidden fees or additional charges. With Pollfish, the price you see is what you pay.
Advanced Built-In Data Analysis Functionality
With Pollfish, you can effortlessly segment your survey data, hone in on specific subgroups, and create visually appealing charts in your brand’s colors — all within a single, intuitive platform. There’s no need to rely on external tools like Excel or Google Sheets.
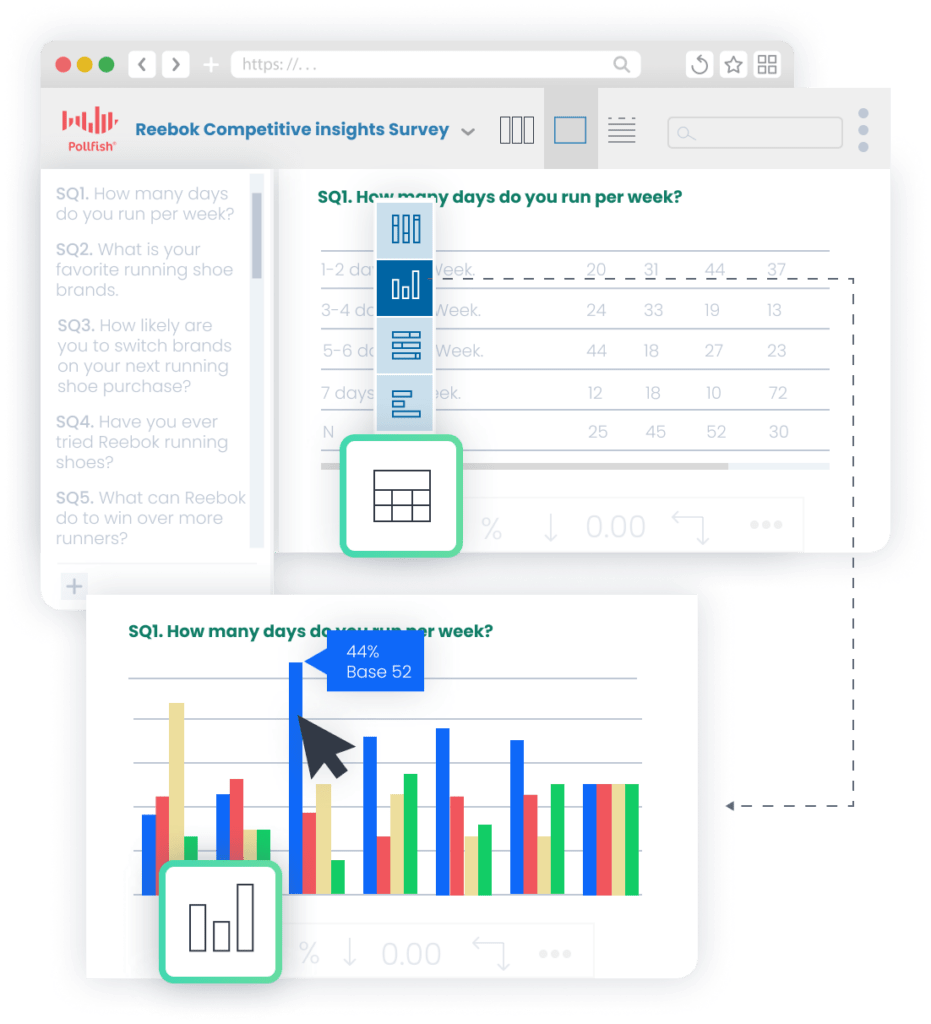
❇️ Automatic Chart Generation
Pollfish intelligently generates the most appropriate chart types for each survey answer, such as bar graphs, pie charts, tables, and more. This saves you time and ensures your data is presented in a clear, easy-to-understand format.
❇️ Targeted Insights through Filtering
Use Pollfish’s filtering capabilities to hone in on subsets of your data based on specific survey responses and audience attributes. For instance:
- Filter by survey responses: Isolate and examine data from respondents who provided particular answers, such as those who indicated they are “highly dissatisfied” with pricing, to understand their perspectives better.
- Filter by audience segments: Focus on specific demographic segments, like Gen Z, while excluding other age groups, to identify unique trends and preferences within that cohort.

Please note: The header in the illustration above includes the logo for Proedge, Pollfish’s parent company. Proedge offers done-for-you market research services and can help with survey programming, fielding and sample, data processing, and reporting.
❇️ Multi-Variable Analysis and Visualization
With Pollfish’s advanced Insights Builder, you can create compelling visualizations that incorporate several variables simultaneously, without needing external tools.
Say you want to gauge consumer attitudes toward a new streaming service. You could create one comprehensive chart showing likelihood to subscribe (variable 1), broken down by:
- Age group (variable 2)
- Household income (variable 3)
- Marital status (variable 4)
With just a few clicks, Pollfish will generate this multi-dimensional visualization, optionally with statistical significance testing to highlight key differences between groups. You can even customize the chart with your own brand colors.
❇️ Statistical Significance Testing
In testing product name concepts for a new home appliance, Pollfish might shade the “EcoSmart” name in dark green with an “A” label, while “GreenTech” appears in a lighter shade with a “B” label, showing that the EcoSmart name generates significantly higher memorability and brand affinity scores among target consumers.
❇️ Build a Presentation Deck within Pollfish
Create presentation slides directly within Pollfish, just as you would with PowerPoint, even while your survey is still actively collecting responses. This feature lets you have a nearly finalized report ready by the time your survey concludes, giving you a valuable head start. Once you’ve created your presentation within Pollfish, you can easily export it as a fully editable PowerPoint file (.pptx), allowing you to make any additional adjustments.
❇️ Flexible Export Options
Export your survey results and visualizations in various formats, including PDF, Excel, Crosstabs, and SPSS. (Click here for more info.).
The data analysis capabilities we’ve discussed are merely a fraction of what Pollfish has to offer. No matter how complex your data analysis needs may be, Pollfish is well-equipped to handle them. If you have any questions about your specific requirements, please don’t hesitate to reach out.
Interested in Trying Out Pollfish?
We invite you to:
- Sign up for a free account, which you can begin using immediately to launch DIY surveys.
- Book a demo call, where our team can answer your questions and provide guidance on making the most of Pollfish.
- Inquire about our full-service market research services, where we’ll collaborate to understand your unique requirements and manage the complete survey process from beginning to end. This option is ideal if you’re short on time or looking for additional expertise.
2. Qualtrics
Qualtrics is a Suzy alternative that’s best known for its survey functionality. Its pricing structure is best suited for enterprise companies, and we cover what differentiates Pollfish in our post on the best Qualtrics alternatives.
Qualtrics categorizes its features into three categories:
1. Customer Experience
- Voice of Customer
- Omnichannel Experience Management
- Digital Experience Analytics
- Website & App Feedback
- Location Experience Hub
- Online Reputation Management
- Contact Center Analytics
- Quality Management & Compliance
- Agent Coaching
- Edge Instant Insights
2. Employee Experience
- Employee Engagement
- Employee Pulse
- Employee Research
- Candidate Experience Management
- Employee Onboarding & Exit
- 360 Development Feedback
- Employee Retention Analytics
- Continuous Employee Listening
3. Strategy & Research
- Strategic Market Research
- Product Research
- Brand and Communication Research
- User Experience Research
- Edge Audiences
3. Attest
Attest is another Suzy competitor that is best geared for enterprise companies. It’s a solid research solution used by marketing, insights, brand, and product teams to run end-to-end surveys.
Some of Attest’s key use cases include:
- Brand tracking
- Consumer profiling
- Market analysis
- New product development
- Multi-market research
- Creative testing
- Concept testing
- Campaign tracking
- Competitor analysis
- Quant & qual insights
- Seasonal research
4. SurveyMonkey
SurveyMonkey is an alternative to Suzy that is best suited for simpler survey needs. Some of its key survey-related features include:
- SurveyMonkey Genius for AI-powered survey creation
- Customizable survey templates
- Survey branching and skip logic
- Response quotas
- A/B testing for better decision making
- Survey branding and theme customization options
- Custom URL survey links
- Multiple survey distribution channels (email, web link, social media)
- Real-time results tracking
- Real-time insights
- Text analysis tools for open-ended responses
- Integrations with 100+ platforms
5. Alchemer
Alchemer is a Suzy competitor and a great market research tool that offers various features, including:
- Market research surveys
- Real-time, in-app customer feedback
- Brand health tracking and consumer insights
- Text sentiment analysis
It can help you make better data-driven decisions and offers solutions by industry, including Government, Education, Non-Profit, Financial Services, Food & Beverage, Retail, and Software.
6. Forsta
Forsta offers quantitative and qualitative research features for understanding consumer behavior, including:
- Market research surveys
- Panel management
- Online focus groups
- Digital diaries & communities
- Social listening
- Research automation
- Text analytics
- Voice sentiment analysis
Interested in Trying Out Pollfish?
We invite you to: