Meet Insights Builder, the New Data Visualization Tool for Pollfish Surveys
Want an easier, more colorful way to analyze and present your Pollfish survey data?
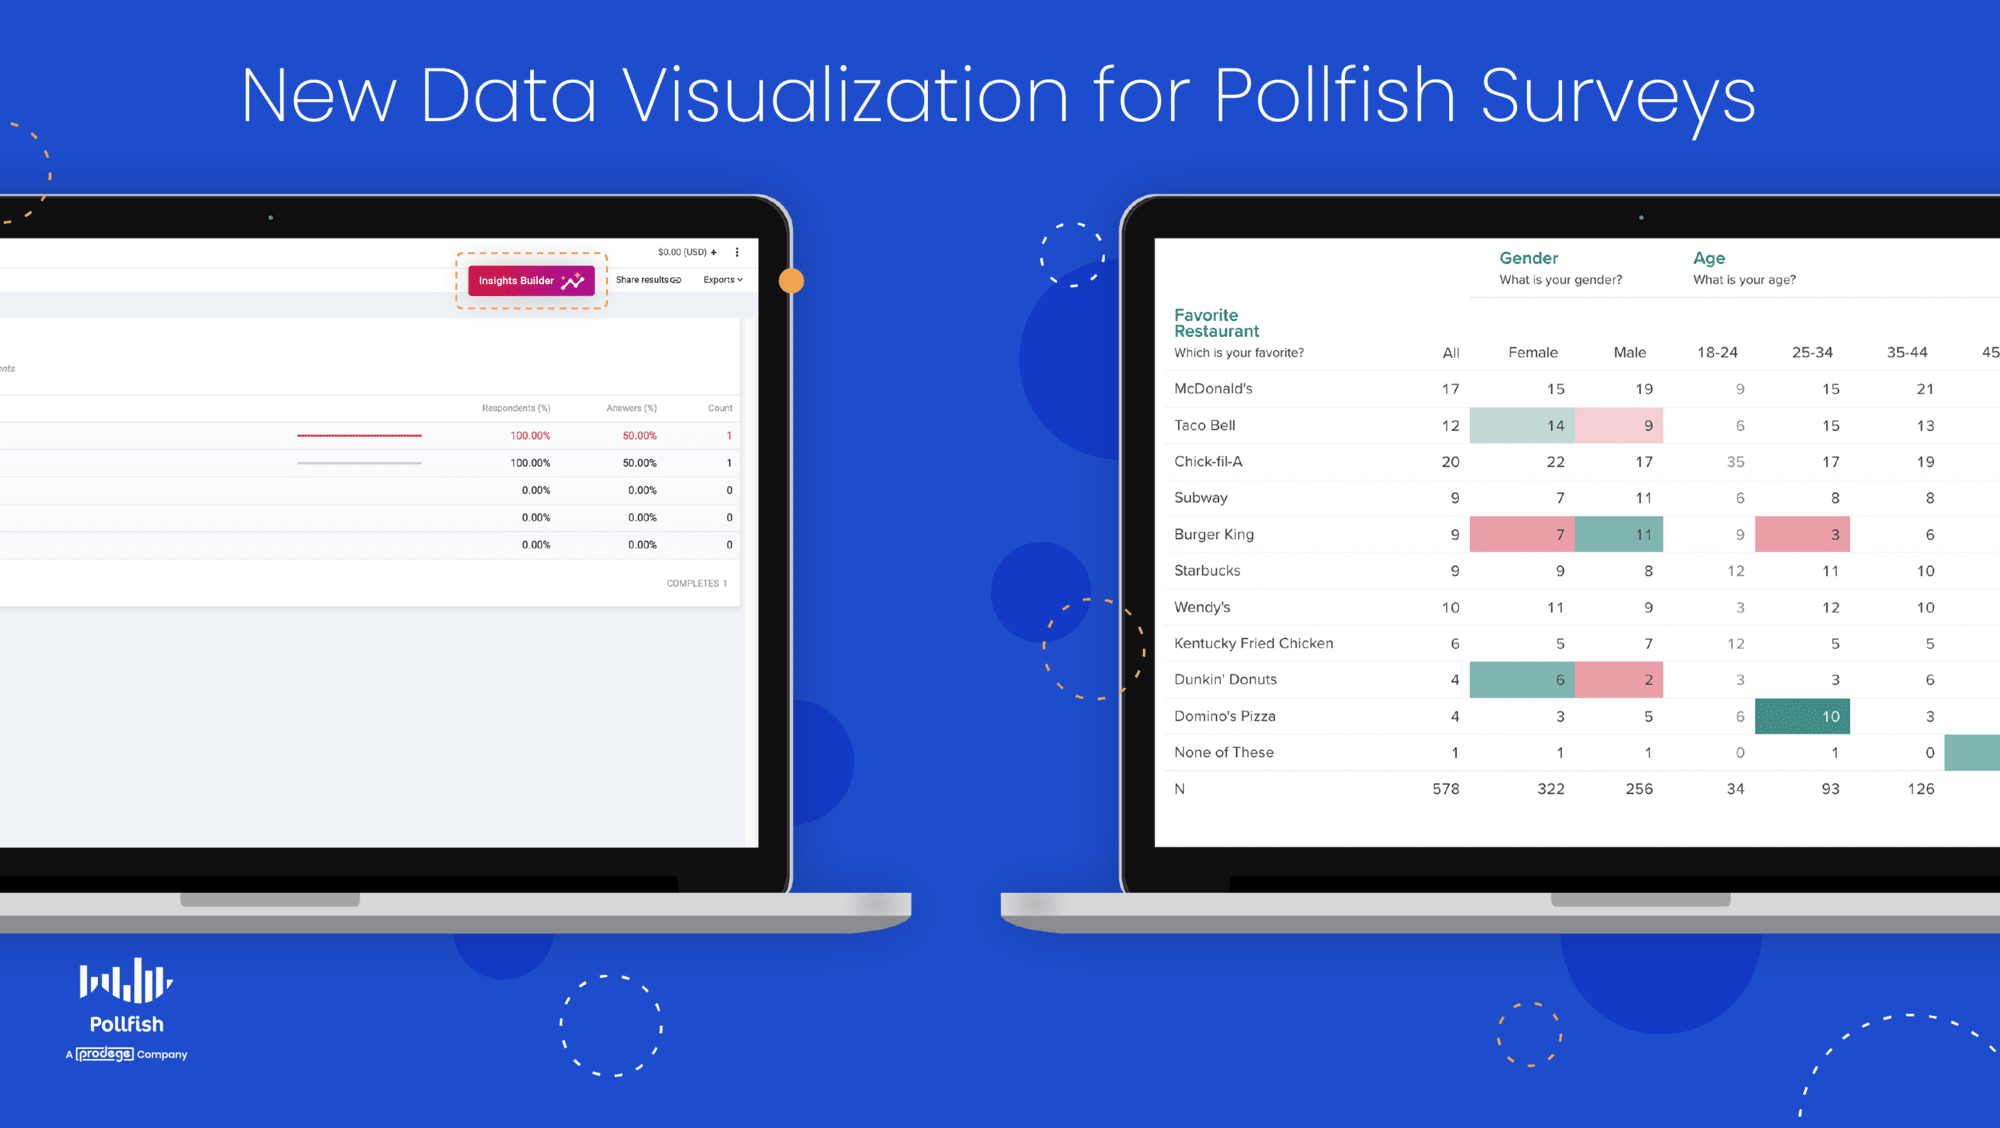
Look no further! With our new integration to the Prodege Insights Builder, you can enhance your survey analysis by adding valuable data visualization to your survey data.
Add Data Visualization with a Single Click.
Easily add data visualization to your next survey.
- Open a survey in your Pollfish dashboard.
- Click the “Insights Builder” button.
It really is that simple.
Analyze, Visualize, & Share Results.
With this new data visualization tool, you can:
- Analyze:
- Use a custom interactive online database to display key insights.
- Cross-tabulate, add filter logic, create new variables, apply stat testing.
- Visualize:
- Illustrate your business objectives clearly with visualization techniques.
- Craft rich and easily edited slide visuals in your organization’s branding.
- Share:
- Collaborate with your team internally through Pollfish by sharing directly.
- Control access and broadly share with internal and external stakeholders.
How “Insights Builder” Works
Only researchers in the Elite plan can access the Insights Builder tool via the Pollfish interface.
The export to Insights Builder can be initiated per survey by the researchers, but not all surveys are automatically synced. Once initiated, all survey updates (new responses received, new revisions added, survey renames, etc.) are synced in real-time.
First-time survey export
For a survey that has not been synced to the data viz tool, the researcher can view the “Insights Builder” option on the survey menu and the results page. A new window will ask you to continue, which will then redirect you to a new tab, once you click it.
This action will:
- Place the survey data into the data visualization tool.
- Open a new tab in your browser; this will contain the data visualization folder created for a specific survey.
- This means you can return to Pollfish whenever you wish.
- It will authenticate you to the data visualization tool via your Pollfish account, seamlessly.
- You won’t be asked to log in with your credentials to Data Viz.
- The “Insights Builder” is an option available throughout the lifecycle of the survey (from the status of running to paused/ completed/ finished).
Viewing an exported survey:
- When a survey has been synced to the tool, you can view the “Insights Builder” option in the survey menu and on the results page.
- A loader screen will appear to redirect you to a new tab.
Get Started With Data Visualization Now
Ready to get started?
Log into your account and try it out!
Your support doesn’t stop here. Prodege can provide additional support around leveraging data visualization with your Pollfish surveys and for all sorts of additional insights needs.