Understanding the Data in Multiple Selection Questions

Several market research campaigns and survey types will require using multiple-selection questions — questions in which respondents have the option to select more than one answer.
In opposition to single-selection questions, multiple-selection questions allow researchers to gain a more granular understanding of their target market.
They are often generated via advanced skip logic, that is, the automatic function that routes respondents to different questions based on their answer(s) to a previous question. They may also be used as the original questions on which skip logic is based.
In the Pollfish platform, multiple-selection questions yield various data in the form of percentages. This article explains the meaning behind the different data and how to navigate them with ease.
The Utility of Using Multiple-Selection Questions
There are a number of reasons as to why you should create multiple-selection questions. First off, they provide more precise answers. This is especially important when respondents cannot settle upon one answer, as multiple answers may apply to them.
Secondly, using multiple-selection questions help you thwart the Survey Scope Error. This error arises when researchers omit certain things from questions that would fully address the issue surrounding a topic. Multiple-selection questions help evade this error, as you are able to cover as many possible answers as possible in solely one question.
Moreover, multiple-selection questions help researchers clamp down on other survey biases, such as Demand Characteristic Bias. As its name suggests, this bias takes hold during the presence of a demand characteristic. Denoting an unintentional cue in the survey that influences respondents’ answers, this bias can occur if a researcher gives away the purpose of the survey study.
 Multiple-selection questions stamp out this bias, as providing various answers helps keep the purpose of the survey latent. In other words, it drowns out the obvious. Thus, respondents won’t be inclined to give false answers to produce specific results, ie., those that will benefit them somehow.
For example, in a community survey, respondents may change their answers if they discover the purpose of the survey is to allot benefits to community members. The same idea applies to all other verticals and survey types.
Lastly, multiple-selection questions provide an overall better experience on the researcher side and the end-user side. This is because these questions allow respondents to better express themselves, coupled with gaining more concrete insights to researchers and businesses.
They also remove the need to ask multiple questions about the same topic and can incorporate a choice for an open-ended answer by using the choice designating “other”.
The Different Data in Multiple-Selection Questions
Since these questions deal with multiple answers as opposed to just one, they offer more than one point of data about every such question. In the dashboard, you’ll see two metrics in the results of a survey with these question types.
These can be confusing since they deal with multiple answers; some respondents may choose only one, while some may choose two or even all of the selections.
We’ve laid out the meanings of each metric to avoid any confusion. But first, you ought to understand the meaning behind “count,” which is used to calculate the other data.
Count
The count refers to the number of times that one answer was selected. It would need to be selected at least once to be considered.
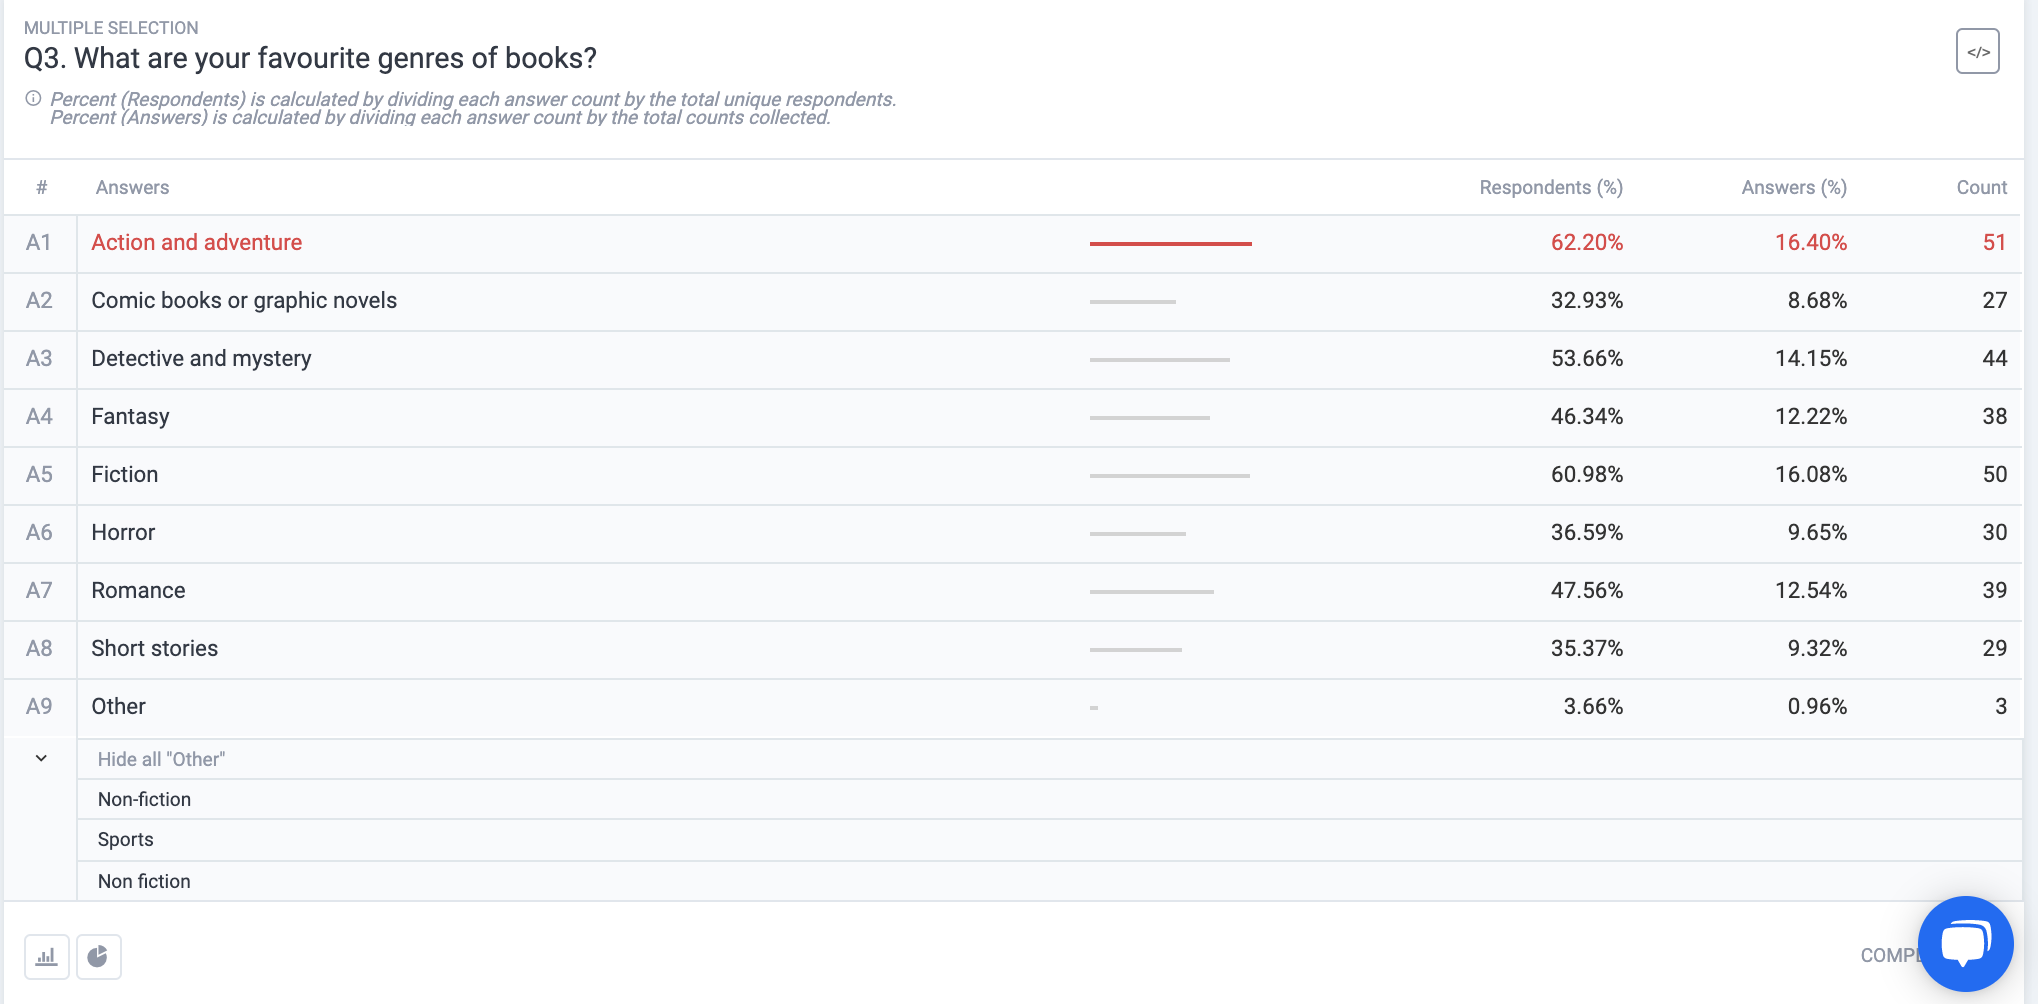
For example, if the count is 51, that means an answer was selected 51 times.
Percent of Respondents
This piece of data is calculated by dividing each answer count by the total amount of unique respondents. Then, to get the percentage, the quotient is multiplied by 100.
For example, if the count is 51 and the total number of unique respondents is 82, the calculation is as follows:
51/82 = 0.6219
0.6219 x 100 = 62.19
% of Respondents: 62.2%
Percent of Answers
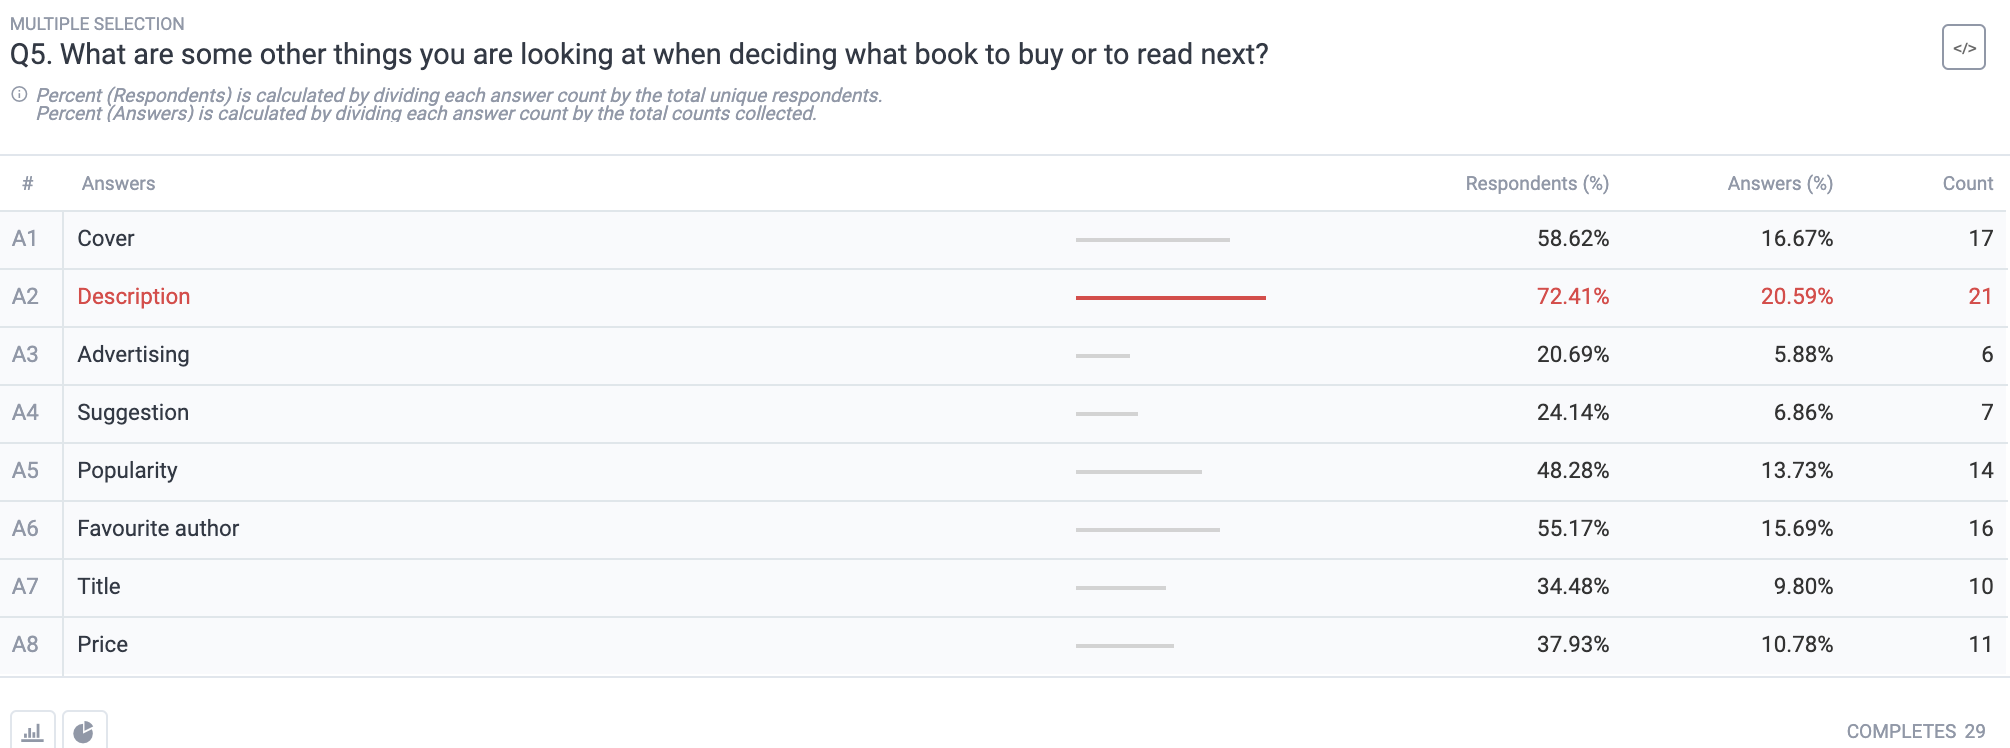
This percentage refers to a calculation centered on counts. It is calculated by dividing each answer count by the total counts collected per question. This variable is not readily visible. This is because it involves adding all the counts per question.
As such, this is typically where researchers stumble upon difficulty, as adding each count together gives you a number far higher than the number of respondents participating.
But, this is the nature of multiple selection questions: the fact that each respondent can select more than one answer, the total count of answers will be much higher than the number of respondents.
After you work out the quotient from the preliminary calculation (above), you multiply it by 100 to get the percentage.
 For example:
Number of counts of one answer = 51
Number of answers in the question = 9
Add the count of EACH of the 9 answers:
51 + 27 + 44 +38 + 50 +30 + 39 +29 +3 = 311
311 = total counts per questions
51/311 = 0.1639
0.1639 x 100 = 16.4%
% of Answers: 16.4%
Making the Most out of Multiple-Selection Questions
Multiple-selection questions can be more difficult to navigate, given that there are more answers to parse.
As such, understanding the metrics illustrated above will empower you to understand the overall sentiment around your answers. They are also critical when you conduct survey data analysis, as more points of data serve as key findings in your survey campaign.
These bits of data help you understand your respondents’ answers in a more quantitative way, which you can use for further analysis, such as follow-up emails in your current campaign.
When you comprehend these metrics, it will be far easier to make sense of the multiple answers you receive. So go ahead and use multiple-selection questions. They render a deeper read of your target market and allow you to explore more concepts while using less real estate in your survey (meaning fewer questions).
This makes the questionnaire adept for a mobile-first survey design.