How to Achieve Agile Market Research by Filtering Data
Achieving agile market research is a feat, even for the most technically savvy market researchers. This is due to the vast pools of data that researchers of companies big and small often confront.
Filtering data is both an effective and efficient means of gaining agile market research. This method helps sort out the chaos that bombards even the most powerful of market research tools.
A tool that leaves out critical data categories is bound to increase the presence of survey sampling errors plaguing a market research campaign. Concurrently, a tool that offers a vast amount of data categories and inputs is inclined to tarnish a survey campaign.
Filtering data is the solution, but it must have all the necessary functionalities in order to buttress agile data — and therefore agile market research.
This article explains agile data, how the correct filtering data interface can help you sustain agile market research and how the Pollfish platform offers advanced and granular filtering data functionalities.
Making Sense out of Agile Data
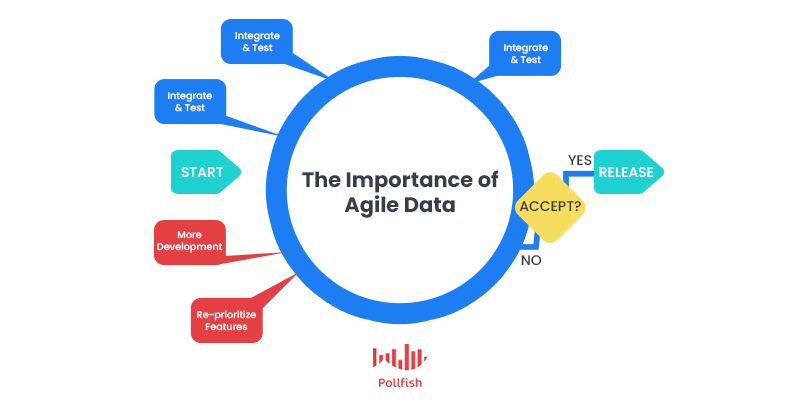
Primarily used in the IT sector and designed particularly for its professionals, agile data is a concept that can significantly improve the market research process.
This is due to the vast reliance on data in market research — be it through secondary means or through the set up of effective survey studies.
IT professionals have founded different methods to accompany the larger catch-all phrase known as agile data. This refers to all the strategies that IT workers can apply to work more in tandem and more effectively on the data facets of software systems.
By fostering the means to work together more constructively, they reap several benefits, such as speed to insight, less waiting on higher-ups for making forthcoming decisions and smoother collaborations.
Agile market research is also borne out of the concept of agile data, to bring such benefits and more into the sphere of research.
The Importance of Achieving Agile Market Research
Achieving agile market research is a necessity in the current information age, in which various digital elements are jockeying for users’ attention, in spite of short attention spans. This ties in directly with survey attrition, along with site and app users avoiding a survey in the first place.
A major deterrent to the survey process, this issue mars the ability to build up an agile system of data collection, analysis and the yielding of results. Some market researchers may create various survey campaigns on similar subject matters as a way to remedy this.
After all, with more surveys on similar subjects, it appears to be more conducive to creating shorter surveys, a common best practice.
However, this runs contrary to agile market research, as it requires more time to create the correct surveys, launch them, cross-reference them and acquire quick results.
Instead, the online survey platform itself must be built on the premise of agile data, so that market researchers can tackle any topic quickly and without the need to implement many surveys and related survey campaigns.
One such way to form agile data and reap its benefits is through an advanced system of filtering data.
How Filtering Data Attains Agile Market Research
Almost every market research SaaS platform offers the filtering functionality, be it for determining the qualified respondents, forming the questionnaire questions and those of the screener.
While the different filtering data systems you’ll come upon in online survey platforms may appear to be carbon copies of one another, a closer look will reveal that they are not. Thus, they do not offer the same prowess of agile data — if any at all.
This is because agile data is not just about streamlining operations, but doing so while providing all the necessary functions and pieces of information.
A potent system of filtering data ensures that market researchers do not forgo using all the necessary categories of data, be it in screening questions, questionnaire questions or the demographics input.
In addition, a strong presence of data filtering allows researchers to organize parse through a large collection of data. This is especially useful in ambitious surveys, i.e., those that are longer or use more skip logic.
When data is neatly filtered, it is much easier to analyze it, make decisions on the next steps and complete a research project in a well-timed manner, thus forging agile data and maintaining agile market research.
How the Pollfish Platform Offers a Top Tier Filtering Data System
Pollfish clients secure agile data on a daily basis through the use of our advanced filtering data system, which is implemented throughout our dashboard, allowing us to divide it into just two sections: the audience and the questionnaire.
This minimalist approach saves researchers the headache and eyesore of rifling through various pages as part of building a survey from the ground up.
Instead, the platform offers multiple categories in our filtering system, permitting each aspect of the survey to be comprehensive and well-organized.
The following explains just how granularly researchers can define both their audience and set up their questionnaire through our filtering data functionalities.
Data Filtering in the Audience Section
First off, our filtering data function allows researchers to reach the correct respondents, with demographics categories that filter through common categories such as age, gender and geo-location. Each category allows researchers to assign quotas, so you receive the exact number of your selected respondents.
Although geolocation appears to be an ordinary demographic option, our filtering system is granular and manifold, so that researchers can filter the geolocation by 9 categories, such as postal code, US Census Region, city, state and more.
There are also 9 categories of demographic criteria, all of which can also be assigned quotas. These include marital status, education, ethnicity, career type and others. Researchers can even filter respondents based on mobile usage criteria and an advertising ID.
To augment all of these advanced filtering options, the Pollfish platform has recently introduced the Multiple Audiences capability, in which researchers can create one survey, with the audience requirements of multiple surveys.
This is because you can create blocks, that is, groups of specific audience requirements and quotas, with each block representing a different audience.
All this smart filtering forms agile data for researchers, so that they won’t need help at every turn, given how intuitive the filtering data system is — and that is just in the audience section.
Data Filtering in the Questionnaire Section
The questionnaire section includes multi-pronged filtering data capabilities. The filtering options span various categories so that researchers can cover all bases in their studies. This also opens up the opportunity to use just one survey per campaign.
Firstly, researchers can select the kind of question they seek to use, with 8 options of question types available (single selection, multiple selection, ranking, etc). These form the core of the survey type, in that they can take the survey in various stylistic and thematic directions.
For example, there is an option for an NPS question, the heart of the NPS survey. Or, you can use a ranking question to create the CSAT survey. The ratings stars question option allows you to create a visual ratings survey, specifically one that uses stars and so on.
After you choose the question type, there are 7 categories you can use to filter the answers. For example, you can add media to an answer, such as an MOV file, a GIF, an audio file, etc. Or you can apply logic, which routes respondents to appropriate questions based on their answer to a question of origin.
When researchers are at a stumbling block in terms of answer options, they can use the predetermined answers filtering option. This filtering data function is rich in categories, offering 46 scaled answer options. For example, researchers can use answers using a scale of disagree to agree, satisfied to dissatisfied, far exceeding expectations to falling short of expectations, the days of the week and many more.
The magnitude of filtering options will prevent any researcher-based writing block when it comes to crafting answers.
There is also a category of “none of the above,” which can be accompanied with an image. There is an “other option,” in which you can have responders specify their answer. This too can be paired with an image.
Instead of manually changing the order of answers, you can use the “shuffle answers” filtering data option. Or, you can implement “batch answers,” a function that allows you to paste all of your answers into the answer portion at once, should you decide to use them from an external document.
A smart system driven by AI, Pollfish divides the pasted content into separate answers. This allows you to avoid copy/pasting each one manually, as they are all inserted automatically.
All in all, the Pollfish system of filtering data is an advanced system of granular categories and selections, which facilitate the survey creation process, in turn providing agile data that is feasible to interpret.
Filtering Data in the Results Dashboard
Finally, and perhaps most importantly, data filtering is applied in the post-survey results in the Pollfish dashboard. There, researchers have the option of filtering data to their liking for all of their analysis needs.
When filtering data in the results dashboard, researchers have filtering options on the left panel of the page. They can sort their results by selecting their desired filters and deselecting the rest.
They can also filter by question and answer to see how respondents answered a certain question, by clicking on their desired question or answer. They also have the option to export the filtered results by clicking on “exports” and then instead of “all data” selecting “current view.”
There is also a “time range” filter on the left panel, which can also give them a grasp of the survey distribution in real-time.
Additionally, there is a post-stratification filter; this filter weighs the age and gender demographics to match the census data of the targeted region.
The results are adjusted to reflect this change. This is why the filter on each response counts differently (hence the number/ percentage discrepancy when the filter is enabled). This data is a more accurate representation of the targeted audience.
The platform also allows researchers to download various documents for analyzing post-survey data — data that has already been extracted by Pollfish. Researchers can download this data in four different kinds of report types for all kinds of analyses.
The following explains the 4 kinds of data exports available for data filtering:
- PDF: A visual document that can easily be shared with stakeholders and saved as reference docs. A Pollfish PDF is laid out similarly to a PowerPoint presentation.
- Excel Spreadsheet: Recognizable to most businesses, with a Pollfish spreadsheet export, researchers have full access to all Pollfish survey results. They can add pivot tables, graphs and get deeper insights.
- Crosstabs Report: Crosstabs are a matrix-style data visualization format and one of the most useful ways that market researchers analyze data. This kind of report allows researchers to look into individual insights and organize the data in different ways, opening different consumer insights that wouldn’t be readily available from the initial results.
- SPSS Report: SPSS is a set of software programs combined in a single package. It allows you to add your Pollfish results to various kinds of complex data analyses. It’s good at combining varied, complex data sets. Researchers use it to make connections, find correlations and graph results from various data exports at once. SPSS has several tools to analyze data for predictions and spotting patterns, increasing its use for brands and marketers looking for buying behavior trends or to vet the viability of a new product.
The Gateway to Nurturing Agile Market Research
Obtaining agile market research is never an easy task — that is, if you’re using a below-par online survey platform. There are several ways such a platform can spur agile data, such as via a mobile-first approach and with powerful SaaS integrations.
Additionally, filtering data is a critical component of nurturing agile data for market research. As one of the main elements of a market research tool, it is not universally equivalent across platforms. This function tends to differ from platform to platform, as such it is not always conducive to agile data.
On the contrary, the Pollfish filtering data system encompasses all aspects of the survey creation process. It is built as a means of providing comprehensive coverage of all categories, whether they pertain to the screening section, aka, the audience section, or the questionnaire.
It is also very intuitive, thus molding agile data by its very structure.
Frequently asked questions
How do you use data filtering in the questionnaire section?
The questionnaire section includes multi-pronged filtering data capabilities. The filtering options span various categories so that researchers can cover all bases in their studies.
How many data exports are available for data filtering?
Four main data exports are available for filtering data: PDF, Excel Spreadsheet, Crosstabs Reports, and SPSS reports.
Why is filtering important in agile data market research?
Researchers often divide their data into different categories for a more comprehensive understanding of it. Filtering this data opens up the opportunity to use one survey per campaign, which can zoom in on each category in a better way. Additionally, filtering data allows for easy organization.
How does the filtering data system work?
Clients can use an advanced filtering system post-survey results to divide it into two sections: the questionnaire and the audience. It also allows clients to divide their data into multiple categories for a complete and elaborate survey result.
How do you filter data in the results dashboard?
There are filtering options on the left panel of the page where researchers can sort the result by choosing their desired filters. For example, they can also use filters to view how respondents have answered certain questions.