
How the Pollfish methodology works
How the Pollfish methodology works

As market research has been around for a long time, there are many methods for collecting survey responses. All have pros and cons, and before you can fully understand the Pollfish methodology, you should know who we are up against.
Survey Methodology Examples
Random Digit Dialing (RDD)
This is an outdated method of polling where researchers build a sample and call potential respondents on the phone. This method has many positives, including polling respondents in a neutral location, getting respondents who are not planning ahead to take a survey and other factors that increase data quality. But as people move toward mobile devices instead of home phones, this survey methodology has serious challenges.
Online Panels
Online panels collect responses from many different sources, incentivizing people to sign up as professional survey takers in exchange for rewards like cash, airline miles and more. This has a number of downsides, most of all people rushing through surveys in order to get their reward and get to the next lucrative survey.
Assisted Crowdsourcing
Assisted crowdsourcing uses recruitment ads on social networks. High coverage but low response rates slow the speed of this methodology, ads can be pricey and, most importantly, there is no way to prevent the Facebook algorithm from showing your ad to people more interested in politics than the average person. This creates sample bias and reduces data quality.
How does the Pollfish methodology work?
Pollfish utilizes a new survey methodology called Random Device Engagement. RDE is the natural successor to Random Digit Dialing. By delivering your survey inside popular mobile apps, RDE utilizes the same neutral environment as RDD, and an audience who are not taking premeditated surveys, by reaching them inside mobile apps they were using anyway.
Pollfish uses non-monetary incentives like an extra life in a game or access to premium content. With additional layers of survey fraud prevention including AI and machine learning, Pollfish removes potentially biased responses, improving data quality even further.
How is this done? How can we reach and audience of millions without monetary incentives?
Let’s start at the source—our audience
There are roughly 7.5 billion people living on planet earth. About 5 billion of those people have mobile devices, and the number is growing.
Every one of those people is a “mobile consumer”, and a potential respondent to your survey questions. Using the apps that they have installed on their devices that they are in every day, we can quickly gather a massive volume of responses and target them accurately.
Why hasn’t this been done before?
Mobile surveys have been tried by researchers before—and it hasn’t gone great. River Sampling randomly sent surveys through mobile, disrupting the mobile respondent experience and offering no way for researchers to know who was taking the survey or if they fit into the target audience. Response quality was so bad that researchers rushed back to their imperfect-but-better-than-nothing online panels, and haven’t looked back for 20 years.
Here we found the perfect opportunity to shake things up. With a group of Android designers and engineers as our founding team, it was a no-brainer that our research software was going to be rooted in mobile development. But since nobody wants to download an app to take surveys (gross) there had to be another way to reach an audience at scale that provided the response quality that researchers needed.
So we designed an SDK that integrates natively with mobile apps.
Integration for better information
An SDK (software development kit) is a single line of code that can non-intrusively be included in the code of an app. This provides an API (Application programming interface) that more or less lets our platform and the app “talk to each other.”
By integrating directly with apps, we’re able to collect unique user information to manage and track respondents across devices using their mobile ad ID. While we don’t collect any PII, we are still able to complete a respondent profile during their initial opt-in phase, including everything from their basic demographic information to their age, marital status, race, and geographic location. This allows us to distribute surveys to a randomized group of people who fit the targeting criteria of a given survey in a process called Random Device Engagement.
This is what River Sampling was lacking. They had the right idea to survey real users on mobile devices, but with no way of gathering information back from the respondent, responses couldn’t be verified and fraud couldn't be prevented.
To see the full evolution of market research, check out our webinar below.
The app partnership model.
“In-app survey... That sounds sketchy.”
Because of our delivery model, this is actually less sketchy than you’d expect. Unlike some of our competitors, we don’t blackmail our respondents with a paywall until they take a survey. It’s completely optional, every-single time.
With in-app surveys occurring only with engaged users, they have the option to opt-in or out in the moment and their responses are naturally occurring in real-time. If they opt-in, they could get a small, appropriate perk that is specific to the app they are using. If they opt-out, there’s always the option to take it the next time they’re invited to participate.
"So then, why do they even take the survey, if they can just skip it and go back to what they were doing?"
Here’s why: Incentives. But not incentives that are cumulative or monetarily based.
As much as survey tools love to promote data integrity, allowing respondents to take multiple surveys and collect points or cash leads to bias. When panelists are incentivized to take as many surveys as possible to accumulate rewards, the volume of responses goes up but data quality plummets.
This is yet another advantage of our app partnership model: the developers have control over respondent incentives specific to their individual apps. For example, if we have partnered with an app for world news, a survey incentive might be a premium content article. For a fitness app, perhaps a free yoga class. In a game, an extra life— and so on. The publishers know what will motivate their users and prompt them to choose a survey when it is presented.
Because we don’t bribe our audience with monetary incentives, we enjoy significant cost savings that we are able to pass on to our customers—along with the highest quality data available from any mobile survey tool.
This model benefits the app publishers too. Mobile surveys are one of the most highly-paid monetization options available to app developers. Instead of running advertisements, they can work with us to offer their users mobile surveys. Users are more engaged with surveys than ads, and the app publishers make a higher return on them than they do from their typical mobile advertising options.
? Learn more about our Audience
AI and Fraud Prevention
“But what about people who opt-in and just don’t care?”
There’s always going to be a certain number of people who opt-in to take a survey, and then don’t exhibit above-board behavior. Cheaters, speeders, and bots have long plagued the effectiveness of consumer surveys.
Fortunately, we developed a proprietary machine-learning algorithm that can detect fraudulent responses early and remove respondents immediately who aren’t up to our standards.
This can mean anything from straight-lining responses to nonsense written in open-ended answers. Even suspicious behavior, like spending too much time in a questionnaire, is enough for us to remove a respondent from the survey. We have the audience participation to fill virtually any quota so there’s no need for us to settle for subpar response quality, and it's why we throw out up to 30% of our responses.
We take our fraud prevention extremely seriously to keep your response quality and overall data safe.
? Read more about our data quality
Mobile delivery and user experience.
Pollfish keeps two audiences in mind during development: The recipient of your survey, taking it on their mobile device, and you, the user, building a survey on our platform. The design of both experiences is critically important to the data quality, completion rates, and keeping frustration low for all parties involved.
Respondent Experience
The surveys we send to respondents are mobile-optimized to be an organic part of the experience from beginning to end. With UX thinking leading our development, we prioritize how consumers experience mobile, how surveys fit into that behavior, and uphold best practices to be mindful of the way people naturally react in these settings.
For example, surveys that can be completed in-app without taking a user to a third-party location are less disruptive to the mobile experience. When surveys are quick and convenient for respondents, they’re happy to answer a few questions and get an appropriate reward. This means better completion rates for you.
We take into consideration the layout, design, and length of surveys to ensure a positive user experience for the respondent, driving higher quality responses overall and a quick turnaround from the instant collection method.
? 50 ideas to improve your survey response rate
? Learn to write a good survey question
User Experience
Don’t worry— we didn’t forget about you.
Much like the surveys respondents take, the Pollfish platform offers a friendly, intuitive interface that tells our users what they need to know upfront. Things like screening questions and demographic quotas help you narrow in on the exact audience you want to reach. Features like feasibility, audience preview, and transparent pricing make it easy to understand how long or expensive it will be to run the survey in question.
The platform even updates in real-time, so once the survey is launched, you can watch your results as they come in, knowing each one is a real user, engaged in your survey, on their device.
We help people from all sorts of backgrounds with all sorts of survey-related problems—including a lot of people who are new to the world of research or survey-tools in general. This is why we also offer our resource center and personalized help from our 24/7 customer experience staff—even the option to hire a research expert to help you with your survey.
-> Interact with sample results
-> Get comfortable with the platform
To summarize, Pollfish is a platform for you that grants access to a massive network of respondents who opt-in when a survey is presented to them. Using randomized mobile delivery, advanced AI, and targeting capabilities, you can reach a narrow audience segment with higher speed and accuracy than alternative survey options.
We take a lot of the work out by offering our platform and audience all-in-one, but you can also use our third-party offering to connect your existing survey to our audience network. Check out the third-party page to learn more about compatible tools.

Online Survey Sampling Methods: Random Device Engagement & Organic Sampling
Organic Random Device Engagement Sampling Methodology
Academic whitepaper written by Dr. David Rothschild, Economist at Microsoft Research & Dr. Tobias Konitzer, C.S.O. and co-founder of PredictWise.
2015 and 2016 saw high-profile polling failures throughout the world.
In the summer of 2015, before Brexit and the 2016 US election, The New York Times asked, somewhat rhetorically:
What is the matter with political polling?
Implying that there was already a crisis of confidence in polling. Then in 2016, the United Kingdom stunned the world by voting in favor of Brexit, a referendum on the United Kingdom leaving the European Union, despite opinion polls shifting towards remain in the last few days. A few months later, despite polling showing Democratic candidate Hillary Clinton winning in enough states to win the US election, and poll aggregators confidently pointing to a Clinton victory, Republican candidate Donald Trump won a fairly comfortable Electoral College victory (but, still lost the popular vote).
While there is some nuance to the label of failure, the popular vote was forecast spectacularly well by polling aggregators, and “failure” was really a local phenomenon boiling down to a number of state-level polls in the Rust Belt (and applied to the presidential election only, and not congressional elections): the public perception was that of “failure in broad and absolute terms. As is now well known, this failure (or at least either perception of failure or partial failure) led to a reckoning with the status-quo modus operandi of polling; the whole industry faced a market-threatening question of where they were going.
Culprits were readily identified and one target was Random Digit Dialing (RDD) polling samples, the gold standard of high-quality polling in recent decades, which has undergone a massive shift in recent years. RDD response rates have decreased from 36% in 1997 to single digits in the 2010s. And, as Gelman et al. (2016) shows this non-response is coupled to political attitudes: today, traditional polls, RDD with a mix of landlines and cellphones, have a hard time reaching those with lower levels of education and lower levels of political knowledge. Thus, polls in 2016, especially the crucial state-level polls in the contiguous states of the Rust Belt, that neglected to weight on education had a huge problem. Similarly, RDD has a hard time reaching White blue-collar voters, dubbed Bowling Alone Voters, especially mobile blue-collar voters (“Truck Driver phenomenon), as a Post Mortem by Civis Analytics has pointed out. This is even harder to control with traditional analytics.
But, even more serious than its current problems: even if RDD can still work, it is doomed in next few years. Do you have a landline? Do you answer unknown (or suppressed) numbers on your cell phone? Will you have a cell phone in 10 years? Will the platform for reaching you be a phone number or a user ID? These are serious questions that further jeopardize the future of random digit dialing: by definition, it is impossible without phones!
As with all discussions around polling, it is critical to delineate two distinct things: data (or sample) collection and analytics. Data collection is how respondents are gathered. Data analytics is how the collected data is turned into market intelligence. Nothing prevents the most advanced analytics from being used on any data collection, although different analytics will provide various levels of benefit to different samples. For this paper, we will stick to data collection but refer to several previous papers exploring data analytics (Goel, Obeng and Rothschild 2015).
As is the case with all innovation, some innovation is good and scientifically sound, some innovation is snake oil, with little or no effect, and some innovation is flat-out dangerous. In this paper we shed light on three such innovations competing to replace RDD: Online (non-)probability panels, Assisted Crowdsourcing, and Random Device Engagement (RDE). All innovations come with strengths and weaknesses. But, as we spell out here, one is the clear winner: RDE, which is why RDE is at the core of our methodology.
Traditional & Online Survey Sampling Methods
Random Digit Dialing (RDD)
Random digit dialing is exactly as the name says: building a sample calling random people on the phone. The first step is to identify a cluster of phone numbers that have reasonable demographic and geographic representation. Then, start calling those numbers at random, trigger a response, and collect poll answers over the phone. The mode is confined, by definition, to a telephone, but it has recently expanded to both landline and cell phones. The mode has high coverage (in that most people have either or both a landline and cell phone), but coverage becomes harder to assess while landline penetration is dropping as cell phone penetration is rising. This makes it hard for survey researchers to map the population in either group or any individuals inclusion in either group. Response rates are oftentimes in the single digits.
Online Panels
Online panels collect responses either via a fully opt-in structure, including a signup page, or start with an RDD-telephone (and/or supplemented with cell phone) or mail recruitment. Panelists are then recruited to participate in specific surveys, for example via email invitation to the page of the panel provider. The mode is a mix of desktop, tablet, and smartphones, depending on the device of choice from which the invitation is opened. The mode has very low coverage (very few people opt-in to panels), but RDD-based panels, which start out with random methods of recruitment, have better coverage. Response rates, although generally decent from panelists, are low when one considers the low degree of opt-in to the panel. This makes them hard to compute accurately.
This has a number of advantages:
1. Panels provide repeated and connected users.
Over-time trends can be analyzed, and any custom polling built on top of baseline tracking can be guided by priors derived from data a serious innovation.
2. Online survey sampling methods like online panels are relatively cheap and fast.
Marginal polling is relatively inexpensive and can be done faster than traditional random digit dialing.
Curating panels as an online survey sampling method comes with a number of serious disadvantages:
1. You are locked into one model of data collection.
Polling firms that are locked into a specific mode of data collection will be hit with tremendous costs because the old infrastructure will have to be dismantled as technology shifts over time. And, no one can predict how long online panels will be a viable mode of data collection as web usages shifts to mobile and beyond (yes, you are reading this right: we want you to think virtual reality here). And, many companies that build their polling around this form of panel are locked into non-transferable unique identifiers of each respondent. This has some short-term benefits, but it will make it very costly when the companies need to shift data collection as technology evolves.
2. Panel fatigue
A myriad of research has documented that repeated participation in polls of panelists can lead to panel fatigue, resulting in non-response error or measurement error (Porter, Whitcomb and Weitzer 2004; Kasprzyk 2005). The applied scenario: respondents might be eager to fill out surveys correctly and with care, but this willingness declines the more respondents are invited to participate in surveys, especially if respondents are at risk to lose panel status. Instead of providing meaningful answers, respondents then click random answer options, or gravitate toward "Don't know".
3. Panel effects/Panel conditioning
Slightly different from panel fatigue are panel effects, or panel conditioning (Sturgis, Allum and Brunton-Smith 2009; Halpern-Manners, Warren and Torche 2017). Even if panels recruit a sample that looks like the perfect cross-section of the desired target population at the time of recruitment, the demand to answer political surveys turns these initially representative panelists into a bunch of very politically aware citizens. Panel conditioning has plagued a number of panels or panel-like setups. In the worst-case scenario, all panelists will have acquired a base degree of political sophistication as a consequence of being professional political survey takers. In that case, even the most advanced bias correction algorithms will fail because of sharp separation: Among the panelists, no one (read: zero) who mimics the stratum with low levels of political sophistication is left.
4. Mix of web and mobile not clean
Web panels tend to engage respondents either desktop, or on their mobile devices, but the infrastructure may, or may not, be very adaptive. Either way, the users are engaging in different experiences conditional on the device of engagement, which is hard to control for.
5. Non-Organic
In panels, respondents are not engaged in their natural (read: organic) environment (Zaller et al. 1992). Instead, an alternative digital environment is created, with the potential of introducing measurement error. As respondents are taken out of their normal routine, thought processes can deviate from those in more natural environments, leading to artificial considerations that can unduly influence item response.
Online panels have the ability to track public sentiment over time more easily than RDD, and are able to leverage the longitudinal panel structure of the data to parse out true swings from artificial movements. In addition, clients of custom polls can be guided by a plethora of prior baseline data when writing the poll. But, reliance on online survey sampling methods of data collection and dangers of panel fatigue and panel conditioning mean that insights can be seriously biased, especially if the panel exists for a longer period of time (and panels, as a class, exist for a longer period of time) and it is getting harder to recruit a fresh replacement sample.
Assisted Crowdsourcing
Assisted crowdsourcing polling relies on social networks with massive penetration, and data on their users, to supply respondents (read Facebook: while it can be done on other display or search ad platforms, the massive penetration/coverage and availability of background demographic data mean that Facebook is really one of the few alternatives).
First, the researcher creates a set of demographic quotas (i.e., the number of respondents they want with any combination of demographics). She then submits these quotas to a social media platform, along with an ad to invite respondents to participate in the survey. The social network then serves this content to a targeted group of users, and the polling firm surveys respondents who click on the ad and go to the survey site. The mode is mainly desktop, but could be tablet or mobile as well. This method has very high coverage, but low response rates.
There are some advantages with this sampling method:
1. Speed and Targeting
The main advantage here is that due to the penetration and reach of Facebook, polling can be done at granular areas (think state legislative districts), at a somewhat cheaper cost (by our estimates, respondents will run at about $5). Thus, a polling firm engaging in assisted crowdsourcing could sell a poll of N 1,000 for about $8,000-$10,000, slightly cheaper than traditional polls (but with a similar cost to online panels), and, due to Facebooks reach, faster. In summary, good depth, speed, and relatively good costs.
2. Organic Sample
Facebook is an organic location for getting opinions. Instead of curating professional survey takers who answer many political polls akin to a (side-)job, assisted crowdsourcing reaches respondents where they spend time organically. That is to say, people live on Facebook, get their information on Facebook, share their thoughts on Facebook; assisted crowdsourcing gathers opinions in that natural environment.
There are BIGGER disadvantages:
1. Quota Sampling is bad
Quota sampling has long been shunned by high-quality polls, and for good reasons: The debacle in the 1948 election laid bare the dangers in quota sampling (i.e., Dewey did not beat Truman). If respondents are “recruited to fill demographic buckets, pollsters are going to recruit respondents in that bucket who are easiest to reach. You need to recruit 10 non-college educated Whites? Great, you have interacted with representatives of that demographic bucket in the past, why not simply recruit these folks? While this is done in practice, hitting the same respondents over and over again is problematic. More importantly, the ability to reach someone within a bucket is likely correlated with the respondents level of political engagement, partisan affiliation, and political knowledge: the same things you are trying to measure. Specifically, respondents of certain demographic strata who are easy to reach have abnormally high levels of political engagement, knowledge, etc., leading to a sizable bias that cannot easily be corrected.
2. Quota sampling on social networks is worse
If you are dealing with social networks, the quota sampling problem discussed above gets much worse. Facebook algorithms are designed to expose the cheapest respondent to the ad, i.e. the respondent that is most likely to maximize click-through rates (see for example this discussion about Facebook targeting algorithms in this recent PNAS letter (Eckles, Gordon and Johnson 2018)). Hence, it makes sense to show ads to participate in a political survey, especially those that have a political cue, to users who are more likely to click on political content for example users who declare a self-reported ideology as part of their profile, or like a lot of political content.
If polling firms relying on assisted crowdsourcing target, say, non-college educated Whites, chances are that those non-college educated Whites who are exposed to the ad because of their high likelihood to click on political content exhibit unusually high levels of political engagement. To make matters worse, the characteristics most predictive of that non-representativeness, behavioral metrics from Facebook such as Likes of political content, are not available to polling firms for bias correction. And, in expectation, Facebook's machine-learning algorithms get better at predicting who clicks on ads to participate in political polls, and who does not, over time. This means that (a) biases exacerbate the longer polling firms recruit respondents on Facebook, and (b) the number of fresh respondents diminishes, in effect leading to a panel structure bringing with it concerns of measurement error due to panel fatigue, or panel conditioning effects, meaning a change in underlying attitudes as a direct consequence of membership in a panel-like structure.
3. Assisted crowdsourcing is at the mercy of social networks
Simply, any survey tool on a social network is reliant on the legal framework surrounding social networks with high penetration (and, there are really only two or three to speak of). Much like online panels, assisted crowdsourcing lacks agility with technology and adaptability to new audiences. Should any preemptive legislative strike result in the social networks withdrawal from the political ad market (or a dramatic shift in costs or types of exposure), a possible scenario amidst the recent turmoil surrounding the data breach leveraged by the now-defunct right-wing analytics firm Cambridge Analytica, the respondent market and methodology fine-tuned to the idiosyncrasies of respondents drawn from the social network in question, can become obsolete in a matter of minutes.
Polling companies relying on Assisted crowdsourcing have the ability to poll every political race from presidential elections to state legislative elections, and that is commendable. But, biases introduced by quota sampling, exacerbated by fine-tuned targeting algorithms of social networks, meaning that severe and uncorrectable sample bias can lead to serious polling error. In addition, the nature and extent of respondent supply are completely dependent on a legal framework polling firms have no influence over.
Random Device Engagement
Many of the tenants of RDD are commendable: calling respondents in their homes means that respondents are picked up in an organic location for getting opinions. Pollsters reach respondents where they spend time organically. That is to say, people engage in their quotidian tasks at home, get information at home, and interact with friends and family. In short, RDD gathers opinions in that natural environment. Can we fix what is broken with RDD while maintaining its strengths?
Let us introduce Random Device Engagement (RDE); it is the natural successor of RDD, in terms of orthography, philosophy, and quality.
Random device engagement (RDE) polling relies on advertising networks, or other portals on devices, to engage random people where they are. One of the most common versions of this is within advertising modules on smartphones, but it can easily be placed in gaming, virtual reality, etc. Survey respondents are asked to participate in a poll in exchange for an incentive token that stays true to the philosophy of the app in which they are engaged: For example, respondents contacted via the popular mobile gaming App Harry Potter: Hogwarts Mystery can be reimbursed for survey participation with energy points, a crucial currency of the game. Direct monetary incentives are also possible, such as the chance to win an Amazon gift certificate.
The key here is that by being able to monitor the unique identifier of the device world ad IDs survey firms can prevent fraud originating from SUMAs (single users, multiple accounts). And, RDE samples are both random and organic. This is the natural successor to random digit dialing, which aims to randomly engage with landline (and now cell) phones. In many ways, it is just making RDD generic for the future: random, device (rather than phone), engagement (rather than dialing). It addresses RDDs greatest problem: technology is always changing. It solves for this by targeting a respondent's unique ID that can be tracked across changing devices, as the future of phones is uncertain. In addition, RDE brings a plethora of telemetry or para data to the table that is amenable to bias correction, from location history to application usage.
This method has a number of advantages:
1. Fast
RDE can be extremely fast. RDD takes days (and weeks in some cases). Using social networks (assisted crowdsourcing) can be done a little faster, but still lacks speed compared to RDE. Using online panels is comparable in speed, if you pay for extra respondents from a merged panel (online panels will charge extra to get respondents from other panels to increase speed).
2. Cost-effective
RDE is extremely inexpensive compared with other sampling 12 options. The major RDE providers, like Pollfish, Dalia or Tap Research, charge 10% the cost of RDD, 20% the cost of using assisted crowdsourcing, and 25% the cost of online panels.
3. Coverage is good and growing
Accuracy is good because coverage is good. The major RDE providers mentioned easily reach 5,000,000 unique respondents, in the US market alone. And, while RDE is still behind RDD in coverage at this time, it will reach parity soon. Coverage is similar to social media-based assisted crowdsource polling and much better than with online panels. Online panels have a very small footprint, which also affects their ability to get depth in population.
4. Response rate is solid
Pollfish reports a reasonable response rate (much higher than RDD), conditional on being targeted for a poll (to completion of the survey, that is). Online panels have low sign-up rates and high drop out but do not post comparable response rates. Social media-based polling, in assisted crowdsourcing, is reliant on ads that suffer from a very low click-through.
5. Flexible
RDE is meant to be flexible with the growth of devices. It should provide a seamless experience across device types. RDD is stuck with telephones, by definition. And, RDD is subject to interviewer effects (albeit to a smaller extent than in-person surveys), meaning that tone of voice can influence considerations of the respondent, or trigger undesired interviewer respondent interactions, ultimately introducing measurement error. RDE, with its streamlined experience, is not subject to this kind of error. (Tucker 1983; West and Blom 2017)
6. Telemetry data
RDE is able to supplement collected attitudinal data with a rich array of para or telemetry data. As we know, people who answer surveys are fundamentally different than people who do not. As the progressive analytics shop, CIVIS has argued recently, a battery of nearly 30 additional demographic, attitudinal, and lifestyle questions that get at notions of social trust and cosmopolitanism is necessary to be able to weight and correct for all the ways in which survey respondents are unusual. As Konitzer, Eckman and Rothschild (2016) argue, telemetry data is a much more cost-effective (and unobtrusive) way to collect these variables. Home and work location, commuting or mobility patterns or the political makeup of one's neighborhood or social network, derived from satellite-based (read: extremely accurate) longitudinal location-coordinate data predict demographic variables well, such as race and income. And, applications on the device can more accurately describe political traits prone to erroneous self-report, such as frequency of political discussion, political engagement or knowledge.
7. RDE will get stronger in the future
Penetration of devices will further increase in the future, increasing reach of RDE in the US, and making RDE the only viable alternatives in less developed markets. Take Africa: the smartphone penetration rate is projected to grow at 52.9% year-on-year. Currently, there are 293 million smartphone users across the continent, meaning that taking into account current growth rates, there will be 929.9 million smartphones by the year 2021 in Africa. But the rosy future for RDE is not just about penetration. Advances in bridging Ad IDs with other known identifiers in the American market, such as voter file IDs, Experian Gold IDs, etc., mean that individual targeting based on financial history or credit card spending patterns will be possible. And, RDE will be able to adopt list-based polling, in which political survey firms poll directly from the voter file, large-scale administrative data detailing the turnout and registration history of 250,000,000 Americans.
8. River sampling is different, as devices are unknown
River sampling can either mean banner-ad based polling or engagement with respondents via legacy websites or similar places RDE recruits from. In contrast to RDE, devices are unknown to river samplers: River sampling usually does not have access to the Ad ID, introducing two huge disadvantages: River samples have no way to address SUMA it is possible for fraudsters to engage with the same poll twice to increase chances to win the price for participation, especially if it comes in the form of financial incentives. And, any degree of demographic/geographic (not to mention individual) targeting is virtually impossible. In addition, banner ads themselves, similar to social-media ads, suffer from disastrous response rates. Good RDE polling is done with the cooperation of the publisher, providing a native experience, while banners ads are pushed through the ad-network. This degraded user experience depresses response rates and can introduce serious measurement error.
Second, ad-networks optimize their delivery in a way that fights against the random sample. The users are chosen because they are more likely to respond, due to unobserved variables (at least to the survey researcher), that are correlated with how they will respond. As this underlying data is never shared, it is impossible to correct for by the survey researcher.
This method has some disadvantages:
Just like every other modern online survey sampling method (RDD, assisted crowdsourcing, online panels), RDE relies on non-probability sampling. There is no sample method (anymore) that has perfect coverage and known probabilities for any respondent. This is one of the reasons we have developed analytics to overcome known biases. And, RDE has bias that we understand and can overcome, and additional data points that add to the power of correcting bias, such as telemetry data that is not available to RDD. While RDD has shifting and shrinking coverage, online panels suffer from panel fatigue and panel conditioning, and assisted crowdsourcing has survey bias introduced by efficient but to the polling firm nontransparent targeting algorithms that cannot be addressed, RDE is our method of choice, and the future, in the ever-changing market of polling.
Examples of RDE
Here we review work published in both Goel, Obeng and Rothschild (2015) and Konitzer, Corbett-Davies and Rothschild (N.d.) to showcase how effective RDE samples can be. And, add examples from the 2017-2018 special congressional elections.
Example 1:
(Goel, Obeng and Rothschild 2015) shows how RDE, through Pollfish, is able to closely match gold-standard polling such as the General Social Survey. This gold-standard uses yet another method: house-calls. This is unaffordable for most research, so we have left it off of this paper, but it provides a useful benchmark.
Example 2:
(Konitzer, Corbett-Davies and Rothschild N.d.) shows how RDE, utilizing the Pollfish platform, is able to closely match RDD polling in the 2016 election (actually doing slightly better). This is an example of using RDE samples with an analytic method call Dynamic MRP. The analytics methods are detailed in their paper.
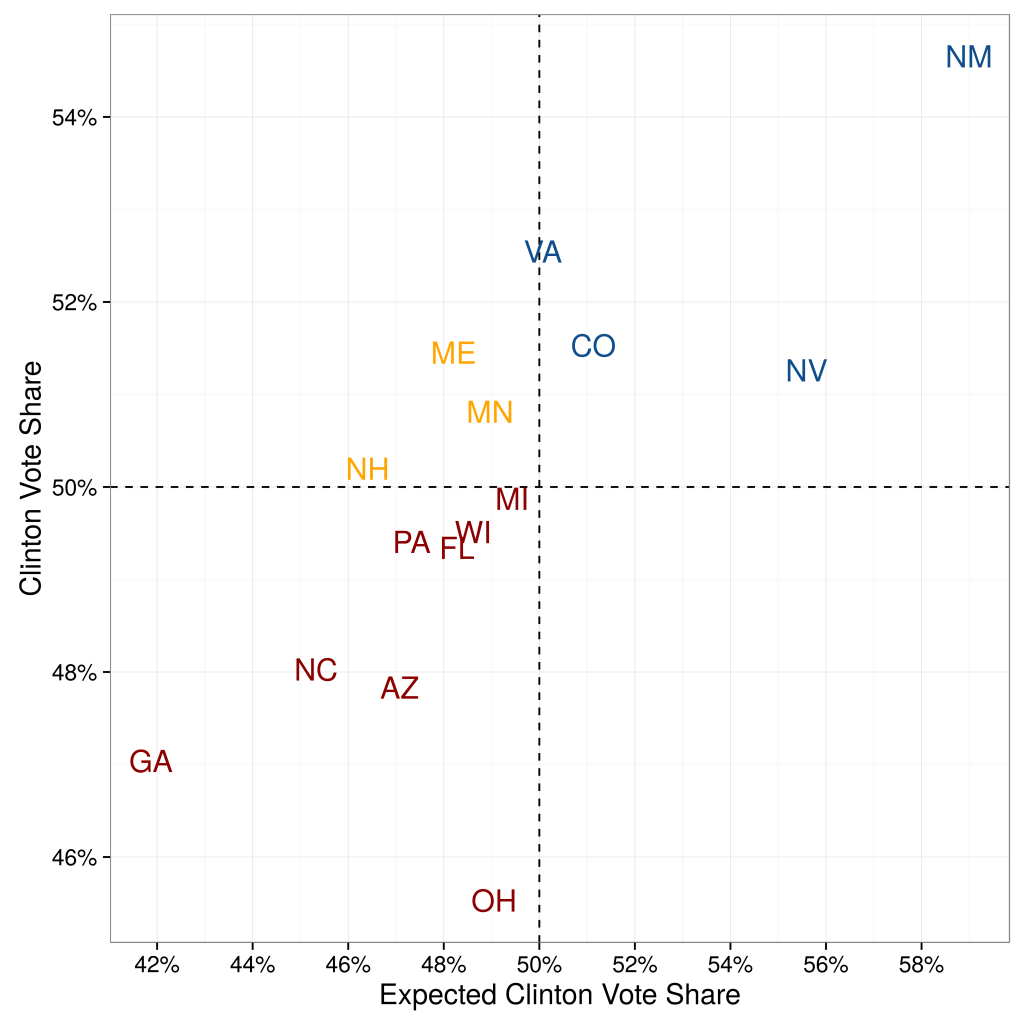
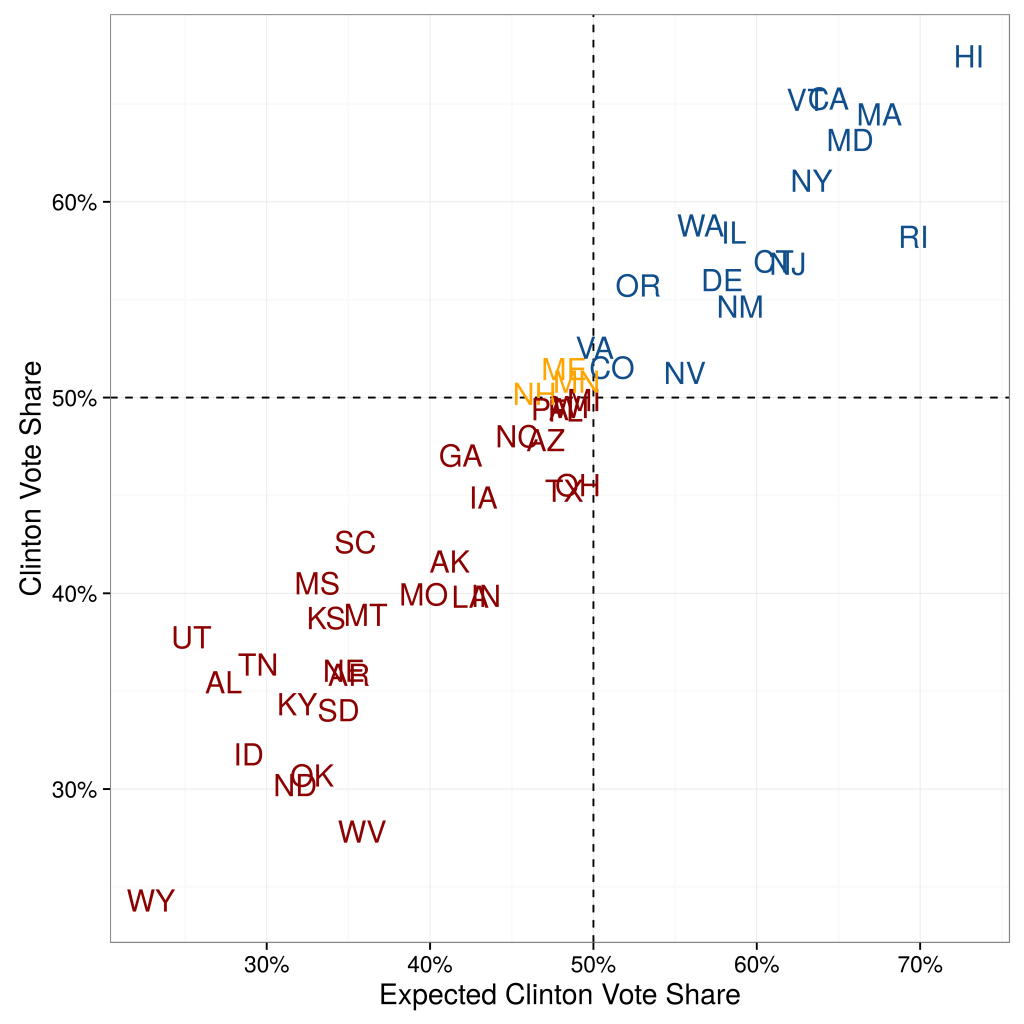
When (Konitzer, Corbett-Davies and Rothschild N.d.) quantifies their state-by-state errors, they show that their predictions based on a single poll are not significantly worse than the predictions from poll aggregators. They compare their state-by-state estimates against the actual outcome. Compared to poll aggregator Huffington Post Pollster, their Root Mean Squared Error (RMSE) is only slightly higher: 4.24 percentage points vs. 3.62 percentage points (for 50 states excluding DC).
When they focus on the 15 closest states, predictive accuracy is even higher. The RMSE is 2.89 percentage points, compared to 2.57 percentage points of Huffington Post Pollster. Overall, besides binary accuracy the RDE-based polling predictions also have a low error in the precise percentage value.
This is illustrated in Figure 1.
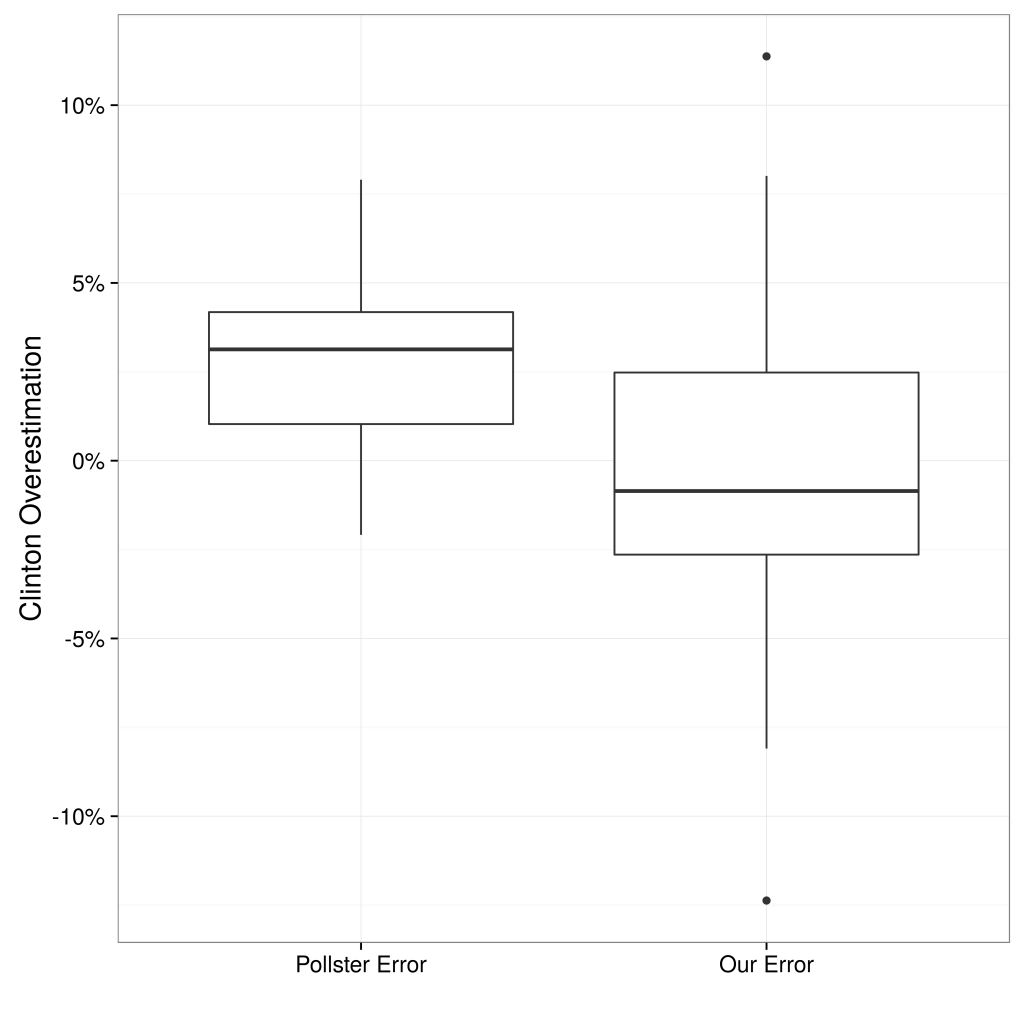
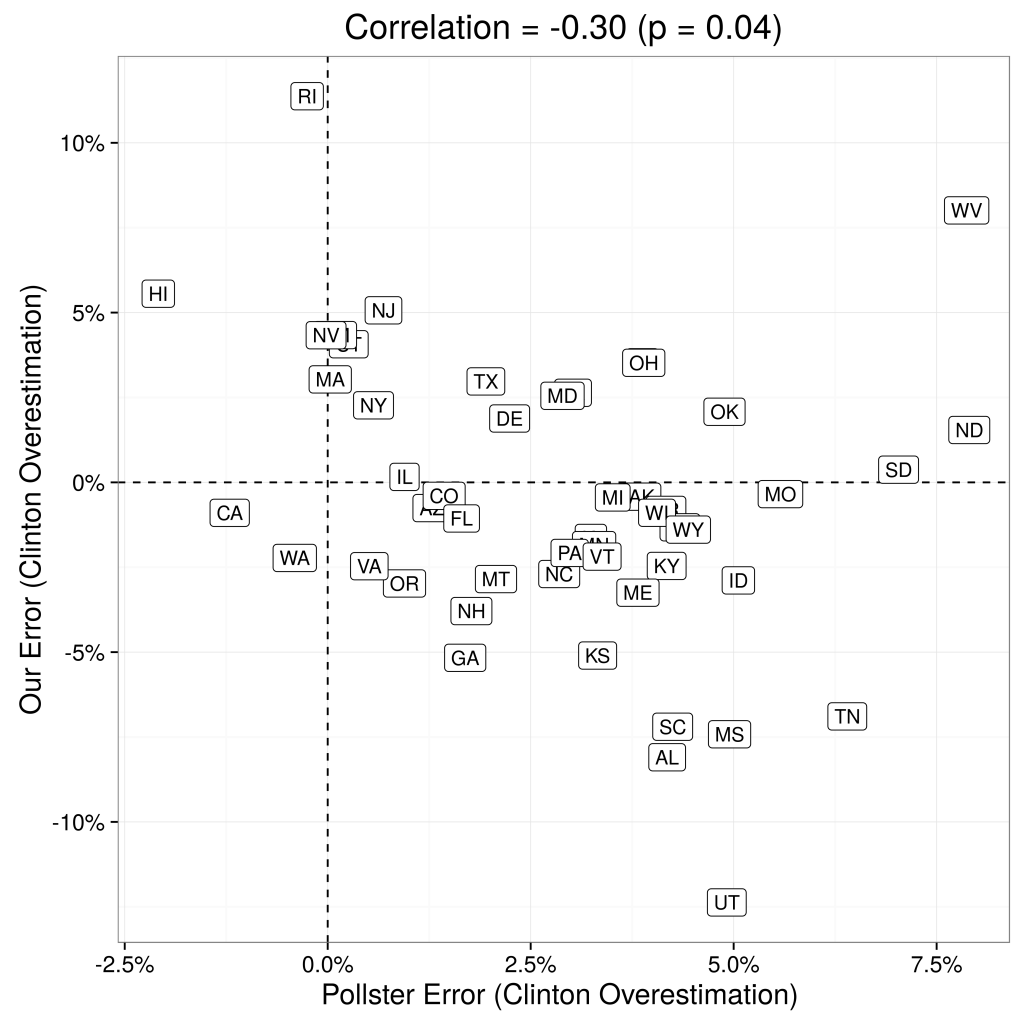
Not only are RDE-based polling state-by-state estimations fairly accurate, they also add meaningful signal to the poll aggregations. The left panel of Figure 2 displays the correlation between state-by-state errors of our predictions and the state-by-state errors of Huffington Post Pollster, and the right panel compares the distribution of errors across their approach and Huffington Post Pollster. At the very least, using RDE has significant potential to increase the quality of aggregators, as we discuss more below.
Example 3:
During the course of 2017 and 2018 polling firms have employed all three new methods in predicting Congressional election outcomes: RDE comes out way above the other two.
In this paper we outlined four methods of data collection for surveys. The first method, Random Digit Dialing (RDD), is the traditional method, working fine, but it is doomed in the next few years. Thus, the paper is really about which of the new online survey sampling methods will replace it: online panels, Assisted Crowdsourcing, or Random Device Engagment (RDE). We believe strongly that RDE is the future.