
Qualitative vs Quantitative Survey Questions
Quantitative vs Qualitative survey questions
Want a quick summary? Check out the infographic!
Research is developed using quantitative and qualitative research methods to gain a complete understanding of the target audience’s needs, challenges, wants, willingness to take action, and more. However, the right time to use either method (or use both together) can vary depending on your research goals and needs.

Difference between Quantitative and Qualitative Research
Quantitative research is about collecting information that can be expressed numerically. Researchers often use it to correlate data about specific demographics, such as Gen Z being more likely to focus on their finances than Millennials. Quantitative research is usually conducted through surveys or web analytics, often including large volumes of people to ensure trends are statistically representative.
Even when the survey audience is very large, quantitative research can be targeted towards a specific audience, usually determined by demographic information such as age, gender, geographic location.
Qualitative research focuses on personalized behavior, such as habits or motivations behind their decisions. This can be gathered through contextual inquiries or interviews to learn more about feelings, attitudes, and habits that are harder to quantify but offer important additional context to support statistical data.
When quantitative and qualitative research are paired, a complete set of data can be gathered about the target audience’s demographics, experience, attitudes, behaviors, wants and needs.
Benefits of Quantitative Survey Questions
Quantitative survey questions are an excellent starting point in market research, allowing a researcher to “take the temperature” of a population to ensure there is a want or need for a product or service before investing in expensive qualitative research.
Reaching bigger, broader audiences
Quantitative survey questions are best for gathering broad insights and developing basic profiles, validating assumptions about an unknown (or little known) audience.
Mobile survey compatibility
Mobile survey environments are especially effective when closed-ended quantitative survey questions are used, as they allow for the optimal respondent experience.
Statistical accuracy
Quantitative surveys are ideal when working with a control group or when there is a need to get survey responses from a statistical representation of a population. They can be deployed broadly and results weighted for statistical accuracy after the survey is complete.
Benefits of Qualitative Survey Questions
Qualitative survey questions aim to gather data that is not easily quantified such as attitudes, habits, and challenges. They are often used in an interview-style setting to observe behavioral cues that may help direct the questions.
Gaining context
Qualitative survey questions tend to be open-ended and aim to gather contextual information about particular sets of data, often focused on the “why” or “how” reasoning behind a respondent’s answer.
Unexpected answers
The open-ended nature of qualitative survey questions opens up the possibility to discover solutions that may not have been presented in a traditional quantitative survey. Allowing respondents to express themselves freely may reveal new paths to explore further.
Examples of Quantitative Survey Questions
Quantitative survey questions are used to gain information about frequency, likelihood, ratings, pricing, and more. They often include Likert scales and other survey question types to engage respondents throughout the questionnaire.
How many times did you use the pool at our hotel during your stay?
- None
- Once
- 2-3 times
- 4 or more times
How likely are you to recommend this service to a friend?
- Very likely
- Somewhat likely
- Neutral
- Somewhat unlikely
- Very unlikely
Please select your answer to the following statement: “It’s important to contribute to a retirement plan."
- Strongly agree
- Somewhat agree
- Neutral
- Somewhat disagree
- Strongly disagree
Examples of Qualitative Survey Questions
Qualitative survey questions aim to extract information that is not easily quantifiable such as feelings, behaviors, and motivations for making a choice. By asking open-ended questions, and following up with “why?”, respondents are given the freedom to express what led them to these decisions. A technique called the Five Whys is commonly used to determine cause-and-effect correlation. Some examples of qualitative survey questions are:
How would you improve your experience?
Describe the last time that you purchased an item online.
Why did you choose to take public transportation to the airport?
When you should use Quantitative and Qualitative Survey Questions
Whether or not you should use quantitative or qualitative survey questions depends on your research goals. Most often, both kinds are needed during different phases of a research project to create a complete picture of a market need, user-base, or persona.
When to use quantitative survey questions
- Initial research. Because quantitative research is typically less expensive or time-intensive than qualitative, it’s always best to begin with quantitative surveys using the best survey platform for market research. These can help ensure a research project is defined for the right target audience before investing in qualitative insights.
- Statistical data. Statistically accurate data, such as that which can be mapped to the census, can be collected through quantitative survey questions. This is ideal for ensuring an accurate sample in polling and national surveys.
- Broad insights. Quantitative survey questions are ideal for gaining a 10,000-foot view of a market to determine needs, wants, and desire for a product or service based on demographic data that will help shape product development or marketing campaigns.
- Quantifiable behaviors. Behavior such as how often a person visited a website page, how likely they are to purchase an item, or how much they are willing to pay for a product or service are all behavioral insights than can be gathered through quantitative survey questions.
- Mobile survey environments. Data quality can be impacted by the survey distribution method. Because mobile devices are hand-held and mobile audiences are on the go, quantitative survey questions that offer limited answer choices and quick responses tend to yield better data quality than open-ended responses that involve typing and more concentration.
When to use qualitative survey questions
- Gain context about quantifiable data. Research that begins with quantitative data might reveal an unexpected trend that requires further inquiry among a certain group.
- Understand hard-to-quantify behaviors. Thoughts, opinions, beliefs, motivations, challenges, and goals can be uncovered through qualitative research questions.
- Persona development. Personas are tools used by designers, marketers, and other disciplines to create and sell products to people based on specific motivations and interests. While these often include demographic information based on quantitative research, challenges and needs are uncovered through qualitative methods.
- Conversational environments. Focus groups and interviews are ideal places to conduct qualitative research. Disciplines like psychology and user experience research rely heavily on qualitative questions to uncover motivations and reasoning behind certain behaviors.
It is ideal to use a mix of both quantitative and qualitative methods to supplement gaps in data. These methods can be iterative and conducted at different points throughout a research project to follow up and verify different insights gathered from either method. Using both quantitative and qualitative survey questions, supported by the best market research tools, is the best way to holistically understand audience segments.
Frequently asked questions
Are quantitative survey questions good for market research?
Quantitative survey questions are an excellent starting point in market research, allowing a researcher to determine if there is a want or need for a product or service before investing in expensive qualitative research.
What are quantitative survey questions?
Quantitative survey questions are used to gain information about frequency, likelihood, ratings, pricing, and more. They often include Likert scales and other survey question types to engage respondents throughout the questionnaire.
What are qualitative survey questions?
Qualitative survey questions gather data that is not easily quantified such as attitudes, habits, and challenges. They are often used in an interview-style setting to observe behavioral cues that may help direct the questions.
Gaining context
Qualitative survey questions tend to be open-ended and aim to gather contextual information about particular sets of data, often focused on the “why” or “how” reasoning behind a respondent’s answer.
Unexpected answers
How do qualitative and quantitative questions differ?
Quantitative survey questions are used in initial research, defining a research project for the right target audience. Qualitative questions are often open-ended and help answer "why” and gain context about quantifiable data and understand hard-to-quantify behaviors.
Can quantitative research be used towards a specific audience when the survey audience is large?
Even when the survey audience is very large, quantitative research can be targeted towards a specific audience, usually determined by demographic information such as age, gender, geographic location.

How to weight your survey results in Pollfish (Video)
How to weight your survey results in Pollfish
Surveys aim to gather insights from certain populations of interest. Oftentimes, that population of interest is large and diverse, which can make it very difficult to gather enough data from sample that is representative of the whole. This is why some researchers use survey weighting.

How post-stratification works
Because research cannot always be conducted against a statistically representative sample, Pollfish created and launched the post-stratification feature. Post-stratification adds survey weighting to age and gender demographics to match what those populations should be according to the census data for that region, then adjusts the results to reflect the change.
For example, if a survey is conducted to the general population of the United States, the number of participants may skew male or female, older or younger, and not reflect the actual demographic makeup of the country. When post-stratification is applied, results are adjusted against the census data to develop a more accurate dataset with just one click.
Who should use post-stratification?
Post-stratification survey weighting is an especially powerful tool for researchers working with large, diverse populations, such as entire countries. In cases like these, it can be hard to reach a representative sample of the demographics that make up the population of interest. To ensure that the results are representative of the area, researchers can select “post-stratification” on their results page when a survey is complete and weighted data will be displayed below the raw data that reflects a more accurate representation of the audience, according to the census data for their region.
Benefits of the post-stratification feature
There are a number of ways that post-stratification survey weighting can help researchers.
- Statistically representative audience: Post-stratification offers more statistically representative age and gender data for 34 countries globally, and individually against the 50 US states and Puerto Rico.
- Rapid weighting: Researchers who need data stratification have often done manual weighting to adjust their results. Post-stratification offers a single click to view the weighted data.
- Exporting and Analysis: If you want to view or manage post-stratified data outside of Pollfish, weighted data is included as an extra column in Excel and SPSS exports.
- Income stratification: When possible, post-stratification will include weighted data for respondents’ income for audiences in the United States and Canada. It is not required for respondents to provide this information so if the field is missing, post-stratification cannot be completed.
Demographics weighted for Census data
When stratification is applied at the end of the survey, age and gender are weighted to reflect the census data of the region in which the survey was conducted. Age and gender are included in all 34 countries to which post-stratification is applicable. In the US, each state’s census data will be used automatically unless there is insufficient data for that state, in which case it will default to the general country’s population.
Income stratification is restricted to the US and Canada as the census data for income in the EU is unavailable. Income stratification is only available when a sufficient amount of data has been supplied by the respondents, as it is not a required field during profiling. If corresponding census data is unavailable for any field in the US, Canada, or the EU, stratification cannot be completed.
How post-stratification accounts for younger audiences (ages 0-14)
The Child Online Privacy Protection Act (COPPA) limits the collection and use of personal information about children (defined as those under age 13) by operators of online services. As a COPPA compliant company, Pollfish does not target audiences younger than 14 years of age, however, Census data includes information from children at any age. To account for this, we used a linear weighted model to distribute the participation of audiences under 14 years old across all the other age groups in the census.
Census data used in survey weighting
The United States Census data is available in every US state and is as recent as 2017. The information used comes directly from the American Community Survey (ACS), an ongoing survey conducted by the US Census Bureau. As the largest household survey administered by the Census Bureau, the data is continually collected and used by businesses in both the public and private sectors. It contains census data for all 50 US states, the District of Columbia, and Puerto Rico.
The census data for the EU comes from Eurostat’s 2011 population and housing census survey. The survey is conducted decennially among the 28 countries belonging to the EU, as well as Iceland, Liechtenstein, Norway, and Switzerland.
Geographic regions that support post-stratification

Pollfish post-stratification of age and gender is available in all of the following countries:
Austria
Belgium
Bulgaria
Canada
Croatia
Cyprus
Czechia
Denmark
Estonia
Finland
France
Germany
Greece
Hungary
Iceland
Ireland
Italy
Japan
Latvia
Liechtenstein
Lithuania
Luxembourg
Malta
Netherlands
Norway
Poland
Portugal
Romania
Slovakia
Slovenia
Spain
Sweden
Switzerland
United Kingdom
United States
Weighted data for North America
In the United States, post-stratification can be applied to all 50 US states, the District of Columbia (Washington DC) and Puerto Rico. Because the weighted data is based upon the ACS by the US Census Bureau, US territories (American Samoa, Guam, the Northern Mariana Islands, and the US Virgin Islands) are not able to be stratified.
Income post-stratification is only available in the United States and Canada, as the census data for the EU doesn’t include income. Because income is not a mandatory field in initial respondent profiling, it cannot be stratified if the information provided by respondents regarding it is insufficient. It will be automatically included in post-stratification results for the US and Canada if the data is available.
Post-stratification of multiple countries
Post-stratification can be applied to surveys that field to multiple countries, so long as all of the countries have corresponding census data. The responses are collected, age and gender stratified to the census data representative of the respondent’s country, and the data of all countries is merged and presented with appropriate weighting applied for a complete dataset on the results page.
Tips for using Pollfish post-stratification
Fortunately, applying post-stratification is as simple as selecting the button “post-stratification” on the results page, but there are still a couple of considerations to keep in mind when using this exciting feature.
When to use post-stratification vs quotas
Post-stratification is a powerful feature for researchers looking to ensure their raw data is representative of the general population. Using census data as a control, researchers are able to instantly weight their results by selecting “post-stratification” when the survey completes. Researchers might use this in a survey of a general population.
However, if a survey must meet a set percentage of participants from an age or gender group, setting quotas at the beginning of the survey is the way to go. Quotas may cause the survey to take a bit longer but will ensure that the distribution of respondents from each cohort is exact, rather than manipulating the data to match a percentage based on the results. Quotas would be a better fit for reaching a specific audience that isn’t representative of the general population, such as readers of a certain publication where the researcher knows the audience skews female.
Quotas and custom age ranges do not affect the stratification algorithm, so it is possible to apply survey weighting to your results even if these targeting parameters have been applied. There is no added benefit to using these together, as they both are designed to adjust data for different reasons.
Exporting post-stratified results
Weighted results can be exported in Excel and SPSS as another column added onto the regular export data. PDF export is currently unavailable.
When results can be stratified
Post-stratification is not viewable in real-time, it is only available once the survey is complete and all responses are collected. Once all results are in, they can be weighted instantly by selecting “post-stratification” on the left-hand side of the results dashboard. The stratified results will appear below the raw data.

How to use BigQuery with Pollfish data
How to use BigQuery with Pollfish data
Pollfish’s massive audience means a potentially massive amount of data to be analyzed. For clients running higher-volume surveys, our Elite plan often works best, and now it includes the ability to integrate Pollfish data directly with Google’s BigQuery database for easier, faster data analysis.

What is BigQuery?
Bigquery is Google’s answer to cloud-based data storage. It’s especially beneficial to those looking to segment and analyze large quantities of data rapidly.
The “serverless” model saves on set-up costs associated with complete server systems as well as offers high-speed updates and more opportunities to integrate with existing BI tools. BigQuery also uses a columnar storage design that makes it easy to run SQL queries with their AI optimizing the datasets in nearly real-time.
There’s no question that this is a massive aid to researchers working with high volume datasets who can’t risk their information becoming outdated in the time that it takes to process it properly.
Benefits of integrating BigQuery with Pollfish
BigQuery is where researchers can store, segment, and analyze their data from anywhere, but where they pull that information from is a different story. The tool makes this easy by offering the ability to integrate with data collection and analytics tools like Tableau, Looker, Data Studio, and most recently— Pollfish!
The Pollfish <> BigQuery integration allows us to push all existing and future survey data from your Pollfish account to your Google BigQuery database in real-time, including the survey demographics, questionnaire content, respondent profiles, and actual responses.
The implementation includes a ready-to-use query view that can be instantly applied to easily view and segment your Pollfish data.
What this means is that our Elite clients who use BigQuery can connect their Pollfish data directly to their database.
How to connect BigQuery and Pollfish
Please note that you must have a billing account with BigQuery and be on an Elite plan with Pollfish in order to integrate. Click here to visit BigQuery pricing.
- Begin by logging into your Google Cloud Platform account, or creating one if you do not have one yet.
- Go to “Console” and create or select the project that you want to use.


- From the left navigation pane, select APIs & Services—> Credential
- Once the Credentials page is displayed, select the Create credentials tab and choose Service Account Key from the listed options.


- Add a name for the service account. In our example, the account is “pollfish-bigdata-exporter.”
- Assign the role BigQuery—>BigQuery Data Owner to the account.
- Click “Create” and the service account file will be created and downloaded to your computer.


- For the last step, log into Pollfish in order to set up the integration.
- Go to MyAccount-> Integrations
- Upload the service account file (JSON) that you downloaded from your account in Google Cloud Platform in step 7.
- Enter a Dataset Name (allowed characters are letters, numbers, and underscores.)
- Select if you want to export all historical data from all your surveys or the data from new surveys only.

Keep in mind that once you configure the integration you cannot edit it. However, you are able to delete it and create a new one from scratch if you need to make changes.
How to use Pollfish data in BigQuery
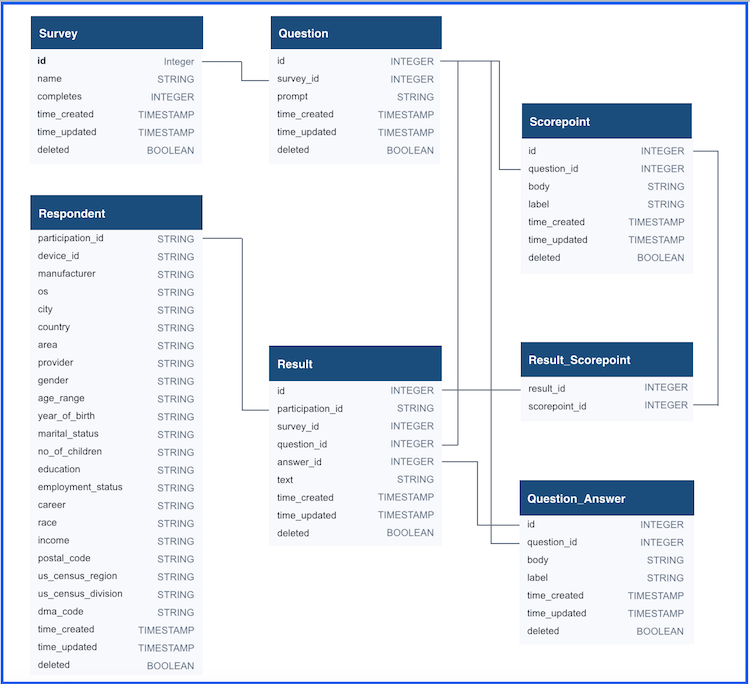
When your Pollfish surveys are exported, they will appear in seven BigQuery views: question, question_answer, respondent, result, result_scorepoint, scorepoint, and survey. Each view describes an element of the survey and the collected responses.
Note that these are de-duplicated views of the original tables that hold the data. They are shown with the same table names but start with an underscore. Do not use the tables as the tables may contain duplicates. Only use the views for your queries.
In addition, the data is generated in a single view (survey_view) showing a flat representation of the complete dataset. You may see the query that creates this view using the BigQuery UI, which may help you create your own queries in the tool of your preference, such as Tableau, Metabase, or others.
Below is a diagram showing the relationship between the entities of the exported database.
Pollfish<>BigQuery Integration FAQs
Some of the most frequently asked questions about setting up, troubleshooting, and integrating BigQuery with your Pollfish account can be found here. If you have additional questions or need assistance, feel free to reach out to support for more guidance.
- What will happen when I activate the BigQuery Sync?
- Can I get all my past surveys in BigQuery?
- Can I export a specific survey?
- What will happen if a survey is exported more than once?
- Can I see partial results of a survey currently in progress?
- I can't see the results of my survey in BigQuery.
- How are surveys stored in BigQuery?
- Where can I find all my surveys in BigQuery?
- What if I want to change my BigQuery service ID?
- Do I need to enable billing in BigQuery?
How do I get BigQuery on my Pollfish plan?
Pollfish only offers the BigQuery integration on Elite plan. Elite clients enjoy this feature at no additional cost, as well as a variety of other benefits tailored to high-volume client needs, such as additional seats for team members, lower CPIs, and dedicated account management.
To learn more about Pollfish service plans, visit our pricing page to compare options and choose the right fit for you. To upgrade your account to an Elite plan, contact sales@pollfish.com.

How to apply advanced skip logic with Pollfish (Video)
How to apply advanced skip logic with Pollfish
Advanced skip logic is a powerful feature that allows researchers to add layers to their questionnaire and go more in-depth with respondents who are the best fit for those questions.

New updates to advanced skip logic mean that instead of skipping a question or two, respondents can be directed towards a completely different sequence of questions within the same survey.
Standard questionnaire sequence
Before starting on skip logic, it's important to understand how it differs from a standard questionnaire. In a standard questionnaire, the respondent will complete all the questions asked in the order in which they are presented. If skip logic isn’t enabled, respondents will go through the regular sequence.
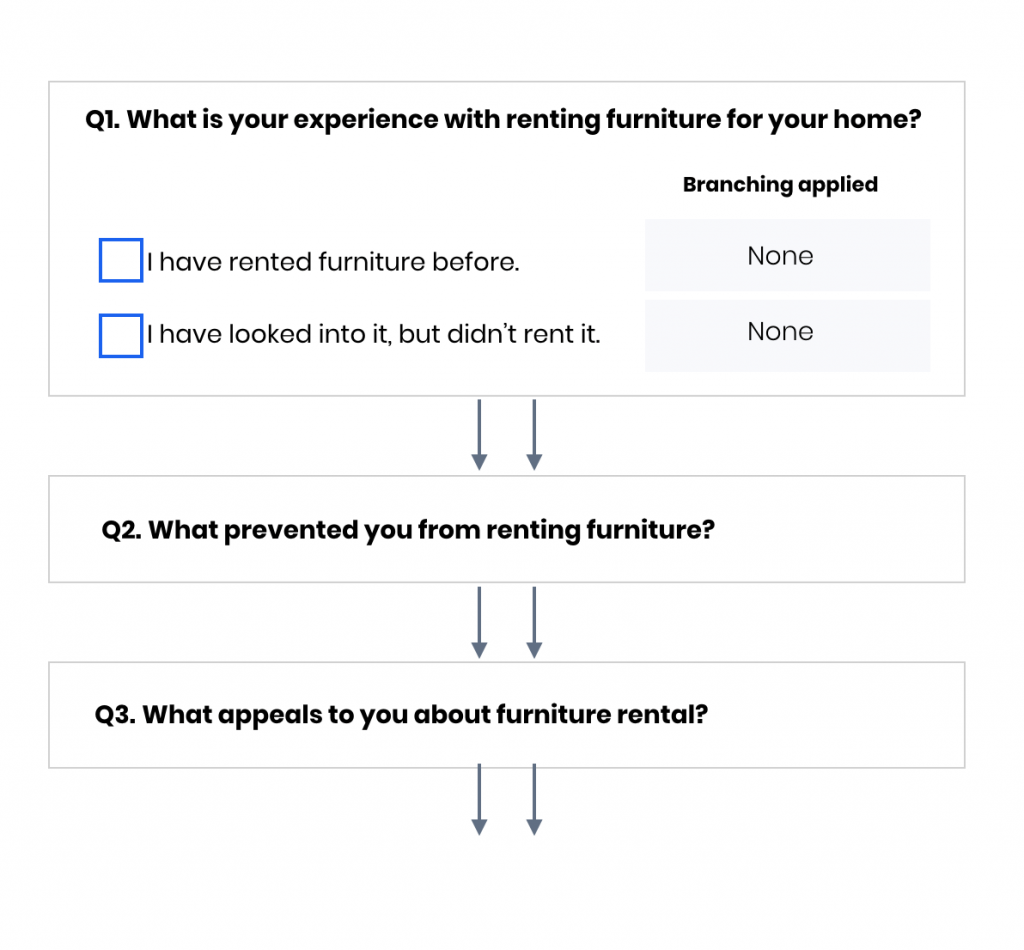
Skip Logic Sequence
Skip logic sequencing involves “branching”, which allows you to channel respondents towards different questions based on the responses they have already given. For example, if a respondent says that they have completed an action, you can allow them to skip a question that asks them to explain why they didn’t complete it.
We’ve recently augmented our skip logic, so it now features more advanced capabilities.
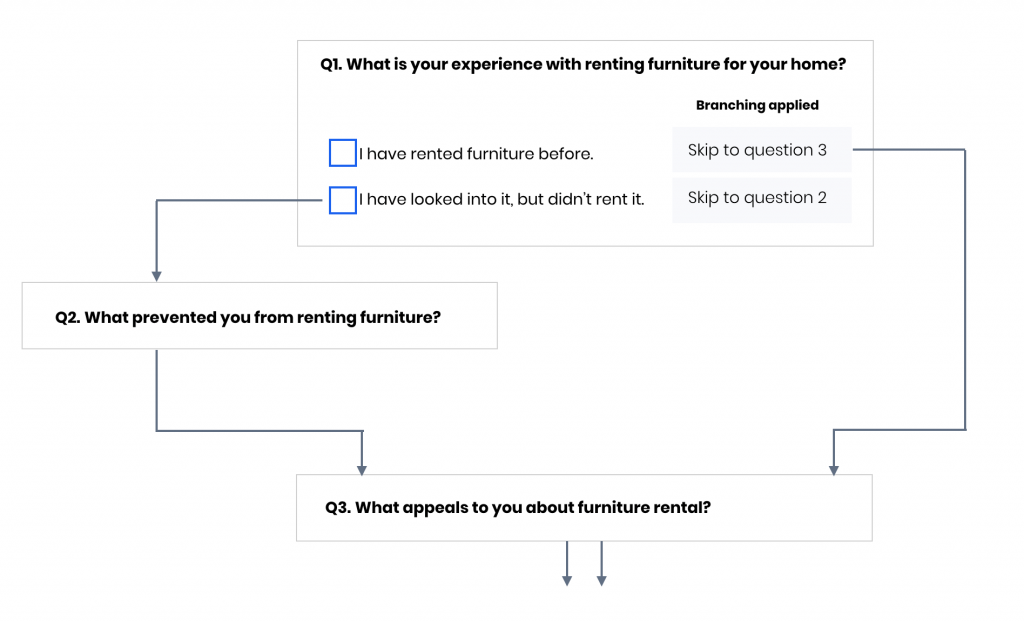
Advanced Skip Logic Sequence
Much like a standard skip logic sequence, advanced skip logic channels respondents into different questionnaire sequences based upon the answers they have already given. However, advanced skip logic offers multiple layers of branching to create a series of question paths that offer more in-depth data for researchers.
That is to say that with advanced skip logic, the system will automate respondents to jump onto a specific question based on their answer or answers (if it’s multiple-selection). The advanced skip logic iteration can be used on any question type.
As such, respondents will only be presented with questions according to what they’ve already selected, so as to not receive every question in the questionnaire or necessarily be aware of the complexities of the survey. Instead, they will only see the questions most relevant to them.
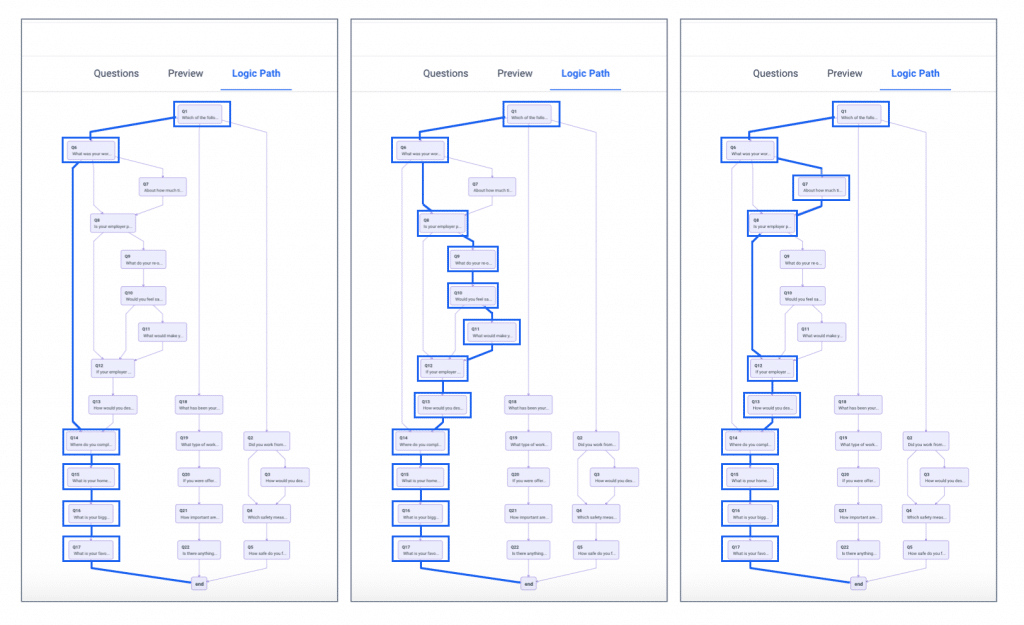 A question path is the sequence of questions a single respondent will take in a survey.
Advanced skip logic might look a bit intimidating, but is one of the most specialized and valuable features on the Pollfish platform.
Applying advanced skip logic on Pollfish
Applied logic involves the previous questions and answers used in the survey. You can also put combined logic into action, using any answer the respondent had already answered.
On the Pollfish platform, you can create this sequence yourself in your questionnaire builder. Log into your account and create or select the survey you wish to apply logic to.
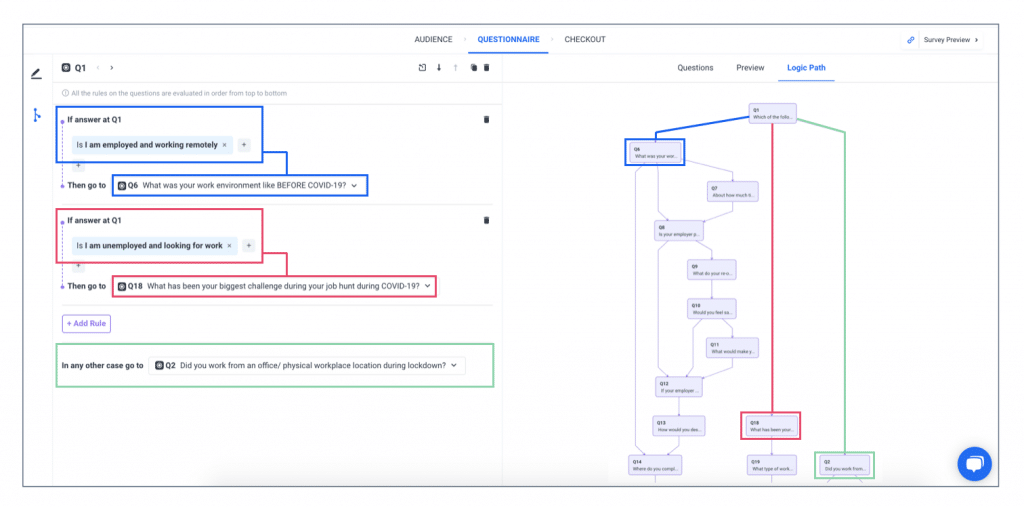
When you’re ready to add your questions, you’ll see the ‘branching’ icon on the left that lets you toggle between your standard questionnaire and skip logic views. From there you can select which question the respondent will skip to based on their responses.
In skip logic view, you can add “rules” to questions on the left and preview the logic path on the right. Rules follow if/then logic, meaning that if one thing is chosen, another thing will occur. For example, IF a respondent chooses that they are “employed and working remotely”, THEN they will be fast-tracked to Question 6.
Like all surveys, it’s best to keep your research goals in mind when creating your questionnaire and to start in a document where you can easily edit your questions. Although you can always edit and reorder them in Pollfish, particularly large or complicated surveys (such as those using multi-layered skip logic) can be easier to visualize on paper first.
Max Questionnaire Path
With advanced skip logic applied, surveys can become quite long on the backend, but respondents won’t be presented with every question. In mobile surveys, long questionnaires are at risk of low completion rates due to boredom and frustration, so we limit the number of questions a single respondent can be presented with.
The Max Questionnaire path is the maximum number of questions a respondent could possibly be presented with if they were to choose all of the possible variants in a series of questions. As a mobile-first survey tool, we uphold the respondent experience by allowing no more than 50 questions in the Max Questionnaire path.
Advanced skip logic is now available on all question types, including for ranking and matrix questions. It cannot be applied when grouping and randomization is enabled.
If you still have questions, check out our video to get a walkthrough of this great feature, or if you have additional questions about using or implementing advanced skip logic, our 24/7 support team is always here to help out.
How to use Pollfish screening questions like a pro
How to use Pollfish screening questions like a pro
The best way to learn about Pollfish is straight from the pros of the Pollfish customer experience team—a team of real people available 24/7 to help clients get the most out of the platform.
Pollfish expert Jim Theodoropoulos answers some common questions about how to best use Pollfish screening questions for surveys. Check out his expertise in the interview below, and get tips for high-quality audience targeting.
Tell us a little about yourself.
I’ve been with Pollfish for around 2.5 years. The platform is very alive, every day is different. I’ve learned a lot since my first year—the way I communicate with the clients, the things I’ve learned have changed a lot. Now I know what kinds of problems they may have and I can anticipate those to avoid future problems.
What are some things to keep in mind when creating a screening question in general?
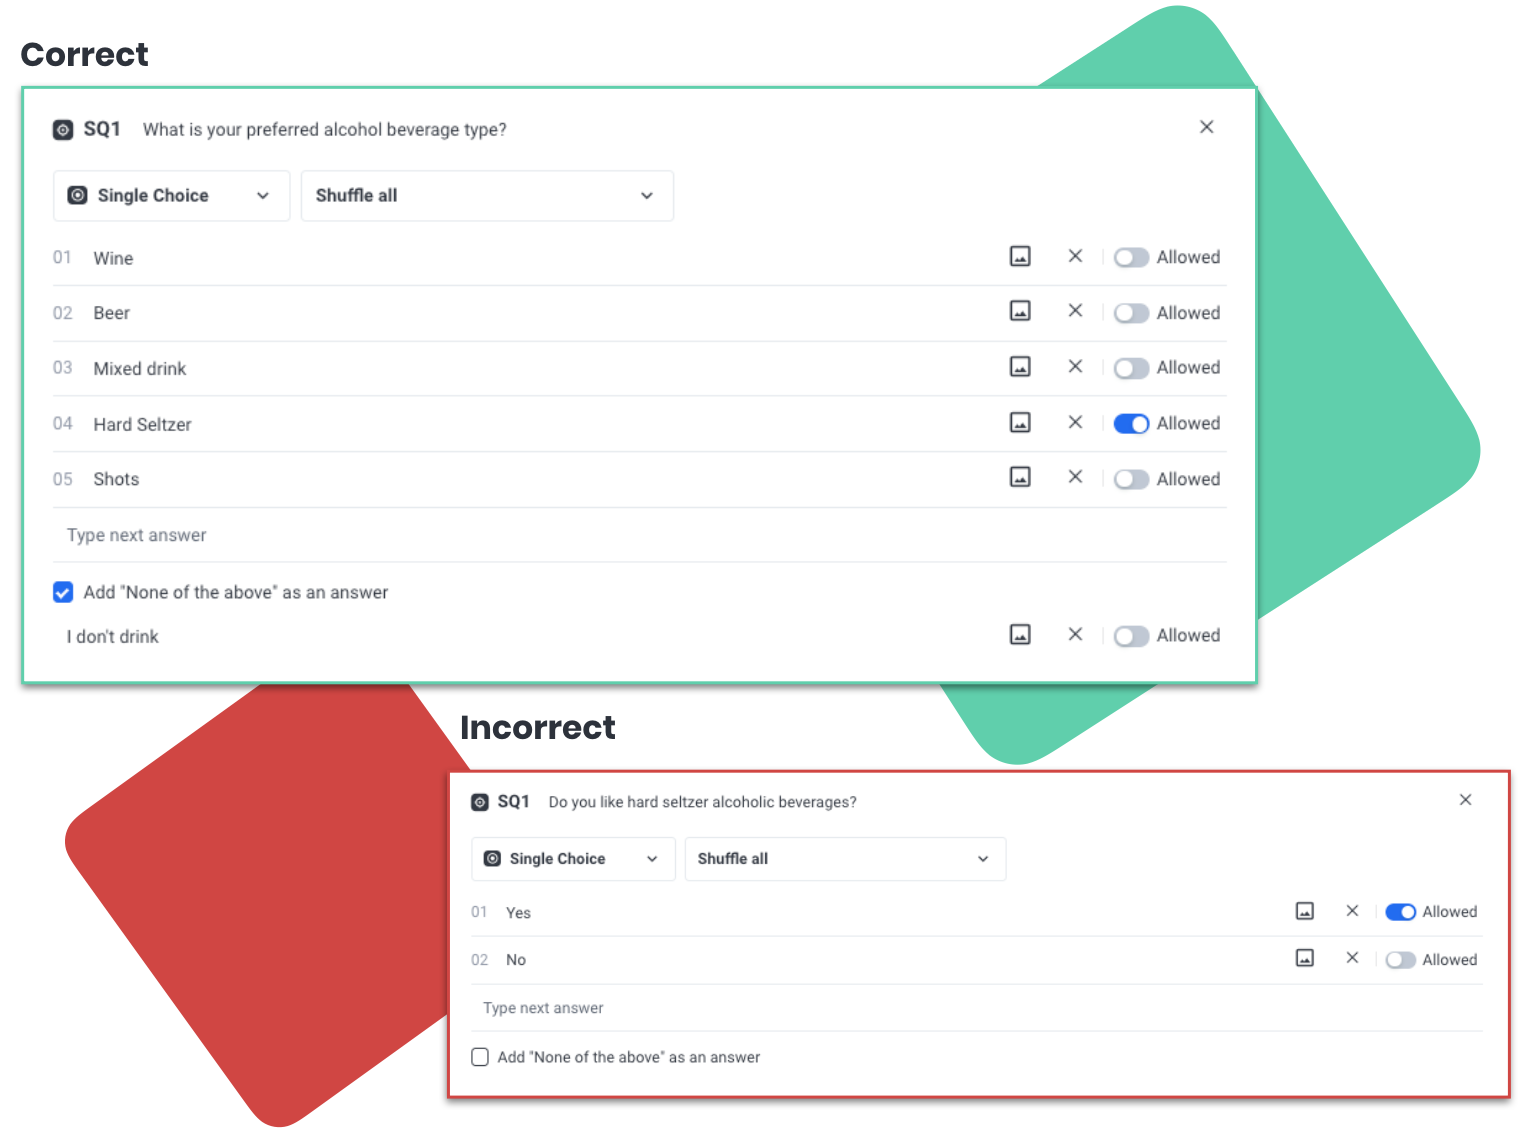
You should formulate screening questions for surveys by thinking about the words you will choose because, in a way, you’re playing with people’s minds. Consider how people will read and receive your content within the screening question. For example, people are biased towards a positive response, so “yes or no” answer options are not a good structure. It’s best to frame the question in a way where it is not clear what the “correct” response should be.
It’s really important to spend time setting it up correctly because, you know, this is your data. Even experienced researchers struggle with screening question design. They don’t realize that the design and the structure of the screening questions are like 80% of their survey’s performance.
What’s the first thing people should know about building a screening question on Pollfish? Is that different from other platforms?
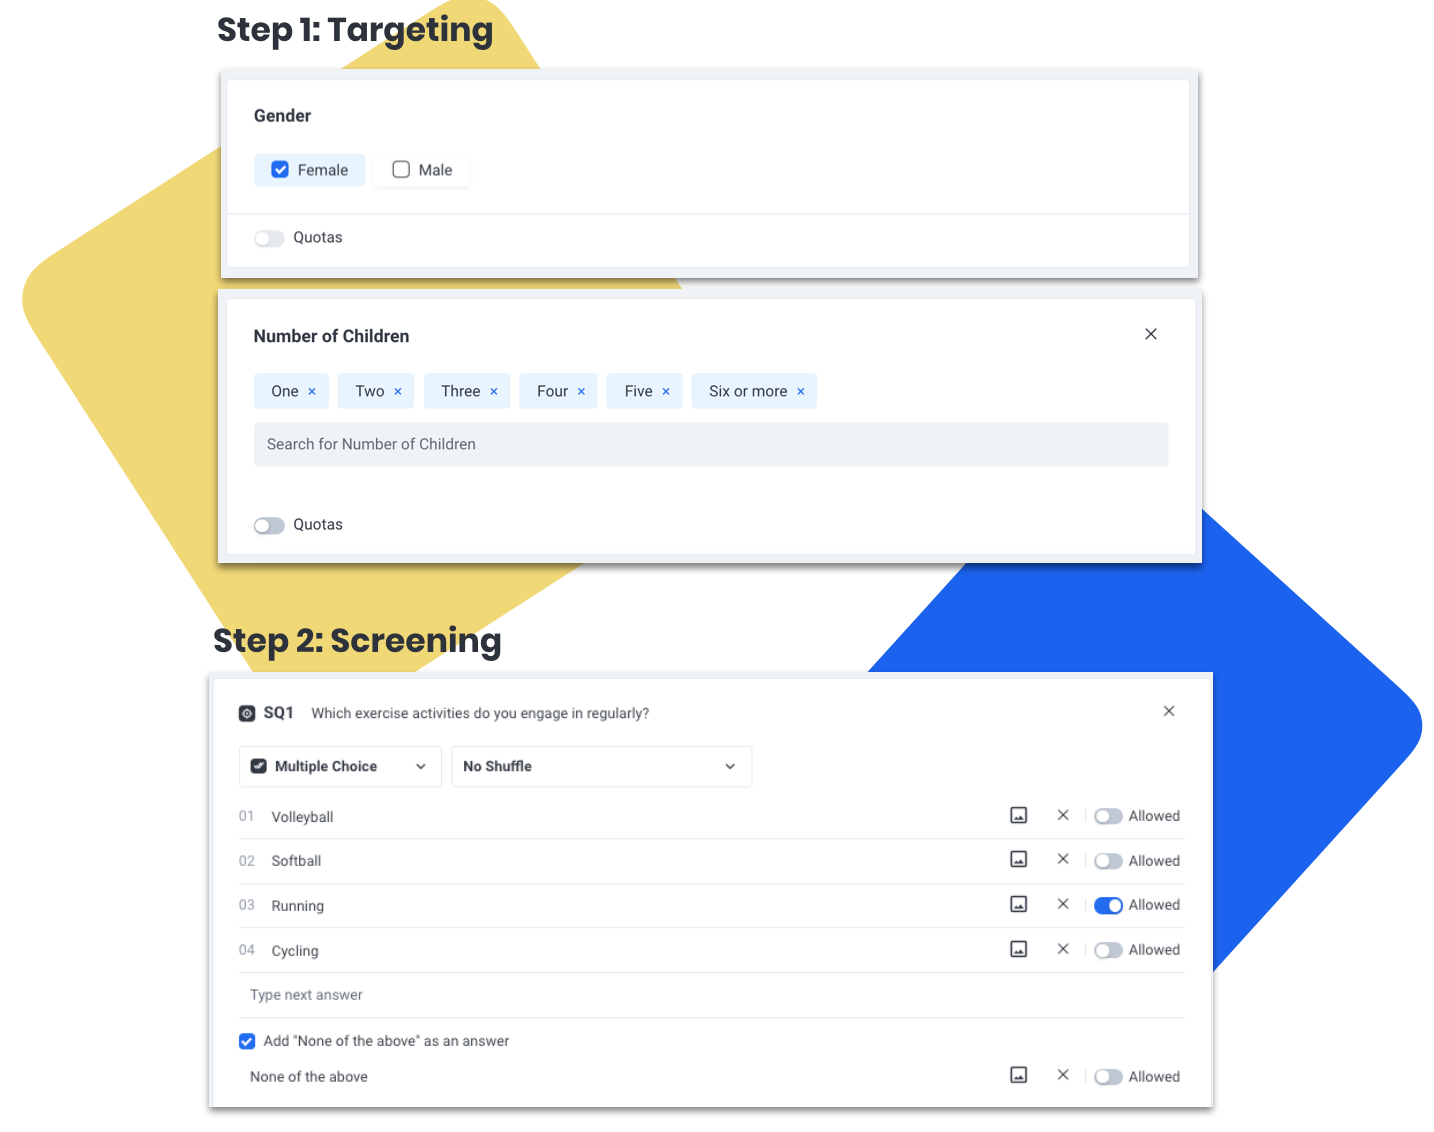
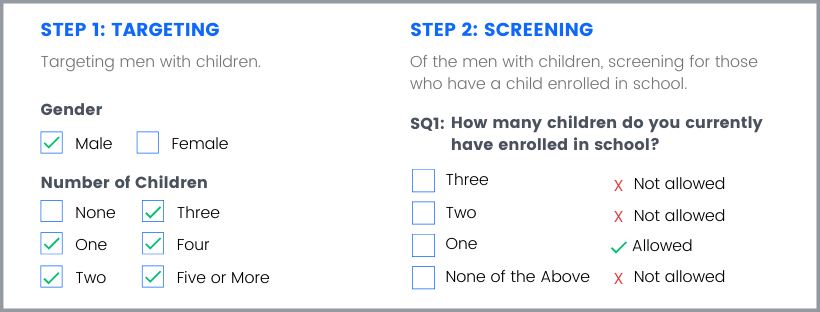
The first step in Pollfish is to set up demographic targeting. The role of the screening question is to target even further at a more granular level, so it works in conjunction with Pollfish targeting, not instead of it. It’s very important to design it so that it works together to narrow in on the audience.
For example, if you wanted to target mothers who are also runners, you need to first select the female gender and the “number of children” filter to ensure that you’re targeting mothers. This builds a qualified audience to ask a behavioral question about running. Use the screening question to ask about exercise habits and ensure that the mothers are runners.
Many researchers are used to the traditional providers, so I don’t think they realize that they need to design their demographic targeting first to first get the best broad audience possible, then from there they can screen further.
What are some misuses or mistakes you’ve seen with screening questions? What happened?
A common mistake is when people try to do all of the targeting through the screening question, without using the filters. This sends the surveys to everyone, so there will be low incidence rates and a lot of data that isn’t usable.
Another common mistake is when people use a multiple-selection screening question and do not realize that if they let respondents select other choices that they will be screened in as well. They sometimes think that the multiple-selection is multiple users selecting an answer and not a user selecting multiple answers.
Wouldn’t a good screening question end up saving researchers money in the long run?
Yes. Some researchers might think that they are saving money by not using them because the screening questions cost a little more, but they will actually cost more if they don’t set them up properly. There will be no value in their collected data if they aren’t reaching the right audience.
For example, if you’re distributing a survey asking people about cars and you’re distributing it to people who don’t drive, there’s no value in that data and it’s not a good use of money because you’re paying for responses that you can’t use.
What do you think confuses people the most about screening question creation?
Letting the wrong people enter the survey, but also what I mentioned earlier—the yes or no screening question—many people think that the platform can detect when a respondent has lied on an answer. Our fraud prevention can remove patterns and many other behaviors, but it is best to write the answers in an unbiased way to make extra sure. This is why screening questions should contain answers that are ambiguous about what we would like the respondent to choose.
Do screening questions encourage more people to take surveys?
Not really. Screening questions focus on increasing the quality of the audience entering the survey, not the number of surveys they complete. It narrows targeting on who receives the questionnaire at the beginning.
What should people do with the “incidence rate” part of a screening question?
If a client knows the incidence rate of the screening question, then they should input it during this step. If they don’t know it, that’s not an issue. Many people do not know their screening question IR. It’s dependent on their experience researching the topic. For example, if you know that a medical condition is related to a specific percentage of people, like 2% of the US general population, then you can add the IR there. This feature helps us with a more accurate calculation of how long the survey will take, but is not required to use and won’t harm the data if the client doesn’t know it.
What question types are available for screening questions? Is one better than another?
Single and multiple-choice selection are the only two kinds available on Pollfish. One is not better than the other, they’re just better for different scenarios. For example, if you want to allow people familiar with only your brand to enter a survey, single-selection is best. If you want to include respondents who are familiar with your brand and several competitors, multiple-selection can allow that.
Is there a way to do any branching with the screening questions?
Not yet, but in general, every survey should be sent to a relevant audience. So if you have two different audiences, then you need to divide your survey instead of using branching and directing them to different questions.
Sometimes people try to do too many things at once with one survey and it creates confusion or issues segmenting at the end. It’s better to create more surveys that are clear than to force everything into one.
How do you help people who have multiple audiences that they need to screen?
Sometimes the screening question applies to two or more audiences, so what I do—and I don’t know about other people—but what I do is suggest dividing the survey, and then I also calculate the total cost to allocate it to the different surveys so they know how much each will cost. I’ll also help them figure out the total responses needed for each survey to maintain a statistical sample size for both surveys. That way they can stay within their budget, but also ensure the data has value to them.
How can you be sure you’ll have enough respondents if you use a screening question?
Because we are not a traditional sample provider, we cannot tell exactly the number of people who will be available and also a fit for a screening question. If someone is available to take a survey today, they may not be tomorrow. The network of real people means there are potential respondents everywhere, taking randomized surveys but at different times. We calculate the feasibility based on past users from the network.
What do you do if you don’t have enough? Like, in the event of a very targeted screening question?
We have screening questions for surveys come through about medical conditions that can be very specialized and the incidence rate is extremely low. If the IR is too low, the survey will be stopped automatically by the system. In such cases, we first try to see if we can expand something about the targeting to add more respondents. If nothing can be expanded, then we reimburse the credits back to the account and suggest that they restructure and launch another survey.
And you guys will work with them to help them restructure and launch that second survey to make it better?
We will advise and help them understand the best ways to restructure their survey, however, it is a DIY tool so there are some limits to how much we can do for them. But we now have a professional research service so they can hire someone to join their team and build the survey for them if it’s very complicated. The researcher can discuss their specific purpose for research, then structure the screening question to be very precise for that audience. They can always bring on a research expert if they need extra help.
What is the most creative/ funny/ weird screening question you have seen on Pollfish?
I have seen a lot of stuff during these years. We have to review every question for content, and sometimes they can be pretty funny. We’re careful with the content because sometimes the audience targeting is set for minors, and we want to make sure it's okay for them. I think the most interesting questions are the political ones.
What is one piece of advice or thing you would like people to know about Pollfish screening questions?
Make sure that “yes or no” questions are avoided and use screening questions with targeting, not as a separate part. They work together to narrow the results so the targeting should be set first.
Get more information on using screening questions to reach your target audience before launching your survey, or reach out to Jim and the rest of the Pollfish customer experience team any time to help with screening question FAQs.

How to use screening questions to reach your target audience
How to use screening questions to reach your target audience
A screening question is a powerful type of survey question that can be used to narrowly target an audience based on behaviors, interests, or attitudes that aren’t available in the general demographic screening criteria.
You can connect precedent selections (even answers in screening questions) with current answers as well as redirect respondents through specific paths curated for their collected demographic characteristics (except age).

Unlike the rest of the questionnaire, these are set up at the same time as other demographic targeting questions. While things like age, gender, and location can be pre-selected in audience targeting, screeners allow respondents to self-identify with specific characteristics or behaviors, and are best used to filter for a qualified audience at the beginning of the survey.
Pollfish now supports up to 6 screeners in the elite plan.
Logic access to demographic and screener answers
If you seek to apply logic to questions targeting specific personas, you can do so in your surveys. You'll need to create a survey in which respondents view and select a product, such as a clothing item. As such, you would need to gather their gender, fit, favorite brand and the type of clothing article they prefer.
How to apply logic to questions targeting specific personas?
- Create a screening question to add the answer in the logic.
- For example, add only the respondents that like Adidas or NIke.
- Add the answer of the screener to the dropdown of the question's prompt.


- Then, you can present respondents who selected a particular answer, such as “training”, with specific curated questions based on their gender and their screener answer.


- Target specific segments of your population, such as female Nike lovers who prefer training shoes, male Nike lovers who prefer training shoes, male Adidas lovers who prefer training shoes, etc.
- Direct all respondents to get an NPS question for their screening questions' selected brand.


How to set up logic rules with demographic rules and SQ answer rules?
- Go to your screening questions.
- Apply 4 similar logic rules to Q1 for presenting respondents with specific questions, such as Q2, Q3, Q4, Q5, based on their selections to the first question.


- Choose your respondents, such as male/female Adidas fans who prefer training shoes.
Best practices for writing screening questions
Like all good survey questions, screening questions should be clear, concise, and unbiased. However, these have a few challenges specific to their question type.
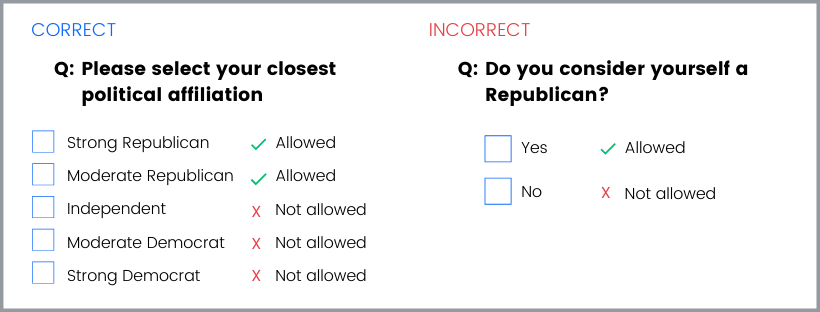
Avoid “yes” or “no” answer choices
While it can be tempting to build survey screening in a “yes or no” format, this creates bias within the question. Respondents are more likely to choose a response that is positive or that will obviously allow them to complete a survey. It’s best practice to create questions with multiple answer choices where it is not clear which is the desired response. This encourages respondents to answer honestly, rather than to choose something that they think will move them forward in the process, and you will end up with a more qualified pool of respondents.
Use question types correctly
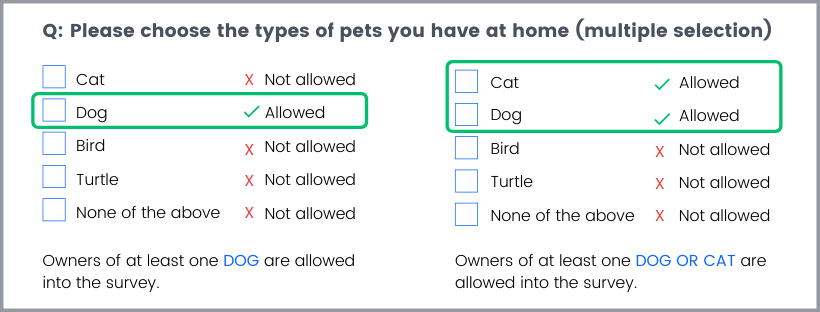
Screening questions can be single or multiple-selection. It’s important to know that answers that are “allowed” mean that respondents who select them will be able to participate in the survey if they choose any of those responses. In the “dog owner” example, users may select ownership of more than one pet, but will not be screened in (allowed to take the survey) unless at least one of those pets is a dog. If “cat” were also allowed, then any respondent who chose “cat” or “dog” along with a combination of other pets would be screened in.
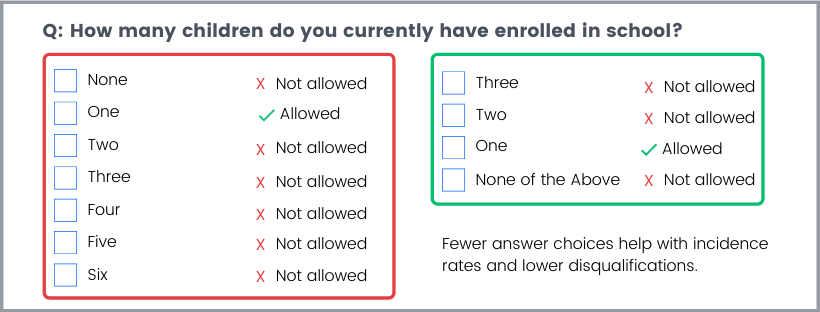
Limit answer choices
If you’re screening for a very specific answer, don’t provide many additional options that will be screened out. Disqualifying answers is how the incidence rate is determined, and a low incidence rate suggests a narrower, harder-to-reach audience. Many survey tools charge more for lower incidence rates, as this audience will be harder for them to provide. (Pollfish doesn’t charge a premium for incidence rate, however, if the incidence rate falls below a certain percentage, the survey will be stopped automatically and adjustments will need to be made).
Single and multiple selection answer qualifications
We now offer more flexibility for qualifying and disqualifying respondents in the screener. You can qualify and disqualify respondents through both single and multiple selection questions, based on the answers. There are three options that grant you this flexibility:
Disqualified: The respondent cannot take the survey.
Qualified: The respondent can proceed to the next screening question, or if it's the final one, to the survey.
Disqualified unless it's accompanied with at least 1 qualified: The respondent's disqualified answer will render them disqualified, unless, they're in a multiple-selection question and also choose a qualified answer. Then, they can proceed to the next screening question, or if it's the final one, to the survey.

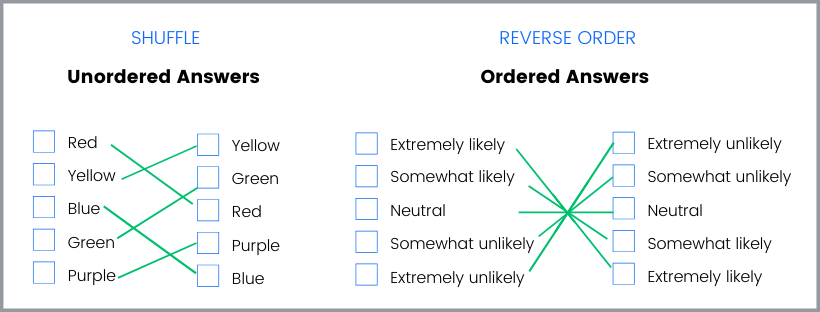
 Remember to shuffle answers
Like regular best practices for writing good survey questions, screening questions should be shuffled when they offer an unordered set of answers to select from. If the answer choices are ordered, such as those presented in a Likert Scale, reverse the order to provide some randomization, but maintain the order so as not to confuse respondents.
Don’t overuse
Screening questions are powerful when used correctly, and are a great way to narrow in on behavioral attributes that can’t be achieved through regular targeting. However, when too many screening questions are applied, the incidence rate drops, respondents can become confused, and ultimately results will suffer as the audience becomes less representative of a total population. Try to use as few screening questions as possible to maximize your survey’s reach, ideally fewer than 3 screening questions.
Don’t use them if you don’t need to
Screening questions are to be used as an additional layer of targeting but should not be used instead of the regular targeting parameters. Demographic targeting filters are more easily segmented and controlled than self-reported behaviors in screening questions, and allow a broader audience to reach with your survey. Make sure you check all of the available targeting filters on a survey and use them first, then add a screening question (only if necessary) to supplement the targeting criteria.
Benefits of using screening questions
Screening questions provide a number of benefits. When designed properly, survey screening can reduce overall cost by eliminating respondents from the survey early on who do not fit the criteria. They’re especially great for businesses looking to reduce cost on research overall by limiting the amount of unusable data.
The most common uses of screening questions are to identify populations of interests that:
- Share a similar opinion
- Behave in specific ways
- Have similar experiences
Brands, agencies, and other businesses commonly use screening questions to identify audiences that are loyal to competitors, desired behaviors (such as frequently purchasing a type of product), or to survey their current target audience on new features, packaging, or products.
To learn how to use screening questions for the most effective targeting on the Pollfish platform, you can check out our expert tips from the customer experience team.

How to find survey respondents
How to find survey respondents
You have questions that need answers, all you need now is an audience to complete your survey. But how do you find survey respondents? And how do you make sure they are a good match for the questions you will be asking?

We’ll dive into the pros and cons of some of the most common ways of finding survey respondents that should be considered before choosing the best approach for you.
Harness the power of social media
Most people have one form or another of staying connected digitally, whether it’s Facebook, LinkedIn, Reddit, or others. Consider that each of these places offers a built-in audience that you can survey.
Pros
- Social media audiences are free to reach out to.
- There’s no limit to how many potential respondents you could have.
- Some platforms, like Instagram, offer quick polls that may work for quick, simplistic surveys.
Cons
- Social media was not designed for survey distribution, and your network is not large or randomized enough to serve as an accurate sample audience.
- Targeting is extremely limited. Even if you join a group that is specific to your survey (for example, if you want to reach parents of toddlers, you may join a group for mothers sharing parenting tips), you will run into audience bias, as those who are actively supporting a brand or idea on social media tend to be more vocal than the average member of the group.
- No control. You won’t be able to verify information about who takes your survey, or how many times. If your survey is a link, respondents could share or email it outside of your desired target market.
- Limited functionality. Even using proprietary survey abilities, like Instagram’s polling feature, you're limited in what you can ask. The platform is not complex enough for a full questionnaire or nuanced reporting.
Do-it-yourself with survey research tools
DIY research tools are one of the easiest and most affordable ways to reach respondents at scale. Most come with the option to buy responses from an audience as part of the package, and there are many different survey tools to choose from based on your needs.
Pros
- DIY research tools find participants and manage the distribution for you, which takes all the work of finding respondents off your plate.
- Most of the tools available are incredibly affordable. Services like Pollfish begin at just $1 per completed response and results can come in less than a day.
- Targeting is MUCH better than any comparable option for this price point. Survey tools vet respondents to verify demographic information, ensuring that surveys are matched to the right audience.
- There are many more question types, meaning you can gather data from a variety of different angles. Customize your questionnaire to specific respondents using branching or add media to offer better context.
Cons
- If you’re not well-versed in research, some survey tools can be harder to use. Choose options that offer live support when possible, to help you through tough spots.
- Although many DIY survey tools are affordable, they do come with a price tag. Make sure you know how much your survey will cost before you launch, and don’t get tricked by survey tools that charge for the audience and the questionnaire builder separately.
- Delivery method is important with DIY surveys—make sure your tool lets you meet respondents where they are: on their smartphones. Mobile survey delivery ensures broader reach and faster results than other methods.
Buy a list of email addresses
Buying a list is an older, email-based approach to conducting surveys. You can buy a list of email addresses from a company that specializes in building these based on psychographic or demographic criteria and manage the distribution of it yourself.
Pros
- Email lists for B2B audiences can be targeted to specific titles and companies you’re looking to reach.
Cons
- Email lists are expensive, slow, and require a lot of collaboration with the company you bought them from to distribute the survey.
- That B2B audience you paid a premium for? They’re getting too many emails as it is. The odds of them responding to your survey are extremely low.
- If you’re reaching an audience in Europe, list-purchasing will violate the consent rules of GDPR, which could result in significant fines.
Pay-per-click
You can pay for distribution methods to get your survey in front of more people. Google AdWords or sponsoring your survey on a social media post could broaden your audience digitally.
Pros
- You will broaden and randomize the reach of your survey beyond what you would be capable of using social media or emailing a list.
- You have more control over targeting than you would with social media or an email list (although not more than DIY Survey tools)
Cons
- You’ll get a lot of impressions, but PPC cannot promise click-through rates.
- Expect to pay a lot for clicks when you get them, whether it’s the audience you want. PPC cannot guarantee that the audience you targeted is the only people who will try to complete the survey.
Hire an agency
If all else fails, you can always hire a market research agency. MRAs are made up of professional researchers who can hold your hand through the process, which may be necessary for especially complex projects.
Pros
- You can be completely hands-off. The agency will find survey respondents and manage the entire process for you.
- You’ll have the expertise of professional researchers leading your project, which might be worth the price tag for an especially complex research initiative.
- Your results will be packaged nicely. Instead of allowing you to be overwhelmed by analytics, your research team will present a report of the findings.
Cons
- Like all agencies, MRAs come with a heavy price tag. Expect to pay a premium for high-touch service.
- MRAs are slower than other options. Depending on the urgency of your project, this may not be feasible, especially when instant insights are available.
- Expect a contract with your agency and be prepared to take on the cost and risk of signing on for a full project.
Survey respondents are everywhere if you know where to look. Remember to always consider not only the size of the audience but the ability to reach a specific segment that is representative of the target population for best results.
Pollfish reaches an audience of over 670 million real consumers engaged on their mobile devices, with advanced targeting and distribution all in one. We’ll help you find a global audience for your survey and get professional support along the way.

How to write good survey questions
How to write good survey questions
Good survey questions lead to good data. But what makes a survey question "good" and when is the right time to use specific types?

At Pollfish, we have distributed tens of thousands of surveys and manually review them all, so we know a thing or two about writing good survey questions. Our experts have compiled a list of the essentials below into a sort-of questionnaire template to make sure you have what you need to create great surveys and get the highest-quality data.
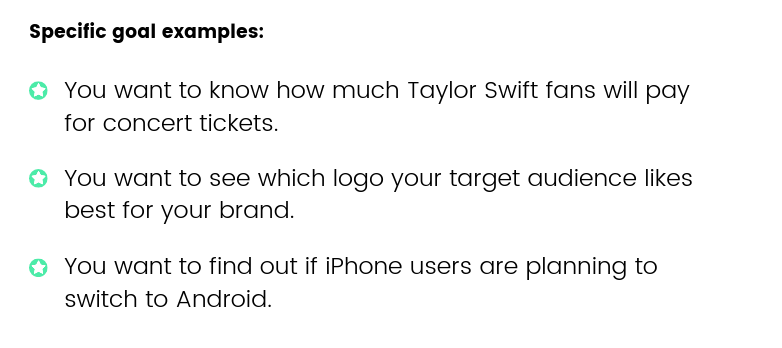
1. Have a goal in mind.
Consider what you’re trying to learn by conducting this survey. Do you have an idea that you want to validate, or are you hoping that you can disprove an assumption under which you have been operating? Surveys work best when they focus on one specific goal. When building the questionnaire for your survey, it is important to offer questions that support your goal.
2. Eliminate Jargon.
Just because a concept is clear to you doesn’t mean your target audience is always on the same page. A well-designed questionnaire contains good survey questions to be sure. But they also use plain language (no jargon) to explain concepts or acronyms that customers may be unfamiliar with and offer an opt-out for those who are unsure. Don’t be afraid to use more than one question or offer an example to ensure clarity on complex information in your questionnaire template— a confused audience leads to frustration and low-quality responses.
3. Make answer choices clear and distinct.
When multiple-choice answers are presented, the respondent must make a selection. If these responses overlap or are confusing for the respondent, the quality of the data decreases because they aren’t sure what is being asked of them. Make sure answers are distinct and specific whenever possible so the respondent can confidently choose the best answer.
4. Give users an “other” option.
Make sure that, in a multiple-choice sequence, you’ve given respondents the chance to opt out of the question if it doesn’t apply to them or if none of their answers fit. Provide an option like “no opinion,” “neutral,” or “none of the above.” You can also offer the option to select “other” and provide an open-ended response that can give you more context.
5. Avoid “yes/ no” screening questions.
Screening questions help you connect with a qualified audience at the beginning of the survey. When respondents select a qualified response, they will enter the rest of the survey. However, people are biased toward choosing “yes” or a positive response when presented with a yes/ no question, even if their real opinion is more neutral. To reduce bias, provide a list of answer choices with no indication that one is preferred over the others.

6. Don’t ask two questions at once.
Each question should focus on obtaining a specific piece of information. When you ask two questions at once using “and” or “or,” you’re introducing another question, which may have a different answer. This will have one of two results: either you’ll confuse your respondents, who are forced to choose the right answer to one question; or your respondents will confuse you with their answers. Either way, make sure you write simple survey questions asking for separate pieces of information as separate questions.

7. Use skip logic when applicable.
Skip logic, or branching, allows you to create multiple question paths based on an earlier answer. This means more qualified respondents will be asked to answer more in-depth questions and reduces answers like “don’t know” or “no opinion” later.

8. Use different question types.
Respondents offer better and more thoughtful answers when they are engaged. And that means asking several types of research questions. Use ranking, matrix, open-ended, or multiple-choice questions to stimulate them and keep them interested, especially in a longer questionnaire. Different question types not only keep the respondents engaged (which can increase your completion rates) but can also elicit different responses.
9. Shuffle answer choices for ranking, matrix, and multiple-choice questions.
We are naturally inclined towards the first information we are presented with—the top answer— in a series of answer options. Shuffling the order of the answer choices reduces bias in responses. However, for answers that relate to one another—such as a Likert scale or timeline—it’s helpful to keep them in an order that flows logically to avoid confusion or misreading.

10. Add media or images to provide helpful context.
Media—such as images, video, or audio clips—provides another level of clarity to your survey questions. You can use these either to give added context to the question or offer media as an answer choice.
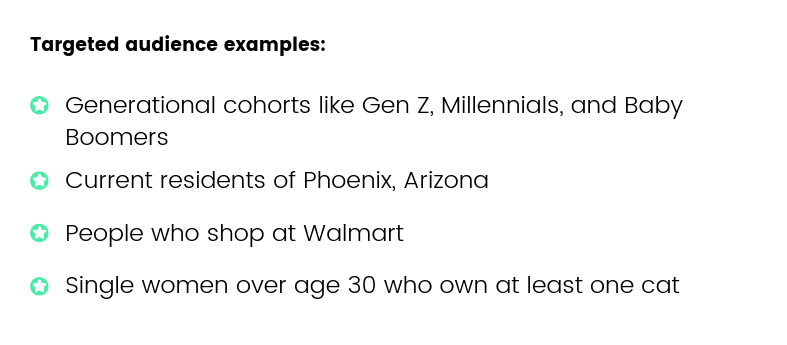
11. Always keep the audience in mind.
Remember as you are writing the questions to always keep your target audience in mind. The audience can be as broad as the “general population” or as narrow as you need it to be. The important thing is to know who you want to target so you can communicate with them effectively.
Regardless of the types of survey questions you select, questions should be short, clear, and to the point, but also engage the respondent through multi-media and question types. Remember that the less confused your respondents are, the clearer your data will be.
These best practices will help you write good survey questions on any platform, including our own. If you have additional questions specific to Pollfish, check out our resource center or reach out to our Support team to learn more.

Single-selection question design
Single-selection question design
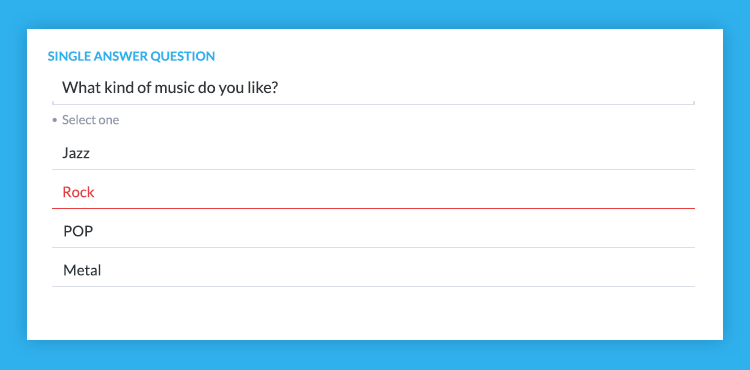
Single-Selection, or Single Answer Questions are questions where a user is asked to pick only one answer from a pre-determined set of responses of two or more options. They are one of the most common survey question types and are effective in determining a user’s primary preference among a set of choices.
The most common single-selection questions are multiple choice questions, where users are given a list of responses and asked to pick the best answer.
Why are single-selection questions so popular?
- They close the responses—you provide answers that a user may not have thought of.
- It's easy to analyze their results quantitatively
- They're easy for participants to respond to on mobile devices and stay engaged.
Single-selection and multiple choice questions: Examples & Best Practices
How to write multiple choice questions
Traditional multiple choice questions (like you might find on the SATs) contain 3 parts: the stem (the question or incomplete statement), the correct answer and the distractors.
In mobile market research surveys, multiple choice questions can be used to gauge user opinion.
Multiple choice survey questions are popular for several reasons:
- Everyone has seen them before so there is no confusion as to what to do.
- They are easily consumed on mobile.
- They make reporting very easy.
Just like with traditional multiple choice questions, you need a stem. But there is, of course, no correct answer, just opinions, so all answers hold equal weight.
When creating a stem, create a question with a single-select answer. You want to ensure that there is no ambiguity where someone could select multiple responses, as this creates confusion and results in incomplete results. You can also write an incomplete or "fill-in-the-blank" statement and have the user select the blank.
There are many different kinds of multiple choice questions, but single-selection questions provide straightforward responses that are easy to work with once data collection is complete.
Yes/No answers may be polarizing
Provide limited insights depending on the question. You can offer more than two answer options, including:
A) First Answer
B) Second Answer
C) Third Answer
D) Fourth Answer
Don’t offer too many choices
This will force a user to scroll or take time to compare an answer at the bottom of the list with one from the top—you want the most natural response possible without a user “speed-selecting” the first answer choice as a result of researcher or participant bias.
Scale questions work well on mobile
Another popular type of single-selection question is a Likert scale question. These questions allow users to select from a scale of responses, indicating their feelings towards customer satisfaction. These question types tend to provide the best experience on mobile, for example:
Strongly Agree
Agree
Neutral
Disagree
Strongly Disagree
Single numerical values vs number ranges
You don't have to stick to single numbers. You can ask users to choose between numerical ranges. Just be sure not to “overlap” answers, as this can confuse the respondent:

Considerations for designing a mobile survey
Answers to single answer questions should be shuffled, or randomized where appropriate to remove some of the survey bias and ensure that the participant is selecting the best choice. Researchers tend to write answers in the order they expect them to be answered, and respondents tend to choose the first answer they are presented with.
With Pollfish, there is also the ability to anchor the last answer, by selecting “Shuffle but keep the last one fixed”.
There are times when you do not want to shuffle answers, such as when asking for a numerical response.
You may want to employ a technique of asking single-selection questions in a slightly different way in your survey, to validate that the responses are consistent, reliable, and credible.
If you already have a list of answer choices, batch answers can speed your survey design and avoid the hassle of typing individual answers one at a time. If you have the list on separate lines in an excel sheet, word doc, or similar, simply select “Add batch answers” and cut-and-paste your choices from your source document.
Advanced Tip: If you want to copy the answers from a previous question you created, select “Add batch answers” there and the pop-up window will have your choices available to copy and paste.
wp-faq-schema]

How to run effective consumer surveys
How to run effective consumer surveys
If you want more customers, it is worth listening to the feedback provided by the ones you already have. Discovering and understanding what they think about your product/business/brand is critically important to successfully scale your business.
One way that you can find out how your customers are feeling is through surveys. With consumer surveys, you will be able to gather valuable information about their experience and can adjust accordingly. This will be effective in the long run, as listening to customer feedback will inevitably lead to improving people’s experience and creating a loyal customer base.
Surveys can give you the information to help you improve the experience of existing customers but can also help you decide the best way to reach new customers in the future. By finding out how you are viewed by your customers, you can adjust and adapt to create a better experience for everyone. Here are a few tips for writing the most effective customer feedback survey:
Construct a short, yet compelling invitation
The invitation is often the make-or-break factor in deciding whether the recipient clicks through to and completes the survey. Keep this invitation as brief as possible—but without leaving out key details. Make sure that the recipient knows it is coming from your company and briefly explain what the survey will be about. This will be effective because it will refresh the customers’ minds and increase the chance of getting better results.
Keep it short
No one wants to waste their valuable free time answering hundreds and thousands of questions about your company. So, keep your survey concise without sacrificing your goal. Do this by losing unnecessary questions and by making the questions you use specific and useful.
Optimize for mobile
Over 50 percent of most demographic groups have a smartphone, and this number is only increasing. Since the average person checks their phone up to 150x a day, chances are you are going to connect with your audience a lot sooner than on other platforms. By optimizing for mobile usage, your mobile survey will reach more people, and by extending the reach of your survey, you will also get survey responses faster. There is no better way to connect with consumers in the 21st century than reaching them where they are most accessible: on their mobile devices. In this way, you can reach existing or potential customers and learn what they think within hours of creating your survey.
Offer incentives
Depending on your audience, offer incentives or prizes for completing the survey. Incentives undoubtedly lead to more and faster survey responses, but they also occasionally lead to rushed answers and incomplete submissions. Make sure the incentive correlates with the survey and the targeted audience. If you have crafted a compelling invitation, your survey response rate should increase on its own. However, everyone appreciates added incentives.
At Pollfish, you can create custom consumer surveys to find out exactly what your customers think. For example, you can attach videos if you want consumer feedback on a new advertisement. You can also add targeting if you want to find out what a certain demographic of your customers thinks about certain issues.