
How to use surveys for competitive intelligence research
How to use surveys for competitive intelligence research
Creating useful, desirable products and services are necessary for any business to succeed, but they also need to stand out against other companies that are offering comparable options. Competitive intelligence research can help them learn what they need to know to present their unique values to become leaders in their market.

What goes into competitive intelligence research?
Competitive intelligence research can include gathering data on competitors, both direct and analogous, customers, market opportunities, products offered, and environmental factors influencing business decisions (such as location).
All of this data can be used in competitive analysis to reveal where there are gaps in their business strategies, messaging, marketing, or customer satisfaction in order to pivot and take advantage of opportunities in the space or correct areas that are working against them.
Members of the company take this information and use it to inform strategic business decisions.
Cost-effective competitive research
There are plenty of ways to start your competitive intelligence research for free. Industry reports that show trends in your market, public forums or review sites where customers are expressing positive or negative experiences with a product or service, or even a simple trip to Google are great places to begin your process.
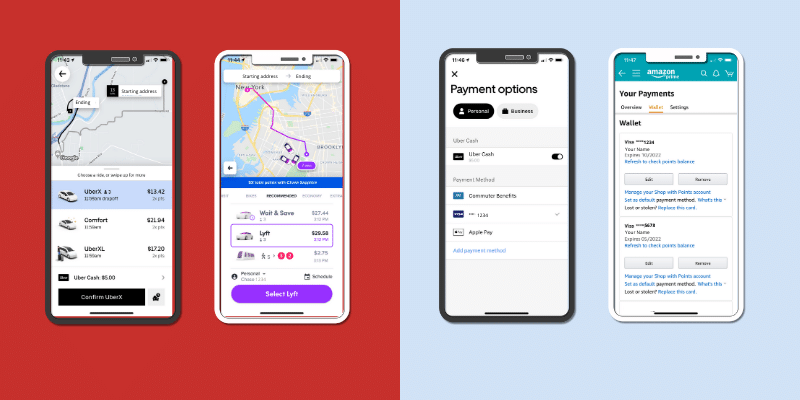
Begin by creating a list of your known direct and analogous competitors. Direct competitors are those who compete for the same target audience, directly in your market. For example, Uber and Lyft, who both offer app-based ridesharing services. Analogous competitors are those who, although are perhaps not in your market or space, are offering products or services that impact your target audience’s expectations and perceptions of your product. An example of an analogous competitor for Uber might be a traditional taxi service, although could also include other technology companies that offer features that Uber’s users like and expect. If Uber’s target audience is used to using Amazon’s saved credit card feature at checkout and would potentially choose a ridesharing service based on their ability to store that information, the technology team at Uber needs to consider it in their feature-based competitive analysis and potentially prioritize it in their product roadmap.
Using resources already available to you, you can likely develop a matrix of the suspected strengths and weaknesses of your competitors, their features, pricing and more to put together a partial idea of where your business falls in the space.
Some areas of competitive analysis are harder to gather data on, however. What are your competitors' current customers dissatisfied with? How do their customers perceive your product, and why have they chosen to go with your competitor’s instead? What channels are they using to promote their products?
At this point, you are in a good position to invest in competitive intelligence tools to further your data collection.
How to conduct competitive intelligence research with surveys
Surveys are a great way to connect with your target audience to ask anything you need to know. Whether it’s asking your own customers about their satisfaction with your product, or connecting directly with your competitor’s customers to ask what features are missing.
In most survey tools, you can define your target audience using traditional demographic data such as age, gender, location, and more. However, screening questions are an especially interesting feature for surveys dealing with competitive research.
Screening questions are offered by some competitive intelligence tools to help define the target audience further based on their beliefs, behaviors, or attitudes.
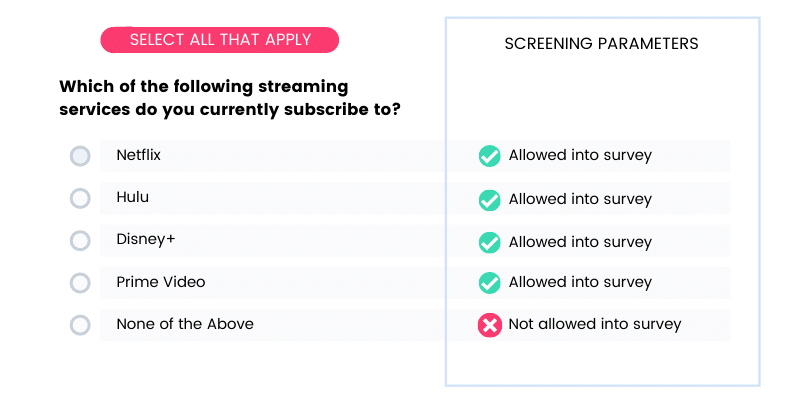
If a company wanted to target people who preferred or were users of their competitor’s product, they could easily use a screening question to find these audiences and ONLY allow users of the competitor’s product to take the survey. This gives you direct data from the source you want— the target audience you are trying to win over.
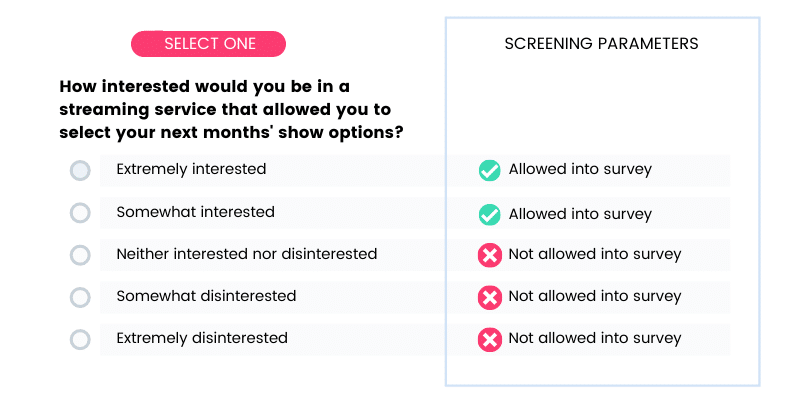
Screening questions are also valuable in doing comparative research on your own product. Perhaps you want to understand not just what your competitor is offering, but what your product is NOT offering. A screening question can help you find the target audience interested in your general product, service, or industry to understand who is leading consumer perceptions and why.
Survey design for collecting competitive data
Some questions you might want to include in your competitive intelligence survey could be:
Questions about brand recall and positioning
- Please list all of the brands you can think of in [INDUSTRY] space.
- Please rank the following brands from highest quality to lowest quality.
- Do you feel that [BRAND NAME] represents the product accurately?
Questions about your competitors' features
- Please rank the following features from most valuable to least valuable
- Which features do you like the most on [COMPETITOR’S PRODUCT]?
- Are there any features NOT offered by [COMPETITOR NAME] that you wish were available?
Questions about intent or loyalty
- What would make you consider a different solution to [COMPETITOR’S PRODUCT]?
- How much would you pay if [DESIRABLE FEATURE] were offered?
- What do you like most about [COMPETITOR NAME]'s brand or values?
- What do you like most about [YOUR COMPANY]'s brand or values?
Questions about gaps in current offerings
- What do you expect from [PRODUCT OR SERVICE] that you are not getting from available solutions?
- What features or offerings do you desire from [PRODUCT OR SERVICE] that would excite you more?
- Are there any brands that you can think of that are doing this well?
- When you think about the features you use the most, is there anything you are dissatisfied with?
These questions are simply ideas to help you begin to think about potential needs in your competitive strategy to ensure that you choose the right competitive intelligence tool to help you achieve what you need to know.
Competitive intelligence research can help you see how you stack up against comparable products and services, how the market sees you, and can guide you towards better strategies and business decisions. For further support in creating a survey for competitive intelligence research, connect with the 24/7 CX team at Pollfish to learn how to design and launch your own cost-effective solution to understanding your place in the market.

How to create PR surveys for press coverage
How to create PR surveys for press coverage
Public Relations is one of the most effective ways for brands to build their credibility and brand awareness, but it can be challenging to get the coverage you want at a reasonable budget.

One way many brands are able to improve their PR efforts is to use consumer surveys. Consumer surveys are a great way for you to connect with a wide audience of your choosing, at a relatively low cost, to gain original insights that can spark exciting headlines and, if done correctly, consistent press coverage for your brand.
How to approach your PR Strategy
PR is a subtle, but effective way to gain press for your business, but many are unsuccessful because they attack it too directly. Self-serving pitches don’t work. Think a few levels deeper than simply telling a group of people about the thing you want them to know. Good PR relies on good storytelling.
For example, if you were a technology company releasing a new feature, you might want the editors at TechCrunch to cover it. However, if there isn’t a story behind the feature that appeals to the readers of TechCrunch, this is unlikely to be selected. A better strategy would be to pitch a journalist a story of how your new feature impacts their readers by demonstrating how it solves a problem, unveils an exciting new technology opportunity, or improves the market they are in—using data to back it up.
Like everyone else, journalists and PR professionals have their own target audiences to consider. When you pitch them your story, make sure you’re considering what would be the most interesting to their target audience that will help the journalist meet THEIR goals, whether that is article shares, pageviews or other metrics that they are likely using to gauge success.
Using PR Surveys to gain press coverage
PR surveys are a helpful tool in achieving press because they offer data that can help you discover trends or ideas that can be used to build your story and pitch. Original insights gathered from PR surveys give journalists an opportunity to be the first to break a story or offer an original angle, which is highly valuable to them.
They also offer credibility by providing a data-backed perspective to your discovery. With trust in the media being at a record-low 59% (according to Cision’s 2020 State of the Media Report), data can help journalists rebuild and regain that trust.
Some common ways that businesses use PR surveys to gain coverage include:
- “Newsjacking”—The act of piggybacking on hyper-relevant news such as elections, viral or trending content, or other highly-topical and visible subject matter by contributing new information related to the topic. It’s critical for businesses attempting this strategy to be able to quickly launch surveys, gain results, and interpret them as these topics tend to quickly appear and disappear from the news cycle.
- Ancillary topics— This is strategy lets businesses subtly, but consistently, get in front of potential buyers. They are able to use surveys to gather data around topics tangential to their services, which make more interesting stories and gain press coverage for their brand by proximity. An example might be a mattress brand running studies about how much sleep people like to get and what is preventing them from getting it.
- Trade insights—These tend to be market insights for an industry-specific audience and can have a wide reach within that sphere. When put into press-releases on a newswire, they also might garner attention from reporters covering national or global trade news. An example could be an automotive manufacturer announcing that their consumer research shows a 50% growth in demand for electric vehicles against last year’s data.
Best practices for creating PR Surveys
Start with a headline
As with all surveys, the most effective ones are those that begin with clear goals in mind. This can be challenging in a PR survey because the goal is the outcome, rather than the survey itself. One trick to help you get started is to consider what the ideal headline would be based on your survey results.
Say you work for a large hotel chain and you offer complimentary WiFi service on stays longer than 5 nights. Perhaps your ideal headline would be “Free WiFi inspires travelers to extend their stay.”
While this headline is yet to be verified, it gives you a hypothesis to work from and your survey can help you validate the truth behind this claim.
Use varied question types
Different question types help you gain different points of data. Recommended question types depend on your survey goals but ultimately should help create a story with your data that can be used in your outreach.
To continue with the hotel chain example, a question like “How likely would you be to extend your stay if free Wifi was included on 5+ night stays?” would support the desired headline, whereas “Which hotel amenities would inspire you to extend your stay for 5 or more nights?” where a respondent can select a series of features that they find valuable, could be a supporting data point. Both illicit important—but different—information in the story.
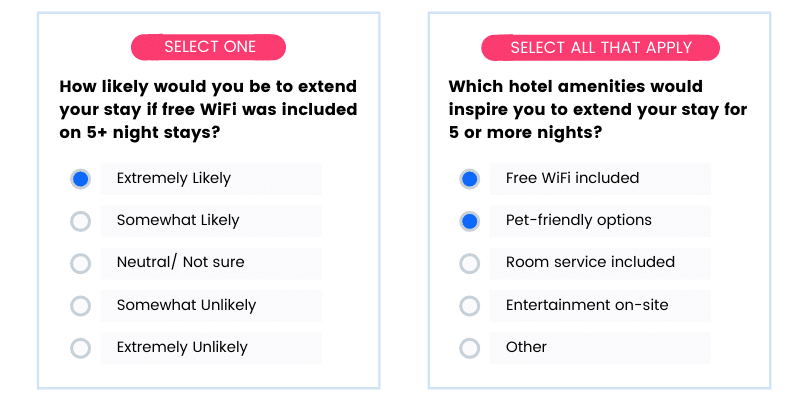
While a multiple-selection question might be the perfect way to determine a list of valuable features, a ranking question that positions the features as trade-offs is more valuable when comparing the features to each other, and offers yet another angle that might be interesting or supportive.
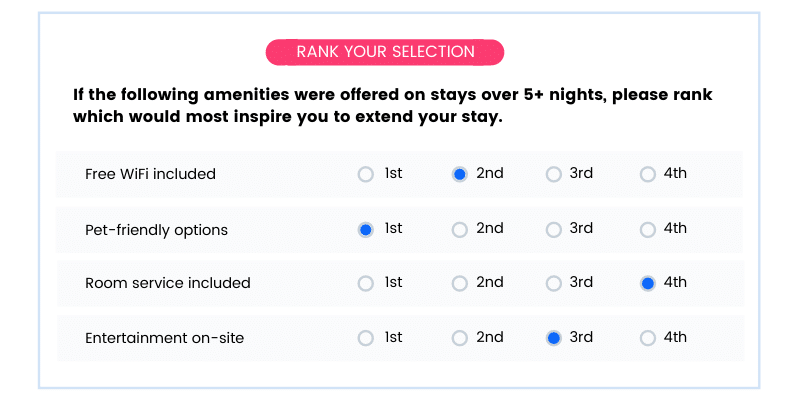
From the above examples, we know that the respondent would be extremely likely to extend their stay if WiFi were included, that they value free WiFi as well as pet-friendly options, and that given a choice between the two, pet-friendly options are actually a higher priority than the free WiFi.
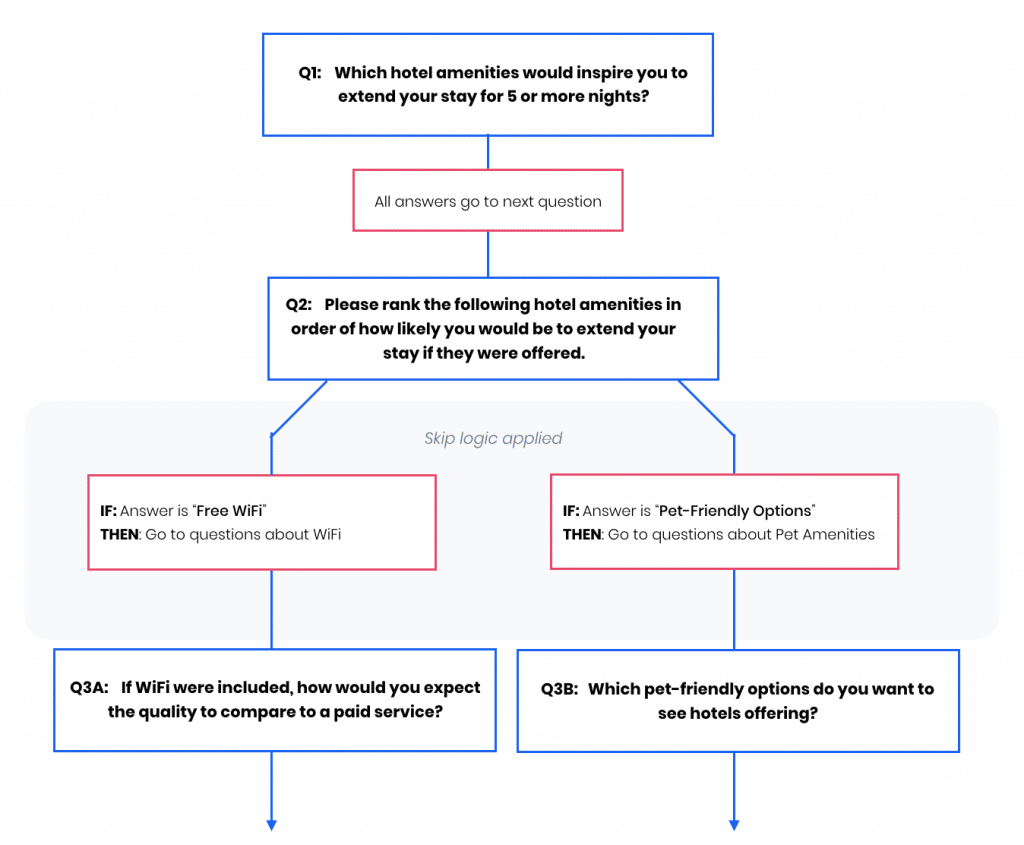
Apply advanced skip logic
Skip logic is a feature offered by some consumer survey tools that allows you to create multiple paths for respondents to take depending on the answers they have previously given. It offers a more in-depth data-set and greater ROI on surveys to be able to investigate multiple angles at once.
Because the headline you are pursuing is a hypothesis, it is a good idea to offer more than one channel based on the answers respondents have given. This has the added benefit of extending your survey as well as gives you more data that could be used to create multiple angles and pitches.
 Tip!
Tip!
Keep in mind that advanced skip logic should be used to enhance the depth of your data by gaining more tailored insights, not as a way to run a series of completely separate surveys at once. This confuses respondents, diluting data quality. For example, if a respondent selects that they are much more likely to extend their stay if the hotel was pet friendly, it is appropriate to ask more questions about other things that support that information. It would not be a good time to test a new slogan for the hotel, which could result in confusing feedback or incorrect data correlation, such as “pet-owners do not like the new slogan.” It’s best to stay focused on the high-level survey goal you set at the beginning.
Interpreting your results
Oftentimes results from surveys can be as overwhelming as they are exciting. Depending on your experience with data analysis or your survey tool in particular, this can be one of the more time-consuming parts of the process, however, it is vital to making the previous steps worth your while.
Make sure to look at the individual answers to questions to see if anything pops out, as well as slice and dice the data to correlate different points to different groups. Depending on demographic information like age, gender, race, or geolocation, it’s possible that different groups will value different features more strongly than others. You can also compare people who answered a question one way with another answer they’ve given later in the survey to show the correlation between these responses.
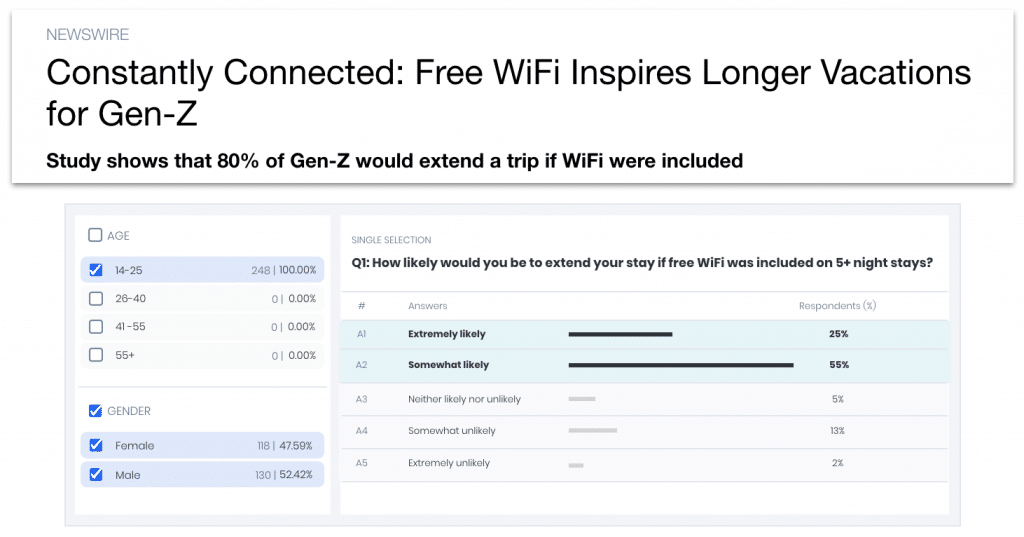
In our hotel example, perhaps the headline wasn’t proven because your survey suggests that travelers are neither likely nor unlikely to extend their vacation for free WiFi. However, when you segment by age, you discover that a younger group is much more likely to factor this into their plans. At this time, you can adjust your headline to an accurate, data-backed statement.
How to write a press release with survey results
Once you’re done analyzing the data from your PR survey, you’ll likely have a pretty clear idea of what the “best” stories are. There can be more than one, and depending on who you’re reaching out to, “best” stories might vary. If you’re planning to reach out to individual journalists, it’s important to do some research into what their beat is ahead of time so you can tailor your pitch to their interests.
- Choose your lede
Even if you have more than one great thing to share from your survey, you need to select one to be the primary hook for your press release or outreach. Ultimately, you want the most interesting piece of information to be the lede, using the rest of your data as supporting and supplemental information.
- Keep it simple
A long list of stats that share everything you uncovered in your survey might be exciting for you, but is likely too much information for the average reader. Stick to one angle per press release/ pitch and create more pitches with different angles if you have the data to do so. This has the additional benefit of reaching more audiences with different interests and improving the ROI of your survey.
In our hotel example, perhaps your survey revealed two great ledes: 80% of Gen Z would extend their stay for free WiFi, and that people would be 3x as likely to take more vacations if they could bring their dog. You can write these as two uniquely interesting stories and pitch to different outlets that would find these of interest.
- Use data in your headline
Leading with an impressive stat immediately builds credibility and catches attention. The news aims to provide new information, so an exciting stat revealing a new idea or data disproving a common belief are always exciting headlines. The more controversial or unexpected the findings, the better!
- Include your research methodology
According to Cision’s 2020 SOTM report, nearly 20% of journalists cite combating “fake news” as a challenge. Data can often come under fire when its veracity is doubted, so its best to use a reputable tool to back up your claims. Know a little bit about the survey methodology your survey partner is using to collect data and ensure that they have a good system for survey fraud prevention, as well as being able to provide a representative sample of your target audience.
- Offer exclusivity when you pitch
Being the first to break news is still attractive to journalists, who want to report on new information—not syndicate what already exists. Offering the same story to all of their competitors dilutes the potency of your news. If you’re doing individual outreach, select your journalist carefully and let them preview your press release under embargo before it goes live. Make sure to mention that you’re offering it as an exclusive to them, but also mention when you plan to publish it to the newswire to give them a deadline to decide.
If you're looking for more great resources on using surveys in creative ways, be sure to check out the Pollfish Resource Center, or reach out to our 24/7 customer experience team for guidance and support.

How to schedule surveys in Pollfish
How to schedule surveys in Pollfish
Sometimes it’s not always convenient to launch your survey—either it’s not in your target audience’s time zone at launch, or perhaps you’re away from your computer. With survey scheduling in Pollfish, you can automate the process and send surveys at your convenience.

Benefits of scheduling surveys
The benefit of scheduling surveys is that you can set them to run anytime, on your own schedule. Whether you’re about to leave town for vacation or want to be prepared for work the next day, a scheduling feature can automate the sending of your survey for a time that works best for you or your target audience.
When scheduling your survey, you can also select whether or not you want to add additional responses to your survey on a recurring basis for continual monitoring. For example, if you wanted to measure the impact of a quarterly campaign, you could schedule the same survey to run at two different dates with sufficient time for you to gather data needed to measure your impact on brand awareness or ad effectiveness. Other times, a recurring survey can validate actions you already have in place, ensuring that you’re still on the right course.
What to keep in mind when scheduling surveys
Be ready 2+ hours ahead.
When surveys are scheduled, they launch automatically at the set date and time. This means all audience targeting and questions in your questionnaire must be finalized before selecting the scheduled time. The minimum amount of time for selecting scheduled surveys is 2 hours before the survey launches.
Targeting cannot be changed on scheduled surveys.
Once your survey is scheduled, your targeting is set and cannot be changed. For surveys that have multiple occurrences, the same targeting will be used and the same number of responses added to your existing survey. If targeting needs to be changed in a scheduled survey, that survey must be canceled and a new one created.
This can easily be done in your dashboard by duplicating an existing survey and making the manual changes needed before rescheduling the launch.
The survey's completion status has no impact on future scheduled additional responses. For example, if a survey was scheduled for 3x occurrences with 2000 responses added each time and only 1000 are complete by the scheduled date of the next round, 2000 additional responses would be automatically added regardless of how far the survey has progressed.
Timezones and frequency are in your control.
Scheduled surveys allow you to select the time, timezone, and frequency of your survey’s launch. This can be a one-time scheduling or it can be set up for daily, weekly, quarterly or custom occurrences to add more respondents and track changes in target audience attitudes and behaviors over time.
Billing occurs on a rolling basis.
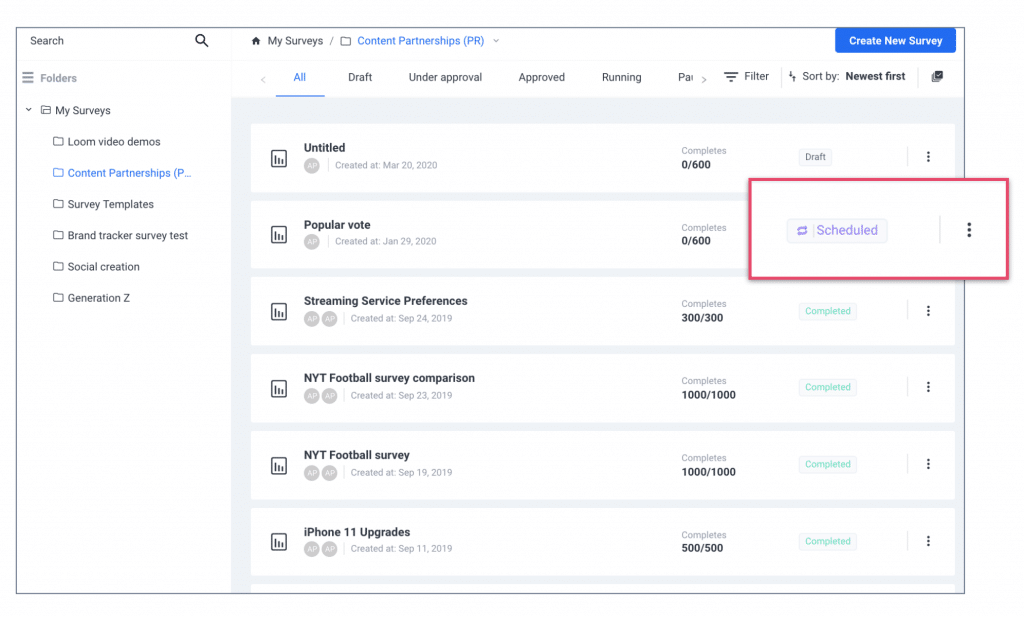
A scheduled survey appears in your dashboard under the status of “scheduled” once it has been approved. Payment will not be collected until the survey launches to ensure all billing information is accurate and up-to-date. Each scheduled occurrence of a survey will be billed separately at the time that additional responses are added.
This also gives you the opportunity to cancel and reschedule surveys as needed up until 2 hours prior to launch at no cost to you. There is no additional charge for choosing to schedule a survey or penalty for canceling one.
How to schedule a survey
Survey scheduling is offered as an option when you check out. This means your audience targeting and questionnaire must be selected and finalized when you get to the checkout page to be approved. Targeting cannot be edited in scheduled surveys, so be sure to select the right audience prior to launch.
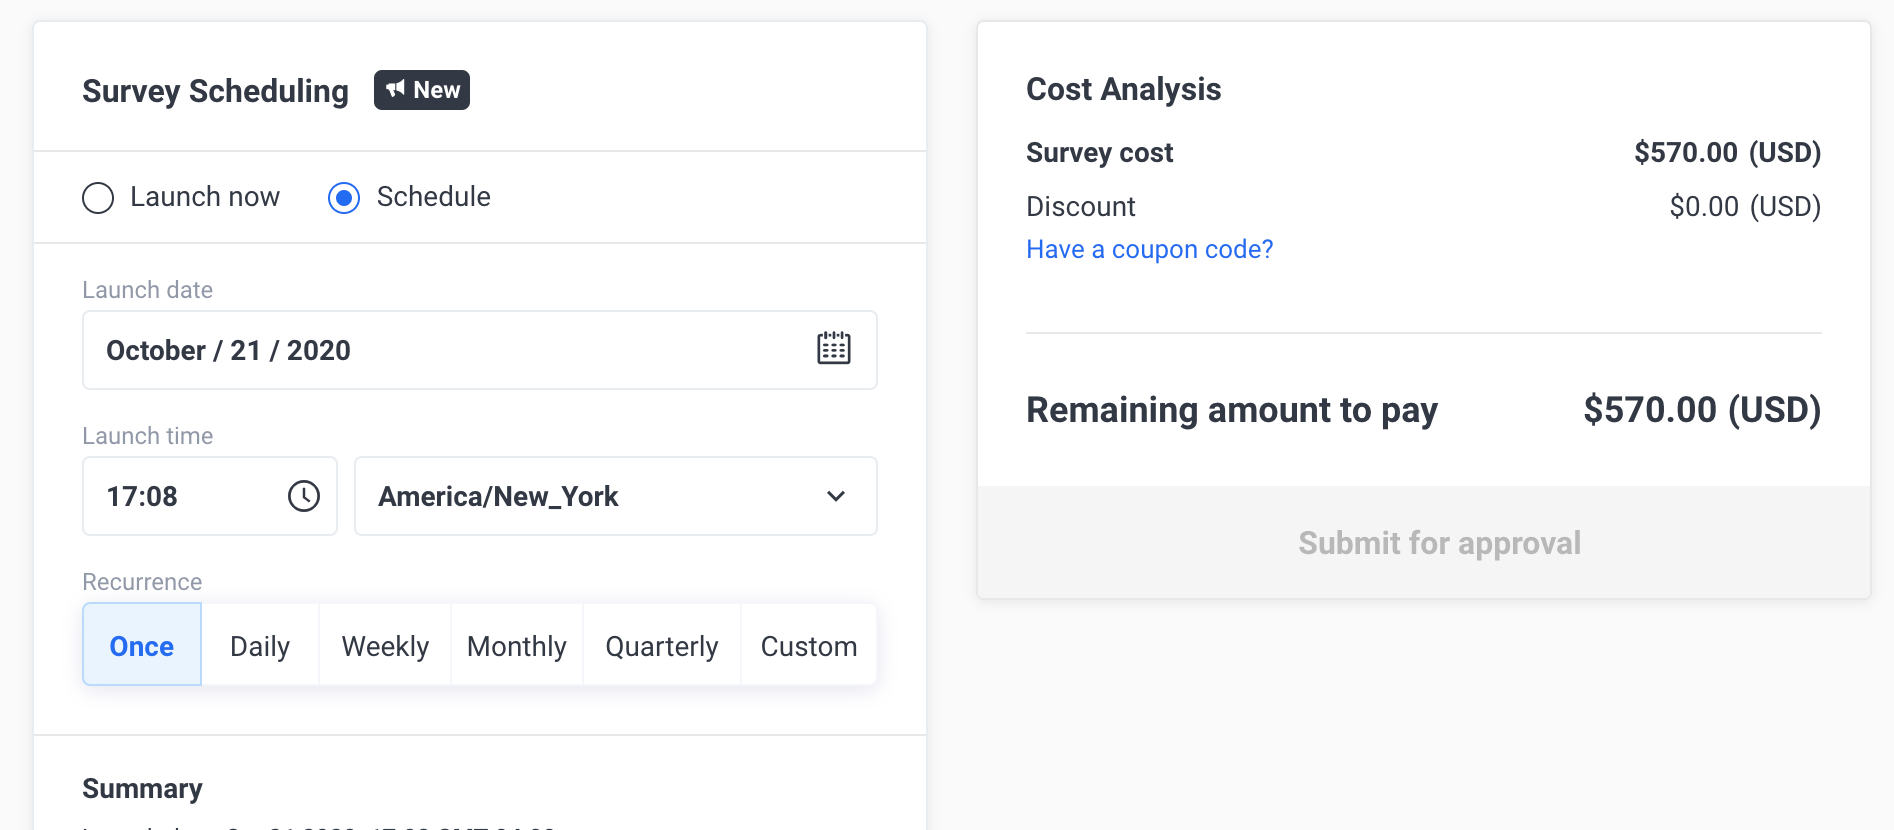
You can also select the number of times you want to run the survey, the dates and times in which you want to launch it, and the timezone you want it to launch in. The number of responses you have selected for your original survey will be added on the scheduled date for each occurrence. All of these can be selected in your checkout option.

How to use consumer surveys for brand awareness
How to use consumer surveys for brand awareness

What is a brand awareness survey?
Any product or service needs to differentiate itself from competitors and understand how they are performing in the market with the right audience. One way to measure how well they are standing out with their target audience, or whether the audience is correctly associating their brand with the product, service, or message they offer, is by tracking brand awareness. However, awareness can be hard to quantify making it difficult for teams to justify the expense associated with brand awareness campaigns.
Brand awareness surveys are a helpful tool in measuring these efforts. These are consumer surveys that are specifically about consumer attitudes and recognition toward a brand, its competitors, and its products.
How do businesses use consumer surveys to measure brand awareness?
Brand awareness surveys not only capture consumer sentiment but also offer a detailed breakdown of demographic audience data that can help brands ensure their message or product is resonating with the audience they are trying to reach.
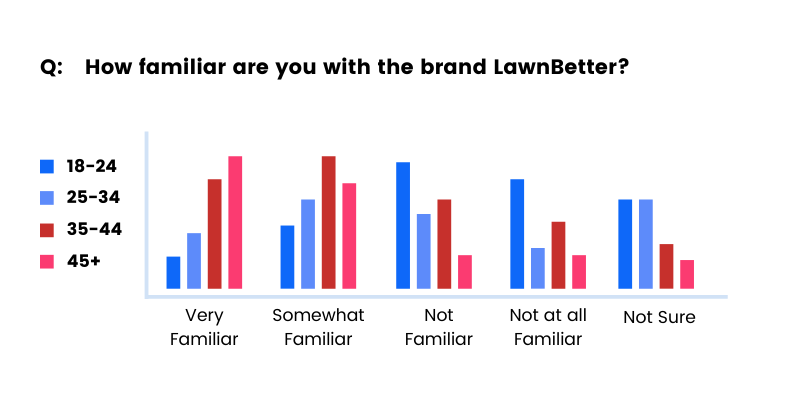
For example, if a lawn care brand was focusing on becoming top-of-mind among homeowners, they might ask consumers to list the lawn care brands that come to mind. Analyzing the results might reveal that homeowners age 45+ recognize their brand instantly, while younger homeowners identify a competitor more readily. They could use this information, along with attitudinal data, to develop a new campaign aimed at attracting younger audiences.
By using brand awareness consumer surveys, marketing and insights teams can get insights that help them understand how their brand is perceived by consumers and use that information to their advantage when it comes to pivoting or improving their positioning with target audiences.
How to create a high-quality brand awareness survey
Like all surveys, structure brand awareness surveys clearly and logically to minimize bias or confusion. Although brands want consumers to recognize and choose their product over a competitor’s, it does not help them to present their brand as “superior” in the survey. Questions and the order they are presented should remain neutral in tone and logical in order.
Brand awareness surveys often begin with an open-ended question asking consumers to identify brands within a specific category or products offered by a brand. Allowing consumers to freely list brands before they have seen any other questions where a name or logo might be included offers a more accurate portrayal of their ability to recall who is in the market.
- Please list all the lawn care brands that come to mind
- Please list all the products that you associate with LawnBetter
Open-ended questions, while not always ideal for mobile environments, provide a non-leading way for consumers to recall whatever comes to mind when asked to think of a specific product category.
Likert Scale questions asking consumers to rank their familiarity with a brand or competitive brand are also common near the beginning of a brand awareness survey. This helps establish the consumer’s recognition of the brand, although should follow any questions asking them to recall specific brands to get a more unbiased response.
Brand awareness surveys also can include media, such as logos for recognition or association, or potentially a new advertisement that a brand is running in a specific geographic area.
It is ideal to survey the target audience for a brand to determine how effective marketing efforts have been. However, target audiences can be broad or vary depending on the maturity of the brand, whether it is a new market or product launch, or if there has been an incident that inspired the brand awareness survey in the first place.
If the brand recently launched in a new geographic area, monitoring recognition across a broad audience can help them decide who the right target audience is. Whereas if the brand or industry had recently been involved in a scandal, the focus would be on measuring the sentiment of potential customers who have shifted their perceptions as a result.
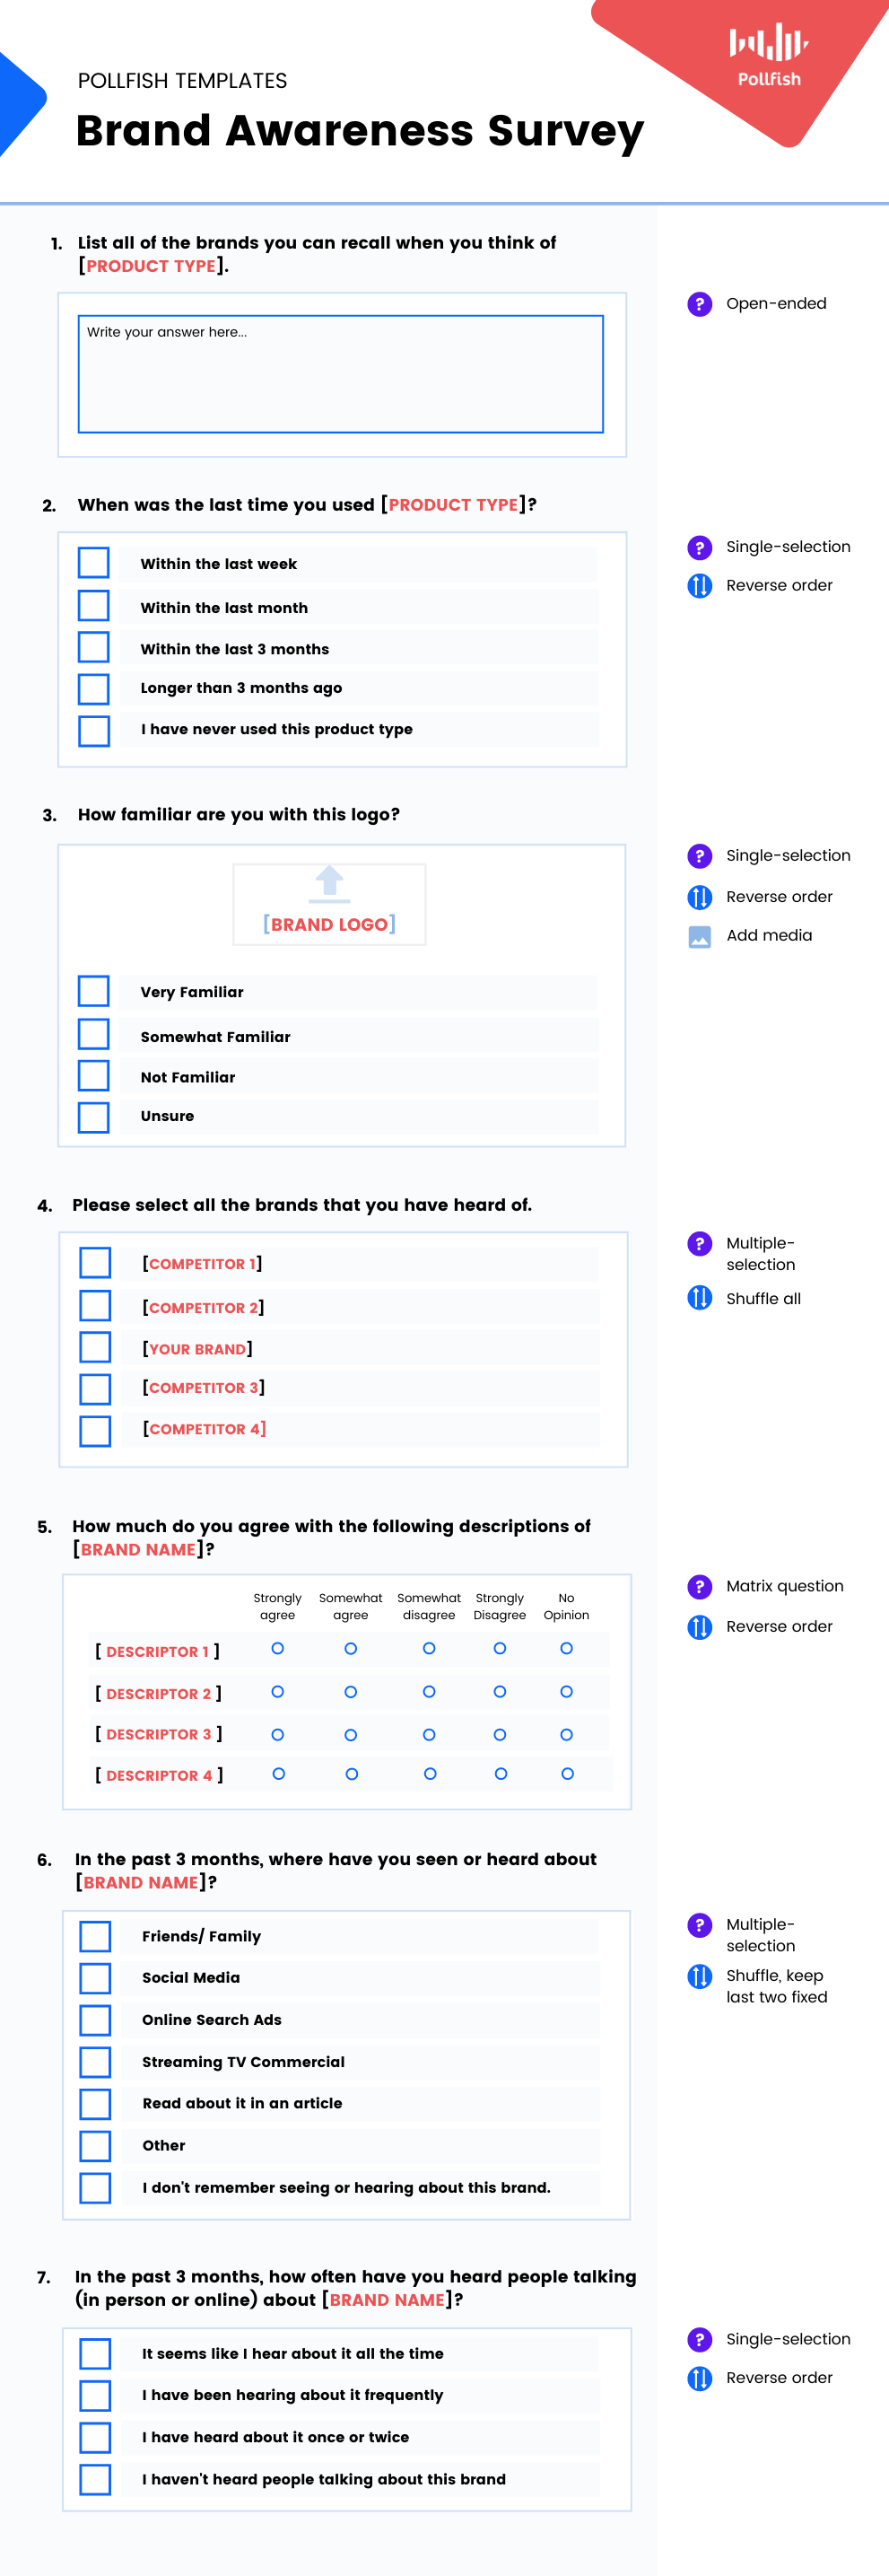
Survey template for brand awareness
To help you get started, use the Pollfish Brand Awareness survey template. Make sure to keep the best practices for creating survey questions, respondent experience, and platform in mind when developing your questionnaire for the best results.

How to test ad copy using Pollfish.
How to test ad copy using Pollfish
The objective of an advertising campaign is to bring a brand’s message to their target audience, but it can be challenging to know if the message is right. To help with this, brands and agencies can test ad-copy using Pollfish surveys to get data earlier in the process.

Why test ads before launch
When it comes to brands aligning themselves with ideologies, using humor, or moving into new markets where translation may be confusing, testing ad-copy and creative early can make or break a campaign’s success.
Many brands and agencies use Pollfish to help them understand consumer sentiment and behavior to develop ideas for a campaign’s overall message, but Pollfish can also be an asset later in the process. Ad testing early on helps validate the direction, ideation, and creative used. It can also prevent brands from making embarrassing mistakes by revealing confusing or misguided messages prior to launch.
It's especially important for brands exploring more risky, politically charged advertising to make sure they don’t inadvertently damage their image by launching campaigns that are perceived as “tone deaf” or don’t resonate with the target audience.
With Pollfish’s advanced targeting and variety of question types to choose from, you can test all parts of ad messaging with the right audience early on. Feedback from real consumers before launch gives you data to pivot the campaign as needed without costing a fortune in time, resources, or damaging credibility.
Building a copy test survey with Pollfish
Like all research projects, the best way to test ad-copy will vary depending upon your goals and needs, what type of creative you need to test, and what you need to learn as a result of your research.
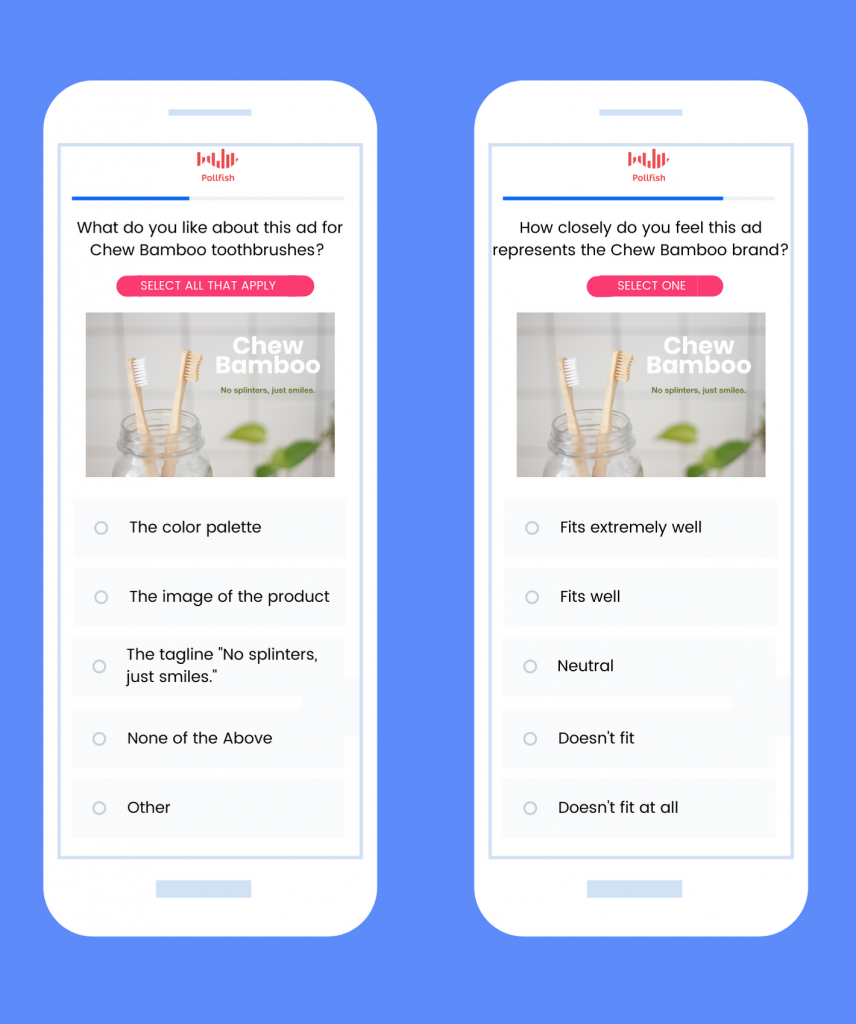
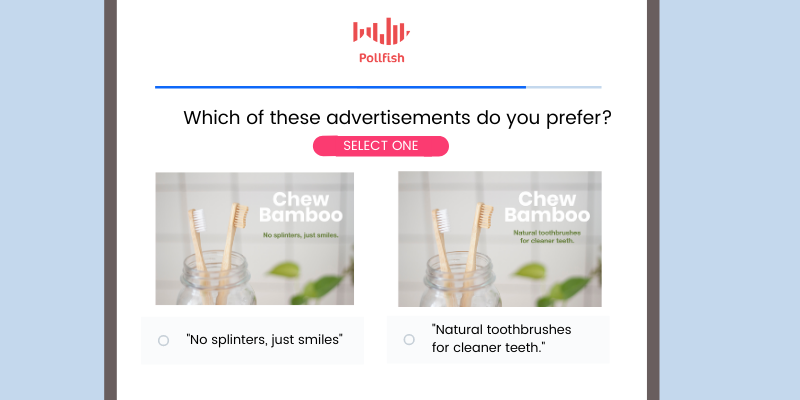
Many companies use Pollfish to gather consumer sentiment to determine the direction of their campaign, but they can also use Pollfish to validate it. By presenting the target audience with the ads and asking them to choose the message that best fits, campaign creators can determine that their ads are telling the right story and tapping into the emotions that they want to influence.
A/B Testing
A/B testing involves showing a group of people one concept, followed by a similar group being shown another variation and comparing the results to determine which performed better. On Pollfish, this can be achieved by creating two separate surveys to show Creative A and Creative B to similar groups by selecting the same targeting.
You can only include one photo, video, or audio file in the question for now, however, you can upload a single image as a split-screen to offer an option to select between images. You can also add images to the answers, allowing you to structure the question differently if you prefer.
Because Pollfish is one of the only survey tools that allows additions of image, audio, and video media on questions and answers, you have a variety of ways to test other creative in addition to ad-copy.
Test CTAs
To test different CTAs, consider providing an overview of an ad or a short video to engage the audience. At the end, ask them to select, or rank, the CTAs they would be the most likely to click based on the information they were presented with.
Testing ad effectiveness
A similar form of testing completed after a campaign is live is useful when trying to better understand which messages most resonated with consumers. For example, if consumers are asked to recall where they saw an ad or the brand it was for, their results can help measure the effectiveness of the ad or creative in question.
To measure ad-effectiveness using Pollfish, we recommend running a pre-test prior to the campaign to collect metrics for awareness, favorability, and other objectives. Once the campaign is complete, duplicate the survey in the same area to compare changes in metrics and validate your campaign’s impact.
Ad-copy testing is a simple, effective way to validate concepts prior to launch or catch catastrophic mistakes before they’re made. With Pollfish, a simple survey can provide all the information you need to get your campaign on the right track. Reach out to support for additional assistance or to get our ad-copy testing template questions.

Likert scale questions: What are they and how do you write them?
Likert scale questions: What are they and how do you write them?
A Likert scale is a rating scale that lets respondents select answers ranging across a spectrum of choices to gain deeper insight into attitudes, beliefs, or opinions.

How a Likert scale is different from a Rating Scale
A Likert scale was developed in 1932 by Rensis Likert, a psychologist, to better understand the feelings of respondents given a balanced set of choices. Likert scales are most often an odd-numbered series of options, between 5 to 7 answer choices, evenly distributed in weight and symmetry across the scale and ranging from one end of a spectrum to the other. The scale is popular in questionnaires and online surveys in collecting quantifiable data about subjects that are often difficult to analyze without observation, such as consumer attitudes, beliefs, and opinions.
Although Likert scales are rating scales, the opposite is not necessarily true. While “Likert scale” is often used interchangeably to describe a rating scale, a Likert scale is a specific type of rating scale that exclusively focuses on a range of answers on a spectrum. A rating scale can consist of any number of rating choices, such as stars or numeric responses as are used in an NPS question type.

When you should use a Likert Scale
Likert scales are a particularly useful form of rating scale that can be used when observation isn’t an option. Website and mobile surveys, customer satisfaction questionnaires, and more allow researchers to gain insights on perceptions, behaviors, feelings, and more by asking respondents to self-report their reactions based on how they feel using the Likert scale.
Some common uses for Likert scale rating question types include:
- Customer Satisfaction surveys
- Investigating the likelihood of action being taken
- Gaining insights on beliefs or perceptions surrounding a specific topic
- How frequently an action occurs
Likert scales make it easier to quantify these kinds of insights, so they can be an asset in analyzing large quantities of data. There are many more instances in which a Likert scale can be of use, as it is one of the most popular rating scales in use today.
How to write Likert scale questions
Likert scales offer a balance of answer choices, so the scale should be symmetrical in weight. If, for example, one end is “extremely likely” the other end should be “extremely unlikely” or “not at all likely” with a neutral choice such as “neither likely nor unlikely” as the center option.

As with any survey, it’s important to follow best practices for writing good survey questions. Likert scales follow these same basic principles.
Keep in mind that Likert scale answer choices are ordered, and should therefore not be shuffled. To reduce bias in a Likert scale, questions should be given with “reverse order” shuffling commands to keep the scale intact. This allows varied presentation of choices to respondents but doesn’t lead to confusion or misunderstandings.
In the Pollfish platform, you can select Likert scale answer variants from the “Predefined answers” selection to choose the scale that is the best fit for your question.
Examples of Likert scale questions
Customer satisfaction surveys
Likert scales can be used in customer satisfaction surveys to determine how customers felt about their experience, a product, or service.
Example: How happy were you with your stay at our hotel?
- Very satisfied
- Somewhat satisfied
- Neither satisfied nor dissatisfied
- Somewhat dissatisfied
- Very dissatisfied
Frequency of behaviors
If you are looking for how often a consumer purchases a product, takes an action or spends a certain amount of money, Likert scales can help uncover some of these behaviors.
Example: How often do you read articles on your phone vs in a newspaper?
- Much more
- Moderately more
- About the same
- Moderately less
- Much less
Agreement statements
Perhaps the most popular Likert scale in survey questions is a scale of agreement-disagreement, where a respondent is asked to select the answer that best reflects their belief about a statement provided.
Example: Please select how much you agree or disagree with the following statement: Cats make better pets than dogs.
- Strongly agree
- Somewhat agree
- Neither agree nor disagree
- Somewhat disagree
- Strongly disagree
Using a Likert scale in a matrix question type
Matrix style question types allow Likert scales to be used to ask about several different ideas at once. This can be a good option when the survey will otherwise be repetitive, measuring the same data for many similar ideas.

Likert scales offer researchers an easy scale to measure certain opinions on topics important to their customers and consumers and provide actionable insights that can be analyzed. To make the most of Likert scales using Pollfish, consider selecting answer choices from our Predefined answer selections or use our Crosstabs feature for advanced analysis when your survey is complete.
Frequently asked questions
What is a Likert scale?
A Likert scale is a rating scale that lets respondents select answers ranging across a spectrum of choices to gain deeper insight on attitudes, beliefs, or opinions.
How is a Likert Scale different from a rating scale?
A Likert scale is a specific type of rating scale that exclusively focuses on a range of answers on a spectrum. A rating scale can consist of any number of rating choices, such as stars or numeric responses as are used in an NPS question type.
What are the features of a Likert scale?
Likert scales are often an odd-numbered series of options, between 5 to 7 answer choices, evenly distributed in weight and symmetry across the scale and ranging from one extreme end of a spectrum to the other.
Why is a Likert scale popular in questionnaires and surveys?
The Likert scale is popular in questionnaires and online surveys, as it collects quantifiable data about subjects that are often difficult to analyze without observation, such as consumer attitudes, beliefs, and opinions.
What types of questions are Likert scales used in?
A Likert scale can be used for questions about customer satisfaction, frequency of behaviors, agreements questions along with matrix question types.

Getting familiar with conjoint analysis
Getting familiar with conjoint analysis
Conjoint-Analysis asks respondents to make a choice between multiple sets of criteria in a real-world scenario to help researchers understand which features are prioritized and considered during the decision-making phase.

What is Conjoint Analysis?
Conjoint-analysis is a quantitative research method that asks respondents to make selections between groups of attributes in a scenario against alternative scenarios made up of different attributes. It is considered more predictive of a buyer’s purchase behavior as it does not let respondents cherry-pick attributes or select the “ideal state” of a product in isolation. Instead, respondents are given sets of features in a product or package where they make trade-offs, indicating which features are most important and what they value most. Conjoint analysis survey questions are often used to evaluate features in products, pricing for packages, and different product offerings by a business.
Choice-based Conjoint-Analysis
Although there are several kinds of conjoint-analysis, the most commonly used technique is a choice-based conjoint analysis, which is used in many real-life purchasing scenarios.
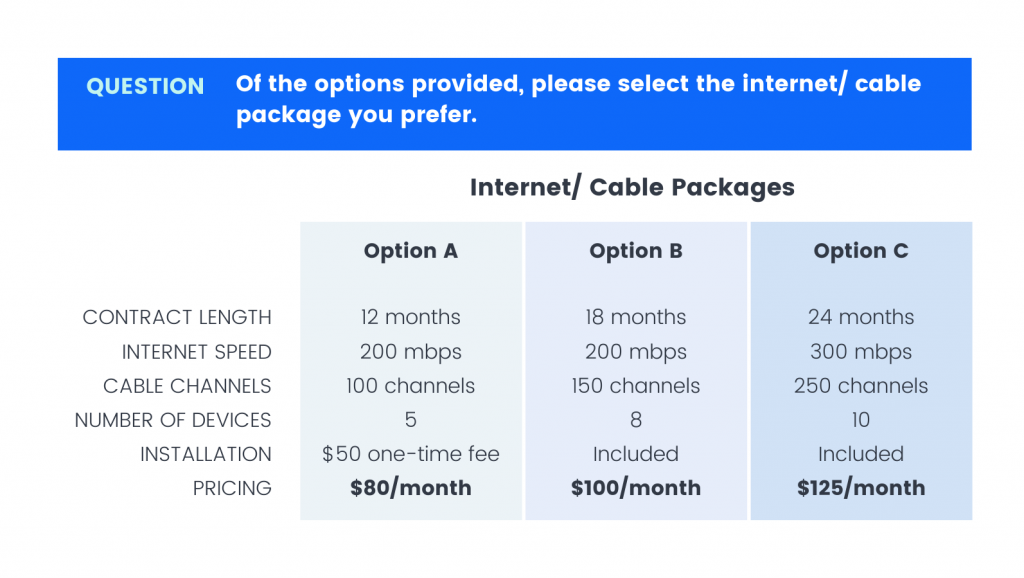
Rather than asking respondents to give their opinion about an isolated event, conjoint analysis allows you to measure two (or more) scenarios at a time against the alternatives available. Respondents are asked to make trade-offs between the presented scenarios, rather than choosing or customizing specific options. Each scenario includes a complete set of attributes or features to provide context that may influence their decision to choose one scenario over another. For example, respondents being asked to compare internet service packages against another based on what each package offers.
These answers give researchers additional context about what is most important to their respondents when evaluating a complete package, rather than individual characteristics.
An example of a conjoint analysis might be asking consumers to compare features of internet cable packages, then compare the packages overall.
A discrete choice conjoint analysis allows respondents to select between a series of products, or choose “none” which is considered more indicative of real-world behavior. For our example, if the respondent doesn’t see value in any of the presented options, they may choose not to buy an internet package from this company at all.
Adaptive conjoint analysis
Another type of conjoint analysis is an Adaptive Conjoint Analysis, which requires software to use previous responses from respondents to tailor the questionnaire. Although it follows the same structure of asking respondents to make trade-offs to determine weights and information, it ultimately can result in smaller or more in-depth surveys about specific attributes. Adaptive Conjoint Analysis relies on a type of branching logic that eliminates attributes that are less relevant to the respondent and keeps their focus on fewer attributes throughout the survey.
Weighting in conjoint analysis
Conjoint Analysis question options apply weights to the attributes in a grouping to elevate their importance. Weights are determined through a linear regression model that asks respondents to go through a series of configurations of a product or package. Using experimental design, these are then analyzed and weights are determined for the individual attributes.
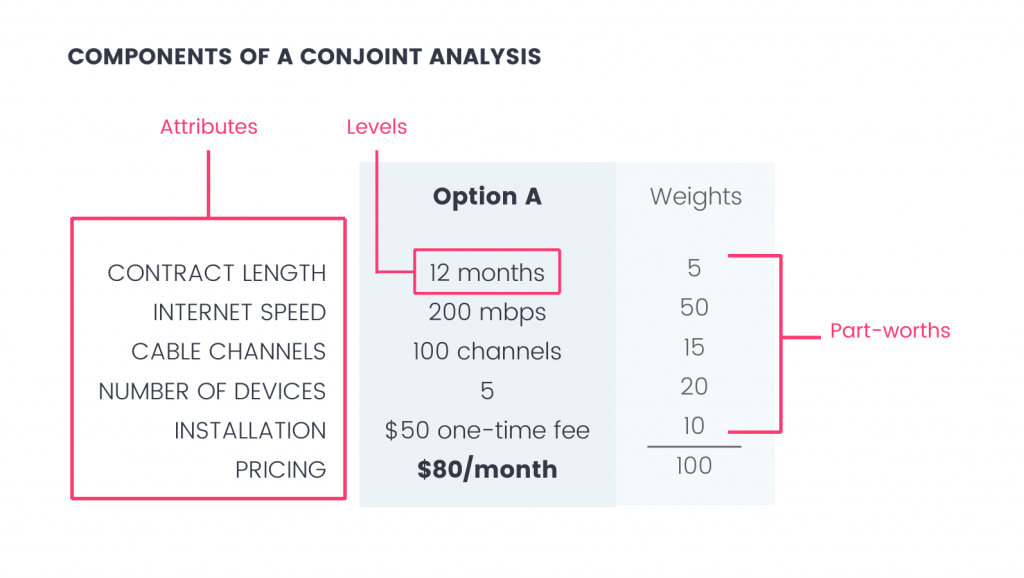
The values of the individual attributes that indicate the respondents’ trade-offs in a product are called part-worths, and they are used in determining the weight of each attribute in the grouping.
In the internet package example, if “internet speed” was the most important attribute to respondents, it would be given a greater weight to indicate its significance in the respondent’s decision to choose this package. Alternatively, the contract length may be considered a trade-off for respondents wanting faster internet speeds, so the weight applied to “contract” would be given a weight that balances the “internet speed” attribute and makes the trade-off more comparable. These influence the choice the respondent makes and lets researchers discover the right balance between attributes offered in a conjoint selection.
Conjoint analysis terms and vocabulary
- Adaptive Conjoint Analysis: A digitally based conjoint analysis test that uses an algorithm specific to the respondent’s answers to tailor the questions to attributes that are relevant to the respondent.
- Attributes (Features): The criteria that make up a complete set of information to be compared in a conjoint analysis. In our internet packages example, the attributes are “Contract Length”, “Internet speed”, “channels provided”, etc.
- Choice-based conjoint Analysis: The most common type of conjoint-analysis that asks respondents to make a choice between two or more offerings made of a set of weighted attributes.
- Discrete-choice conjoint analysis: A choice-based conjoint analysis that provides a “none of the above” option in addition to a series of options. It most clearly matches real-world purchase decisions by giving respondents the option not to select any of the choices.
- Experimental Design: A psychological practice of research design that refers to the distribution of respondents in different parts of an experiment. It often includes at least one experimental group and one control group.
- Full-profile: A conjoint analysis that explores all of the attributes.
- Levels: Categories of specific attributes. In our internet packages example, levels for the attribute “Contract Length” are “12 months”, “18 months”, and “24 months.”
- Part-worths (Utilities): The partial value of a complete product, divided among its attributes to assign value to each part.
- Partial-Profile: A conjoint analysis that only explores a few attributes at a time.
Conjoint analysis offers greater depth into consumer purchasing decisions through weighting and assessing the data to see which features bring greater value to products. These insights can then be used to create new or better products, special offers, or inform competitive market opportunities.

Using crosstabs in survey data analysis
Using crosstabs in survey data analysis
A common method for researchers to perform quantitative analysis of the relationship between two or more variables is cross-tabulation. Cross-tabulation, or crosstab (also abbreviated as “x-tabs”), is a matrix table typically used in multivariate market research and/or statistical analysis to analyze the relationship between variables in two or more categories.

Crosstabs in research analytics
Cross-tabulation is also known as simply “Crosstab”, but can also refer to a “contingency table” or “cross break.” They are a matrix-style table that allows the observation of one variable’s dependency on another and are commonly used to analyze relationships between categorical data, such as age, region, or frequency of an action.
Even if you’re new to market research, you’ve likely encountered a cross-tabulation before. You can create them as pivot tables in Excel, or develop crosstab formats in popular analytics programs and most major market research tools. They have become an industry standard for processing many variables at once to determine conditional relationships between them.
The power of crosstabs
What makes this method especially powerful for researchers is how variables are grouped into sub-categories to see how a dependent variable changes the results.
Reduces confusion
Raw data can be tough to interpret for even the most advanced researcher. When data is displayed in a crosstab matrix, researchers can make sense of the relationships more easily. Crosstabs present a clearer interpretation of the data by showing percentages and frequencies that may change when contrasted with variables in other categories.
Offers a deeper look
Because of the depth offered by crosstabs, researchers can uncover relationships between variables or segments that may have been missed if presented in another format. Layers of data can be correlated, rather than just one or two categories due to the variable grouping.
Opportunities to involve the whole team
Manual statistical analysis can take a while and introduces an increased possibility of human error. For those who don’t have an advanced statistical analysis background, analyzing results can be intimidating and easily confused. The use of crosstabs structures this data into a more digestible format at the beginning of the analytics process. It provides an efficient layout for research professionals as well as a more actionable view for members of the team who lack advanced data analytics backgrounds.
Crosstab example
For example, in a survey about online habits, a variable might be how often a respondent shares content on social media. Another variable might be whether or not they read content that covers certain topics.

Using a crosstab to correlate data from those answers, a researcher can see the number of respondents (count) that fell into each category based on the answer given. Crosstabs offer a level deeper than simply stating that those who read business and finance news are likely to share educational content, and instead are able to uncover that those who are reading Business and Finance news the most often are also the most likely to be sharing educational content the most often on social media.
Terms used in crosstabs
Crosstabs come with their own vocabulary specific to the layout. Understanding the specific language and elements used in crosstabs can be helpful for researchers looking to get more out of their analytics.
- Banners (or Cuts): The headers that name the categories of the data displayed by a column
- Categories: The way that the variables are grouped (for example, respondents who are “women” or who “mostly agree with the statement ‘salads are healthy.’”)
- Columns: The cells that display data vertically
- Column-Percentage: A view of data that calculates the column data belonging to a particular row.
- Count (or Frequency): The total number of responses that fall into a row and column
- Crosstabs: Otherwise known as “cross-tabulation,” “data tabulation,” “cross break,” or contingency table” is the name of the table that researchers use to analyze categorical data.
- Fisher’s Exact Test: Another test for statistical significance that uses an exact deviation from the null value (rather than an approximation). Because of the exactness of the p-value, this is recommended for smaller sample populations (although can be applied to samples of all sizes)
- G-test: a test for determining a statistically significant likelihood of a variable’s dependence on another, sometimes considered to be more efficient than chi-square testing.
- Pearson’s chi-square test: a test for determining the statistical significance of a cross-tabulation by determining if the variables being compared are independent. It is a measure of how actual data compares to expected data.
- Percentage: The percentage of all responses that fall into a given row and column
- Rows: The cells that display data horizontally
- Row-Percentage: A view of data that calculates the row data belonging to a particular column.
- Stubs: The headers that name the categories of the data displayed by a row
For those looking to analyze their data using a crosstab, we suggest creating a Pollfish survey and exporting your results directly from the platform into this format. You can learn how on our post for using crosstabs in Pollfish.
Frequently asked questions
What are crosstabs in data survey analysis?
Crosstabs or cross-tabulation, is a common method for researchers to perform quantitative analysis of the relationship between two or more variables.
What do crosstabs do and what do they look like?
Crosstabs (crosstabulation) is a matrix table typically used in multivariate market research and/or statistical analysis to analyze the relationship between variables in two or more categories.
How do you create cross-tabs?
You can create cross-tabs as pivot tables in Excel, or develop crosstab formats in popular analytics programs and most major market research tools.
What are the benefits of using cross-tabs for market research?
Crosstabulation is great for market research, as variables are grouped into sub-categories to see how a dependent variable changes the results. This reduces confusion; researchers can uncover relationships between variables or segments they may have missed if presented in another format.
Why should researchers use the cross-tabs format?
The use of crosstabs structures this data into a more digestible format at the beginning of the analytics process. It also provides an efficient layout with a more actionable view for members of the team who lack advanced data analytics backgrounds.

Validating concepts with Monadic Testing
Validating concepts with Monadic Testing
Researchers use monadic testing to gather feedback on a single concept from your target audience in a vacuum. The name originates from the Greek word “monos,” meaning alone. Another variation of this is a sequential monadic test— when an audience is questioned about two or more concepts in an isolated survey environment.

Monadic testing
A monadic test is a survey that investigates a single concept in depth with a target audience, broken into at least two groups. It is commonly used in product and concept testing, such as testing creative for a campaign or testing pricing or features for a product. These surveys tend to be short, but extremely focused.
Because respondents are only being asked for information about a single concept, monadic testing can go in-depth on the subject without creating a lengthy questionnaire. For example, in a monadic test for ad creative, the respondent might first be asked to give their opinion on a specific advertisement. Follow-up questions could include what they liked about the piece, the colors, the images, text, or emotions and feelings they experienced when looking at it.
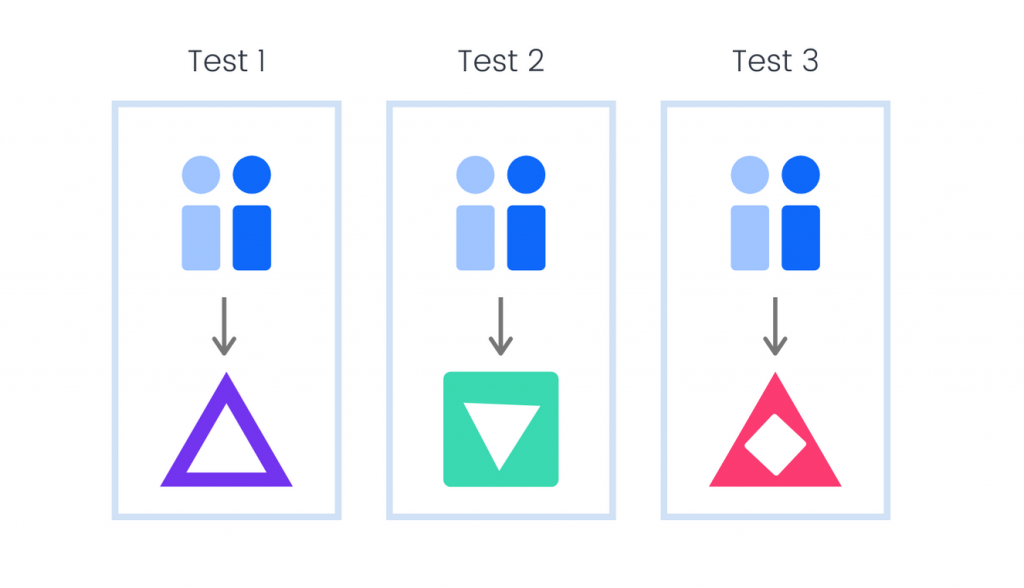
If a researcher wants to evaluate multiple concepts, they will need to create multiple samples of the same audience, as each group will still only be reviewing a single concept. If in the earlier example there were three advertisements to be tested, there would be three surveys, each featuring a different ad and asking the same follow-up questions to determine specific details about it. Each survey would be sent to an audience sample that is made up of the same targeting criteria. The results would then be compared and analyzed to determine which creative was preferred by members of the target audience.
Benefits and drawbacks of Monadic Testing
Monadic tests expose respondents to one stimulus independent of contextual information. This gives researchers insight into a respondent’s thoughts about the product or concept when no external distractions are present and can supply some in-depth, clean data to confirm the idea when there are no constraints.
For example, a monadic test might reveal that respondents felt favorably towards a product, while they might express negative ideas about it given information about the brand or when compared to similar products. This lets researchers know that the issue may be related to brand perception or competitive solutions, rather than the product itself.
Because monadic tests exist to investigate a single concept, they can also go in-depth without becoming too long. This is especially helpful in formats like mobile surveys, which should be kept short enough to captivate the attention of respondents on the go.
A drawback to monadic testing is typically cost, as it requires more respondents to create multiple samples fitting the same targeting criteria to complete the survey in isolation. This can also be challenging when the audience targeting is very narrow and harder to find enough respondents to create two complete samples.
Sequential Monadic Testing
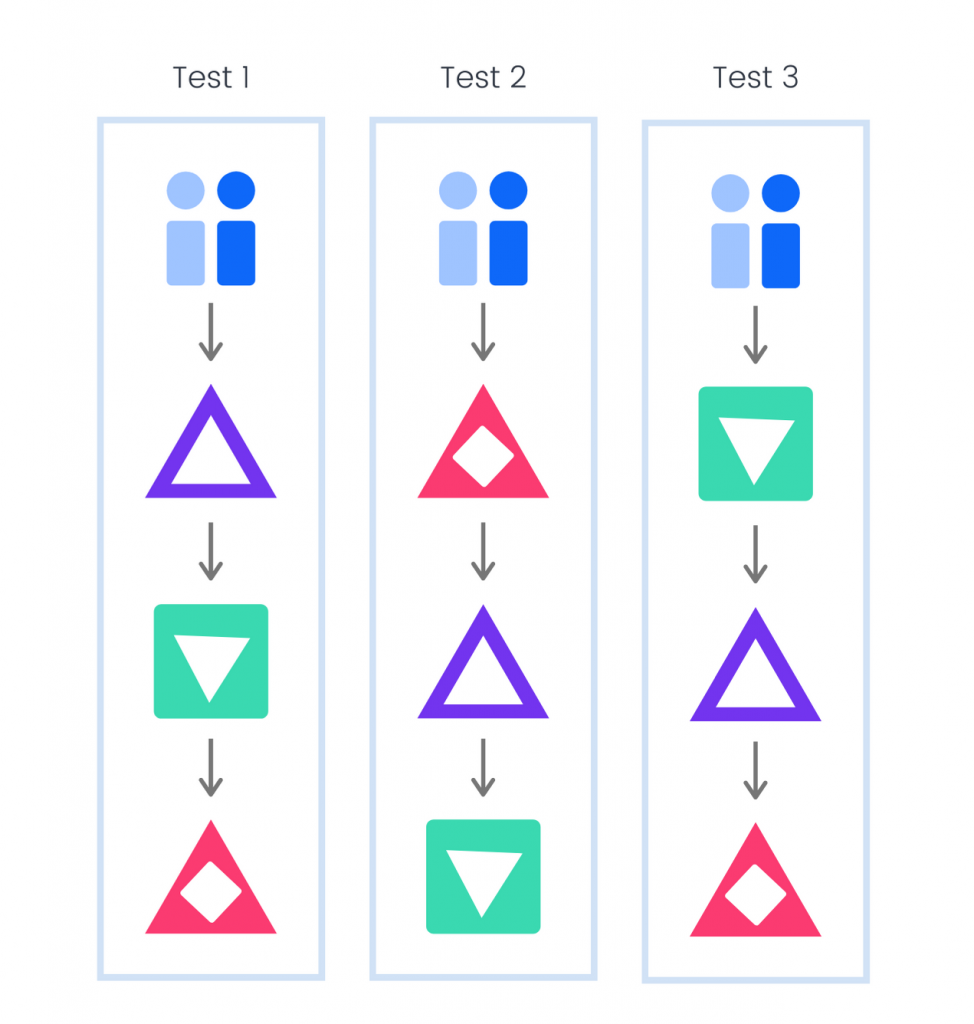
A sequential monadic test (sometimes known as a paired test) is a monadic test that asks respondents about two or more concepts in the same isolated environment. The concepts are often randomized to reduce survey bias but follow the same series of questions about each concept to determine key information.
An example might be asking groups of respondents in the target audience for opinions on an existing feature and a proposed new feature. One group might be shown the current feature first, while another group is shown the new feature first, then the existing one. Information is gathered to see which feature performed better with the target audience and if exposure to the existing feature played a role in the respondents’ reception of the new concept.
Benefits and drawbacks of Sequential Monadic Testing
Sequential monadic tests are often used when only a small target audience is available or when research budgets are lower. They can be more cost-effective since more concepts can be evaluated in one round, and fewer respondents are needed overall to maintain accurate results. This also means that sequential monadic tests are likely to be completed first.
However, sequential monadic tests are open to various kinds of survey bias. They can be affected by the Interaction Effect, when a respondent who is biased toward earlier concepts, rates others based on a comparison they are keeping in mind. For example, if a respondent sees an ad they like at the beginning, they may view the following ads relative to the first concept and be less likely to say they like them.
They are also at risk of order bias unless the concepts are shuffled regularly to ensure that respondents aren’t regularly being exposed to the concepts in the same order.
Questionnaires also tend to be longer with sequential monadic tests, as more concepts are introduced. This may mean lower completion rates, or if the questionnaire is kept short, the depth of the questions themselves may be limited.
Comparison Testing
Monadic testing and sequential monadic testing differ from comparison tests in that the audience is not being asked to compare different concepts, simply to supply feedback about them, often diving deeper into the concepts as a result.
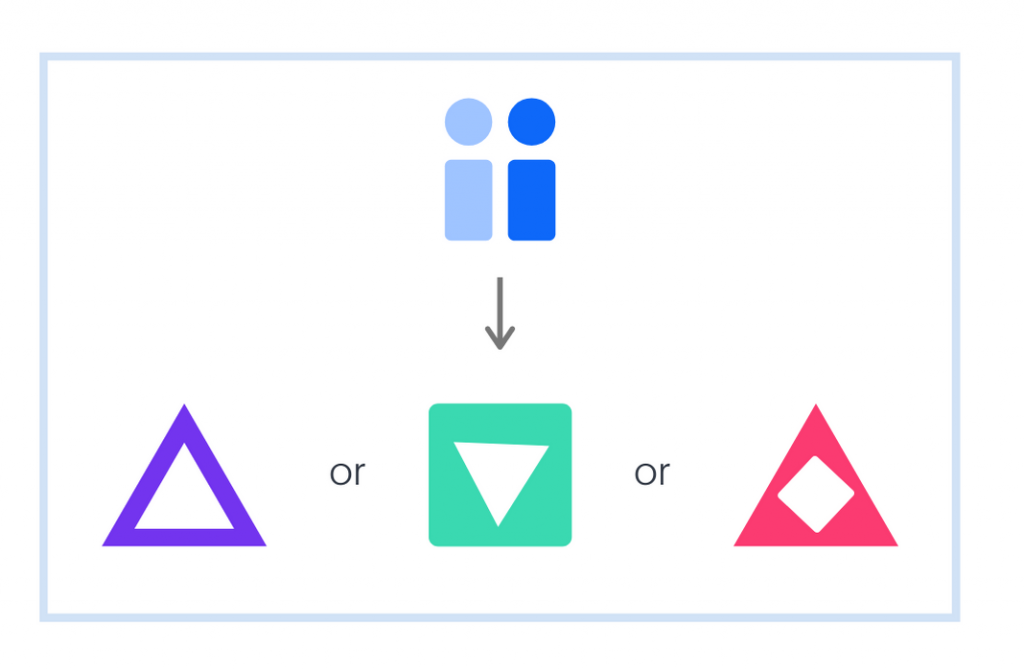
Comparison testing specifically asks the respondents to compare two or more concepts against one another, such as ranking items in a list or choosing the “best” item presented.
Benefits and drawbacks to comparison testing
Comparison testing supplies easily digestible results. When respondents share that they like a product the best, or would pay more for a specific feature, it’s clear which concept is the winner.
However, comparison testing rarely supplies context. For example, if there was a specific detail that made the feature worth more to respondents, a comparison test would not reveal that information to researchers. If the detail is then missed when the feature is developed, it may not be the right feature or worth it to respondents to pay for it.
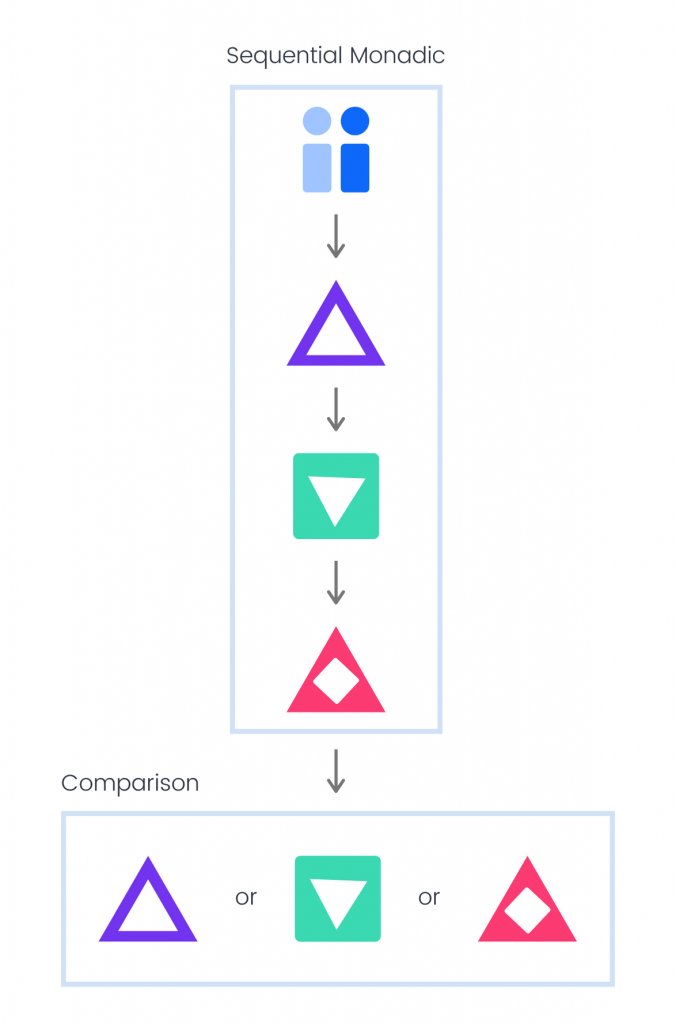
Protomonadic Survey Design
Protomonadic survey design refers to a monadic test that is followed by a comparison test. This is most often used with sequential monadic testing, where respondents are asked to evaluate several individual concepts, then choose the concept they prefer at the end.
Protomonadic research can be useful when validating a sequential monadic test, as it shows whether the preferred concept from the comparison is consistent with the feedback received about each concept.
Common uses for monadic tests (and variations of it) are ad-testing, product testing, concept testing, package testing, and more.
Monadic tests are a simple, yet effective, way for researchers to better understand the reasoning and details of a single concept so they can pivot their strategy, prioritize specific features, or replicate elements that tested positively across future projects.

Hire a research expert for your next project
Hire a research expert for your next project
TL;DR: Get the infographic!
Whether you want to do it yourself, or need a little assistance, there are different degrees of hands-on support available to design and launch your ideal Pollfish survey.

One of the ways that Pollfish stands out from other survey platforms is by offering our users real research expertise in building and designing the survey they need.
This is a powerful way to get the most out of the Pollfish platform.
Why trust your survey to a research expert?
Every role and industry has a need for data to learn, measure, and grow its success. However, not everyone who needs data has a background in research or analytics. This is why we offer Pollfish users the option to hire a research expert for their projects.
Bringing a research expert on board has been helpful for clients working on particularly complicated research projects, such as setting up a recurring study for brand tracking, as well as those who are newer to the platform and want more hands-on guidance with how the platform works. Even those who might like to run a Pollfish survey, but simply don’t have the time can rely on their researcher to set up, design, and launch a survey on their behalf giving them the power of a professional researcher on their team on a project-by-project basis.
The professional researchers at Pollfish are experts in market research best practices as well as the Pollfish platform, bridging the knowledge and experience gap typically left by market research tools that rely on a completely self-serving model.
How to hire a research expert
Adding a research expert to your project is an easy three-step process that sets your survey up for success.
Start by logging into your Pollfish dashboard. In the dashboard you'll see the option to "Hire an Expert," marked in green, on the upper right hand side, right beside your email address. This way, you can directly hire a research expert.
From there, you’ll be given an overview of what to expect during your process and invited to book a free consultation with a research expert.
During the free initial consultation, you’ll have the chance to chat with an expert who will work with you to understand your research goals and needs. Then, they will be able to build a quote based on how many questions, the number of completed responses, and the targeting parameters you will need to complete your research.
The quote from your expert will be based on the scope and targeting needed for your project, as well as the fee for their service. This amount ranges on the complexity of the project and is considered on a case-by-case basis, however, you will be quoted all associated costs of your project upfront to ensure you have all the information you need to make the right decision.
If you choose to hire a researcher to your team, your expert will be added to your team in the Pollfish platform, where they will ensure your survey project is properly designed and launched.
All researchers on the professional services team are experts in survey market research, as well as Pollfish’s tool and features, so you can feel confident that you have made an investment in your survey’s success.
What services do research experts provide?
Hiring a research expert in Pollfish offers a layer of customization beyond what the DIY platform offers. Some of the most common examples of work that our research experts have done for our clients include:
Building your survey on Pollfish.
If you have a survey created already and would like to deploy it on Pollfish but aren’t sure where to start, our research experts can offer a hands-on introduction. They will invite you to join them for a walkthrough of the platform as they design and set up your existing survey for you, giving you confidence that it’s done correctly and giving you the tools to launch it yourself next time.
Survey creation and design.
One of the most popular needs is having someone with professional experience and platform familiarity available to manage survey creation for you. For lean teams or those too busy or unsure about research to manage their own projects, Pollfish experts can take the burden of survey design and research off your plate entirely.
Data analysis
. Oftentimes when results come back they can be hard to interpret. Apart from knowing the ins and outs of our platform, our experts are professionals in distilling insights into usable information to make the most of your project.
Consulting on complex projects.
Oftentimes projects have bigger needs and harder-to-reach audiences that require the years of research experience that we offer. Our experts have been users of the platform since the beginning and have helped to shape many of the features, so they know exactly how to set up a Pollfish survey for even the most customized research needs.
Because project goals and needs can vary so significantly, it’s best to book a free consultation to align on expectations. Experts are committed to empowering you with what you need from DIY research, whether it's better platform education or lending a helping hand to your team. An initial conversation will help them guide you to the best solution for your project.
Other experts at Pollfish
If you’re not sure if your survey requires a professional researcher or would like to get started on your own, there are other professionals at Pollfish who are happy to help.
Pollfish Elite plan includes dedicated account managers to provide answers and guide you to resources to build your best survey. Account managers serve as a single point of contact for clients on this plan to contact for any Pollfish-related questions they have.
Our basic plan offers a pay-as-you-go model for those unable to commit to a larger plan, but still offers elite customer service. Our 24/7 CX team is made up of real people who can offer support throughout the survey creation process. They manually review every survey that is launched on the platform, giving them insight into common needs for all kinds of users and projects.
No matter your skill level or research goals, we are confident that we have the team that can help you get there.