
Conversational AI: How to Hold Real Conversations With Real Insights, at Scale
Surveys don’t have to feel like, well…surveys.
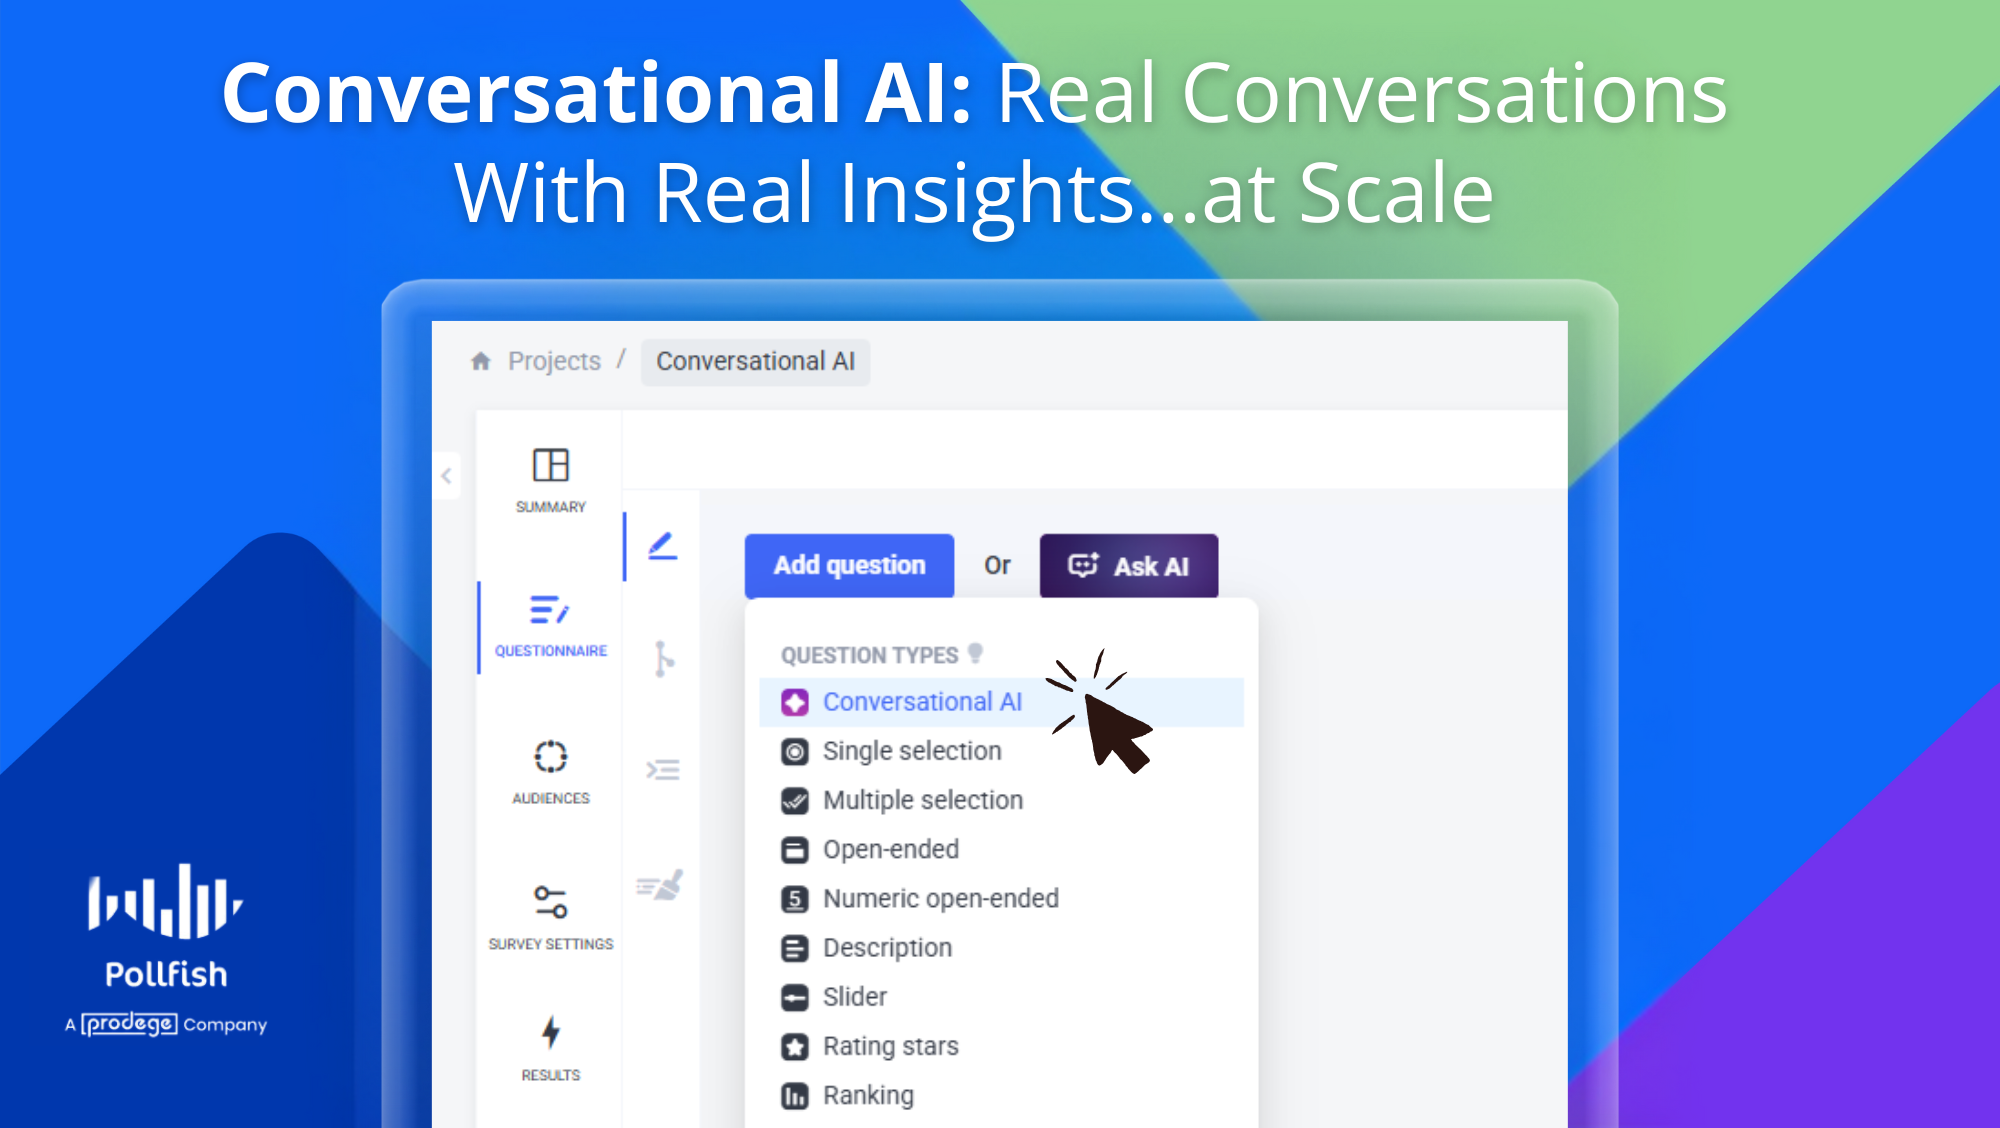
With Conversational AI, we’re bringing a whole new level of engagement to Pollfish. This powerful new question type allows you to have real-time, one-on-one conversations with respondents, powered by AI and delivered at scale.
It’s more than just a new format. It’s a smarter way to uncover the why behind consumer behavior.
What is Conversational AI?
Conversational AI is a survey question type that engages respondents in a dynamic, AI-led chat experience - just like chatting with a real person.
Unlike traditional open-ends or multiple choice questions, Conversational AI encourages richer, more thoughtful responses by replicating the feel of a real conversation. And because it’s backed by AI, it can happen in real-time with thousands of people at once.
Whether you want to go deep on a single topic or weave this format into your broader survey, Conversational AI fits seamlessly into your project. Use it as a standalone study, or mix and match with other Pollfish question types within your survey.
Why use Conversational AI?
This question type combines the best of qualitative and quantitative research in one experience. Here’s what makes it a game-changer:
✅ Real Conversations: Engage with the Pollfish Audiencel for natural, back-and-forth chats that surface tone, emotion, and nuance faster than traditional qual.
✅ Deeper, More Authentic Insights: Dynamic prompts help respondents open up, yielding more thoughtful responses.
✅ Fast, Actionable Summaries: No need to comb through raw text. We'll instantly synthesize key themes and takeaways into a clear, executive-ready summary.
✅ Flexible by Design: Use Conversational AI as part of a mixed-methods survey or as a focused deep-dive. DIY it, or get support from our expert research team.
✅ Cost-Effective: Get the depth of interviews without the heavy lifting. No scheduling, no transcription, no moderators required.
Great for Questions Like...
Whether you're testing early-stage creative or measuring emotional reactions, Conversational AI shines when tone and depth matter most.
Use it for:
Brand sentiment or perception
Post-experience feedback
Concept or creative testing
Exploring motivations, habits, or attitudes
Any question where “why” matters more than “what”
How It Works
- Create a Guide: Start by writing a short discussion guide or key goals for your question - Conversational AI uses this to lead the conversation.
- Launch the Survey: Pollfish connects your survey to your target audience, gather qualitative feedback from hundreds (or thousands) of respondents quickly and asynchronously.
- Get Smart Summaries: When the data’s in, we compile the key themes and insights so you can act fast. On a respondent level and at a project level. There's no manual analysis required.
Want step-by-step instructions in setting up a Conversational AI question? Check out our Conversational AI Help Guide →
Ready to Start a Conversation?
You’ll find Conversational AI in the questionnaire menu when building your next survey. Create a new project → Select your audience → Add question → Select Conversational AI
Need help getting started or want to brainstorm how to use it in your research? Our team’s standing by 24/7. Use the live chat to connect with our support team anytime. Our experts can assist you with your setup.
You can also book a session directly from the chat for a live demo or personalized guidance.
Build your first Conversational AI survey now →
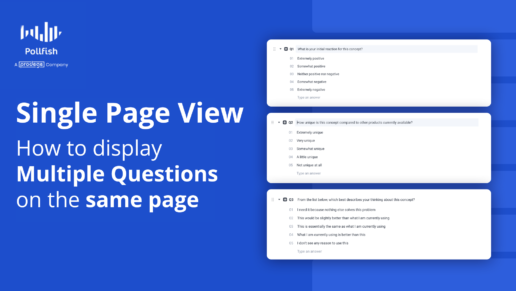
Using Single Page View to Display Multiple Questions on the Same Page
Single Page View - For Natural Topic Grouping

By default, Pollfish shows one question per page to your respondents.
But there are times when you might want to show multiple questions together in a group, say for shorter surveys or when you want respondents to answer questions in context around a topic. If that's what brought you here, then you're looking for our Single Page View feature.
Where to Find Single Page View
Once you've loged in to your Pollfish account and created a project, or navigated to your existing survey draft...
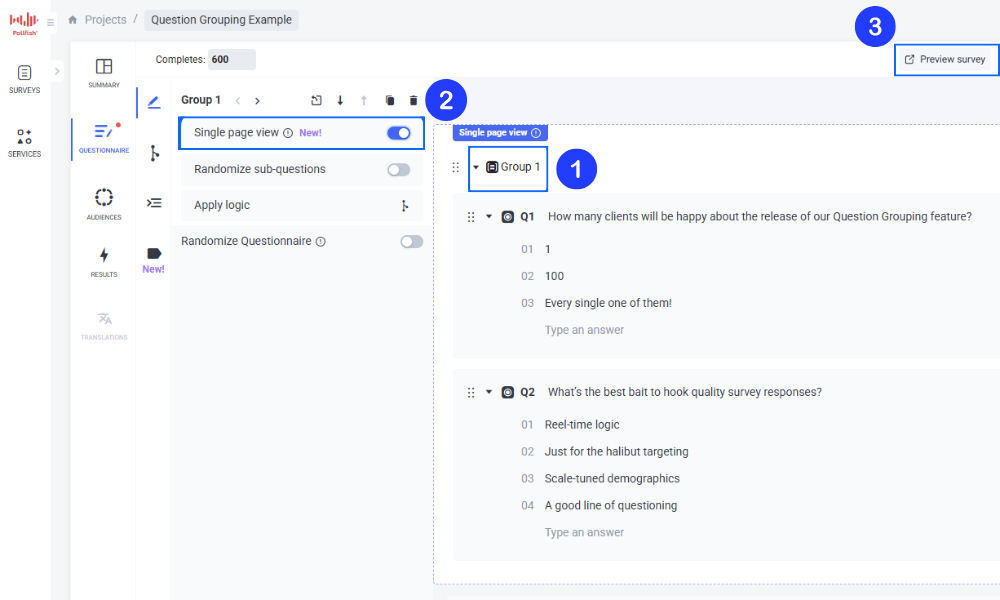
From the Add Questions menu button, add your questions to a question group
In the group settings, toggle "Single Page View" to ON
Once enabled, the selected questions within that group will appear on the same page to respondents, and can be viewed using the Preview Survey button (in the top right of your screen)
Example Use Cases
Customers asked us for the functionality to show multiple questions on the same page for a variety of reasons. Here's just a few requests, to give you inspiration:
Customer Satisfaction Surveys: "I'd like to group multiple related CSAT questions to minimize clicks and respondent fatigue"
Product Feedback: "We'd like to ask questions about features, usability, and expectations all in one view"
Behavioral Research: "By asking similar topic questions on a single page, we'd reduce cognitive interruption between questions by grouping them logically"
Need Help?
We’re here for you! Use the live chat to connect with our support team 24/7. Our experts can walk you through question grouping and the Single Page View feature to help with your setup.
You can also book a session directly from the chat for a live demo or personalized guidance.
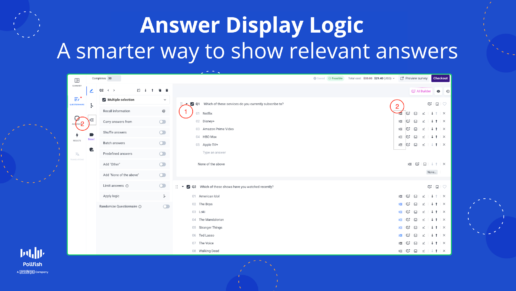
Answer Display Logic
A Smarter Way to Show Relevant Answers
Pollfish now gives you more control over your survey flow with Answer Display Logic, a powerful feature available directly within the Questionnaire Builder. This enhancement allows you to dynamically tailor answer options based on a respondent's previous inputs—making your surveys more personalized, relevant, and efficient.
What is Answer Display Logic?
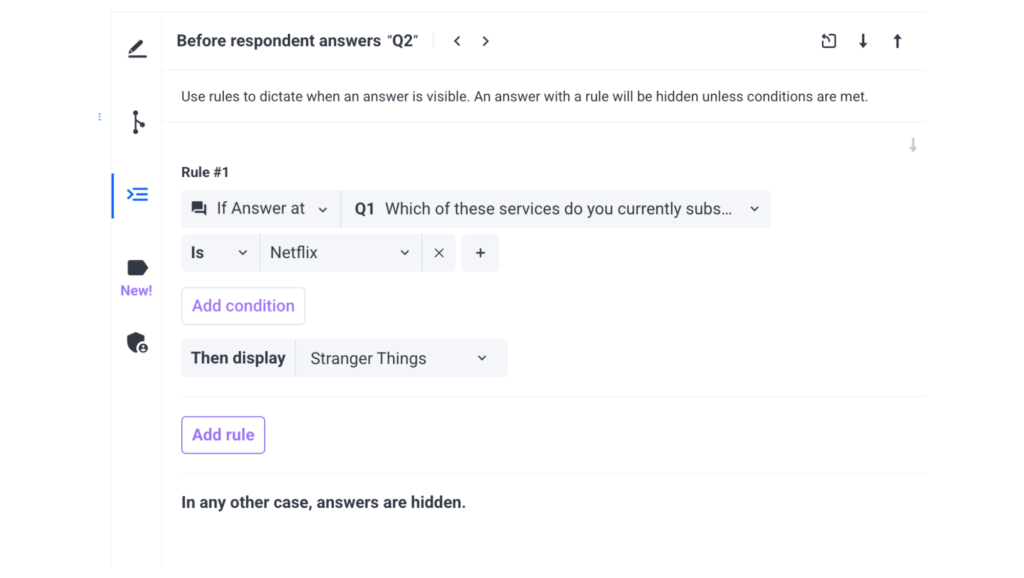
Answer Display Logic enables you to show specific answer choices only when certain conditions are met. This means you can tailor questions to the unique experiences or characteristics of each respondent, enhancing clarity and avoiding irrelevant options.
For example: If a respondent says they subscribe to Netflix in an earlier question, you can set up logic so that only "Stranger Things" appears in a follow-up question asking what shows they’ve watched recently. Respondents who did not select Netflix won’t see that option.
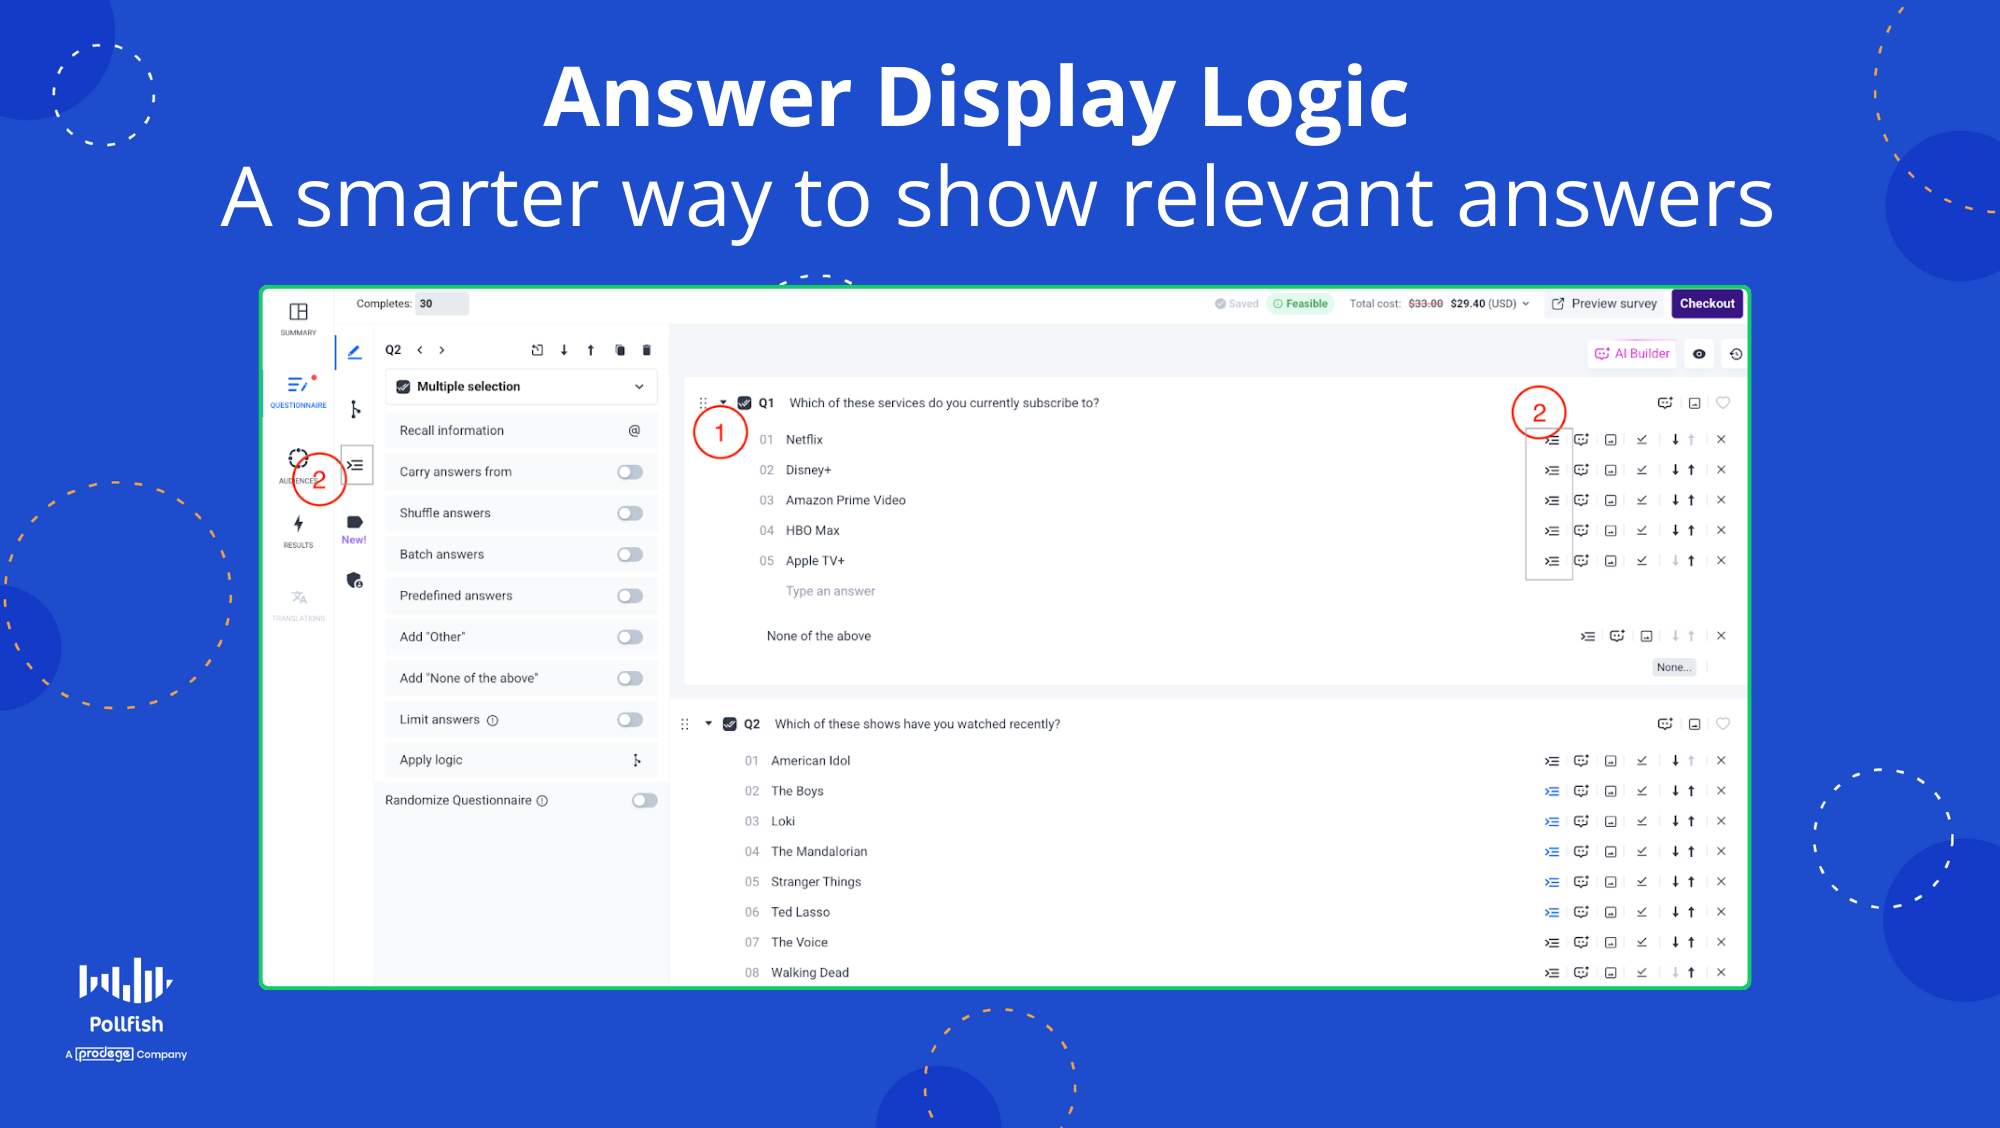
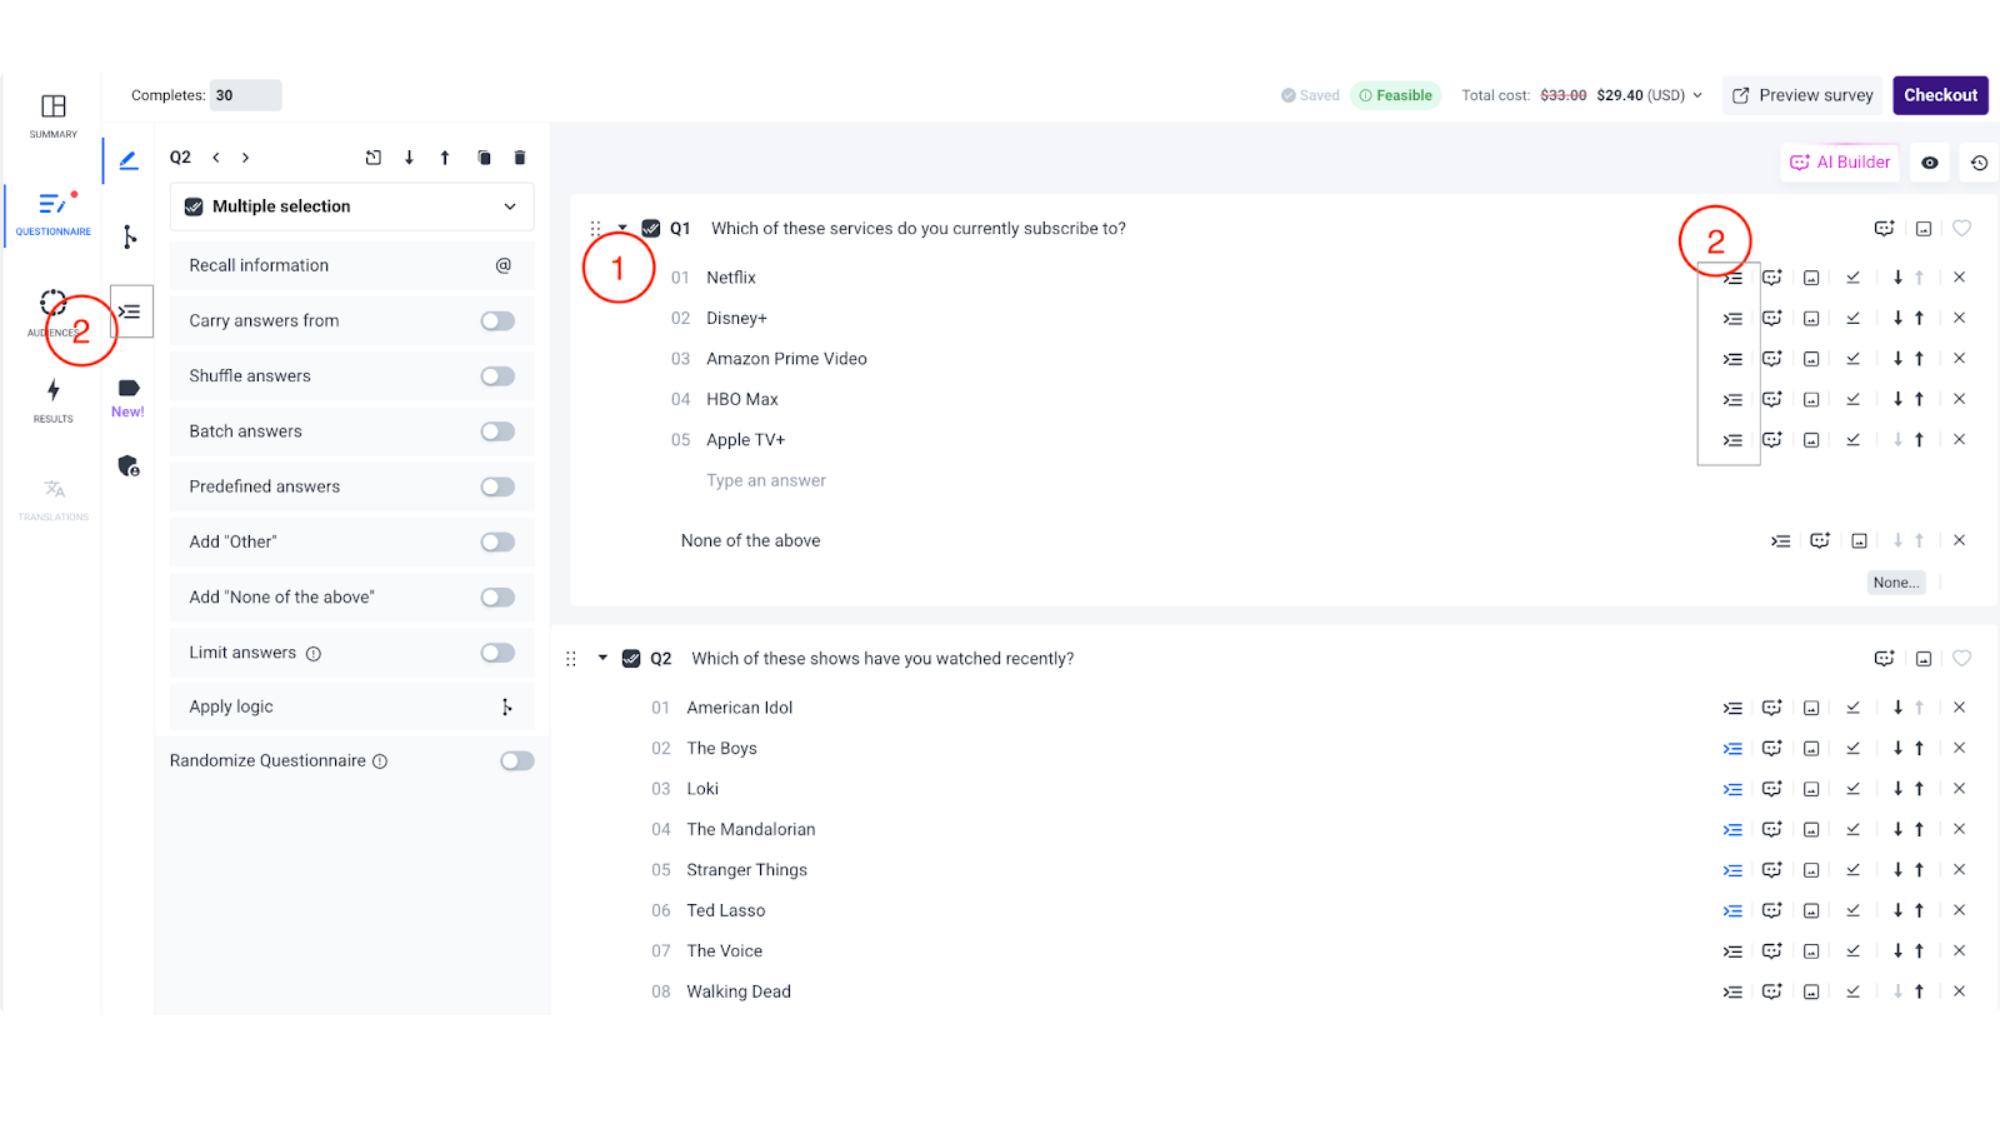
How to Set Answer Display Logic
Follow these steps to conditionally display an answer based on prior behavior:
- Log in and create or open your draft survey
- Select the question where you want answers to be shown conditionally.
- Click the "Edit Answers Display Logic" tab on the left-hand side (just below the "Edit Advanced Logic" section) OR click on the Answers Display Logic icon next to the specific answer you want to conditionally display.
- Set the conditions that must be met—these can be based on:
- Answers to previous questions
- Hidden variable labels
- Targeting parameters (from your audience setup)
- Answers to previous questions
- Answers with display logic will remain hidden unless the defined conditions are met.
- You can use one rule to show or hide one or more answer options within a question.
- That’s it! You’re all set to deliver a tailored, intelligent survey experience.
Compatible Question Types and Features
Answer Display Logic is currently supported on the following question types:
- Single Selection
- Multiple Selection
- Ranking
- Matrix (rows/columns, bipolar statements only)
Other features supported:
- Display logic on [Other] and [None of the Above] options
Works with "Shuffle answers" feature
Limitations and Incompatible Features
To help you avoid errors, it’s important to know what Answer Display Logic does not currently support:
- Only one rule can be applied to each answer option, but that rule can contain multiple conditions using AND/OR logic.
- Not compatible with the following question types:
- Slider
- Open-ended (including Numeric Open Ended)
- NPS
- Description
- Rating Stars
- Drill Down
- All Research methods (e.g. Conjoint, A/B Testing)
- Slider
- If a question also has Skip Logic, ‘’Answers Display Logic’’ rules will be evaluated first, followed by Skip Logic.
- Each question must include at least one answer that's always visible to all respondents—meaning it’s not carried forward and has no display logic applied. This ensures there's never a case where all options are hidden.
- Question shuffling (also referred to as ‘’Randomize Questionnaire’’) and Answer Display Logic cannot be used together.
Editing and Removing Answer Display Logic
Once your survey is live, you can still edit or remove Answer Display Logic rules (‘’Edit Survey’’ option) for any remaining responses.
Additional ADL Issues & Error Handling
Pollfish will flag any logic issues automatically, such as:
- Setting conditions based on a question the respondent hasn’t yet answered
However, if you create Answer Display Logig rules based on a question that may be skipped due to Skip Logic, some respondents may never encounter the conditional answer option. It's important to carefully review your survey flow to ensure all intended respondents have access to the relevant questions and answers.
Need Help?
We’re here for you! Use the live chat to connect with our support team 24/7. Our experts can walk you through the Answer Display Logic feature and help with setup.
You can also book a session directly from the chat for a live demo or personalized guidance.

5 Best DIY Market Research Tools (+ How to Pick the Right One)
5 Best DIY Market Research Tools (+ How to Pick the Right One)
For companies with complex research needs or limited bandwidth, full-service market research can be a lifesaver — but it’s expensive. That’s why many businesses are switching to DIY market research tools.
These platforms cut costs and deliver fast results, often within hours or days, rather than the weeks it takes with full-service firms.
In this post, we’ll cover:
Common pitfalls to watch for when selecting a DIY market research tool
The 5 best DIY market research tools, starting with Pollfish (our own platform)
Note: This post focuses solely on DIY survey tools. For other types of DIY research software, check out this article.
Common Pitfalls to Avoid When Picking the Best DIY Market Research Tool
Conducting your own market research surveys is easier than ever with today’s DIY platforms. The research process typically involves three steps:
Define your target audience using demographic filters
Build your survey questionnaire with intuitive tools
Analyze results through built-in reporting features
Top platforms not only offer user-friendly interfaces but also include complimentary access to expert support — market researchers who can help guide your survey design and ensure high-quality data.
However, there are a few common pitfalls with most DIY tools:
🚫 Reliance on Third-Party Respondents
Instead of nurturing their own respondent communities, many DIY survey tools (such as SurveyMonkey, Qualtrics, and others) purchase survey respondents from external third-party panel providers. These providers frequently use a payment model that exclusively rewards respondents with cash for completing surveys.
This incentive structure leads to the emergence of "professional survey takers" who quickly rush through dozens of surveys each day without carefully reading the questions in order to maximize their earnings. As a result, the quality of the data collected and the overall effectiveness of the research can be compromised.
🚫 Overpromising on Turnaround Time
Despite claiming a quick turnaround time, the process can sometimes take longer than the time-sensitive nature of your research project, potentially causing missed opportunities or delaying the launch of new products and campaigns.
🚫 Subscription-Based Pricing & Hidden Fees
Many DIY platforms utilize a subscription-based pricing model, which can lead to unused capacity and wasted budget if the tool is not consistently used.
Additionally, the true cost of using these platforms is often not transparent upfront, with potential hidden fees for access to premium features such as advanced targeting options, enhanced data visualization, and so on. These hidden fees can accumulate quickly, resulting in a significantly higher total cost than initially anticipated.
🚫 Lacking Essential Survey Design Features
Many DIY market research tools have feature limitations that can compromise the quality and relevance of your research in three areas:
Settling for broad audiences: Some platforms force you to use a broad, generic audience instead of the highly targeted, niche segments needed for your specific research objectives.
Limited questionnaire design capabilities: If you require an advanced survey flow (e.g., complex branching logic), you may have to make compromises due to limited questionnaire features.
Inadequate built-in data analysis: Many platforms lack robust data analysis tools, often requiring you to export data to Excel for manual analysis. This process is time-consuming and inefficient compared to having built-in analysis functionality.
Up next, we’ll explore how Pollfish (our DIY survey tool) addresses these limitations and lets you gather high-quality, reliable market research data without the high costs associated with agencies. Additionally, we’ll provide a brief overview of several other DIY market research tools to help you make a well-informed decision.
5 Best DIY Market Research Tools
1. Pollfish
Below, we'll cover how Pollfish (our own DIY survey platform) excels in several key areas:
Build your research on reliable responses from our first-party panel communities we directly own and nurture (rather than purchase from external third-party sources), enabling comprehensive quality controls.
Receive results within hours for broad audience segments, and typically within a few days for more niche or specialized groups. Our speed outpaces not just traditional research providers and agencies, but also most other DIY market research software.
Pay only for what you use with transparent, usage-based pricing that shows your exact cost in real-time as you build your survey, eliminating subscription fees and unused capacity, and the surprise costs that plague several other platforms.
Create surveys exactly to your specifications with robust audience targeting capabilities, advanced questionnaire design, and built-in analytics tools that never force you to compromise on your research goals due to platform limitations.
Build Your Research on Reliable Responses From Our First-Party Panel Communities
At Pollfish, we own and operate our own respondent communities through our parent company Prodege. This first-party approach gives us complete control over data quality and lets us set control measures that other DIY tools relying on third-party panels cannot match:
❇️Natural Environment Engagement
Unlike traditional third-party survey panels where participants take dozens of surveys consecutively, our respondents encounter surveys organically while using apps for gaming, shopping, utility, etc. They receive meaningful in-app rewards (like extra lives in games, premium features, or discounts) that enhance their existing app experience.
This contextual approach means respondents are more engaged when answering questions, rather than rushing through surveys as their primary task. The result is more thoughtful, authentic responses that better reflect consumers' genuine opinions.
❇️ 30-Day Respondent Evaluation Period
All participants undergo a mandatory 30-day evaluation period before accessing client surveys. During this time, they may only complete internal profiling surveys, allowing us to establish baseline response patterns and verify the demographic consistency.
❇️ Receipt-Verified Targeting Accuracy
We verify purchase behavior through digital receipt uploads to ensure unmatched targeting accuracy. For instance, if a consumer uploads a receipt for Frosted Flakes cereal from the past month, you can specifically target verified Frosted Flakes buyers in your survey.
This method is far more reliable than self-reported preferences, as it's based on purchase actions rather than respondent claims.
❇️ Verified Digital Behavior Targeting
In addition to product receipts, we track respondents' verified digital activities, allowing you to target based on websites visited or services used. This enhances the relevance of your survey audience by relying on real behaviors, not self-reported preferences.
❇️ Multilayered Fraud Prevention Measures
We implement comprehensive anti-fraud measures throughout the survey process, including unique user ID tracking that prevents duplicate responses, sophisticated trap questions that challenge automated systems, advanced IP validation technology to block VPN and proxy users, and response timing analysis to identify suspicious answering patterns.
This is just the tip of the iceberg. Ensuring the highest data quality isn’t just a priority, but a core part of who we are as a company. Through our parent company, Prodege, we continually invest in cutting-edge technologies, rigorous methodologies, and top-tier talent to maintain our position as an industry leader in data quality.
Get Fast Survey Results for Both Mainstream & Niche Audiences
We pride ourselves on delivering high-quality survey results faster than many competitors:
❇️ Within hours for broad mainstream audiences
When targeting broad demographics (e.g., U.S. adults about their dining habits), you can typically collect 500+ responses within hours. This impressive speed is driven by our large, highly engaged proprietary respondent communities.
❇️ Within days for specialized niche audiences
For more specialized audiences (e.g., HR decision-makers at companies with 500+ employees), the process naturally takes more time — typically several days. However, even for niche groups, our turnaround times consistently outpace self-service market research platforms, and far exceed traditional research firms, which can take weeks or months.
Please note: Our team can provide precise turnaround estimates based on your exact targeting parameters. Reach out here for more information.
Transparent, Usage-Based Pricing: Only Pay for What You Use
We've designed our pricing structure to be straightforward, flexible, and free from the hidden costs that plague many other market research platforms:
❇️ Only pay for what you use
With our pay-as-you-go model, you're only charged for the survey responses you collect, starting at just $0.95 per response. There are no expensive monthly or annual subscriptions, and you’re never locked into paying for capacity you might not use. As your research needs fluctuate, our pricing adapts accordingly — with no minimum commitments or rollover fees.
❇️ Include your entire team at no extra cost
We offer unlimited user access across your organization, without charging per-seat license fees. Whether you have 5 team members or 50, everyone can create surveys, analyze results, and export reports with no additional charges. This stands in stark contrast to competitors who charge substantial fees for each additional user.
❇️ See your total cost for each survey before you commit
Our platform displays your complete project cost in real-time as you build your survey, showing both per-response rates and total cost.
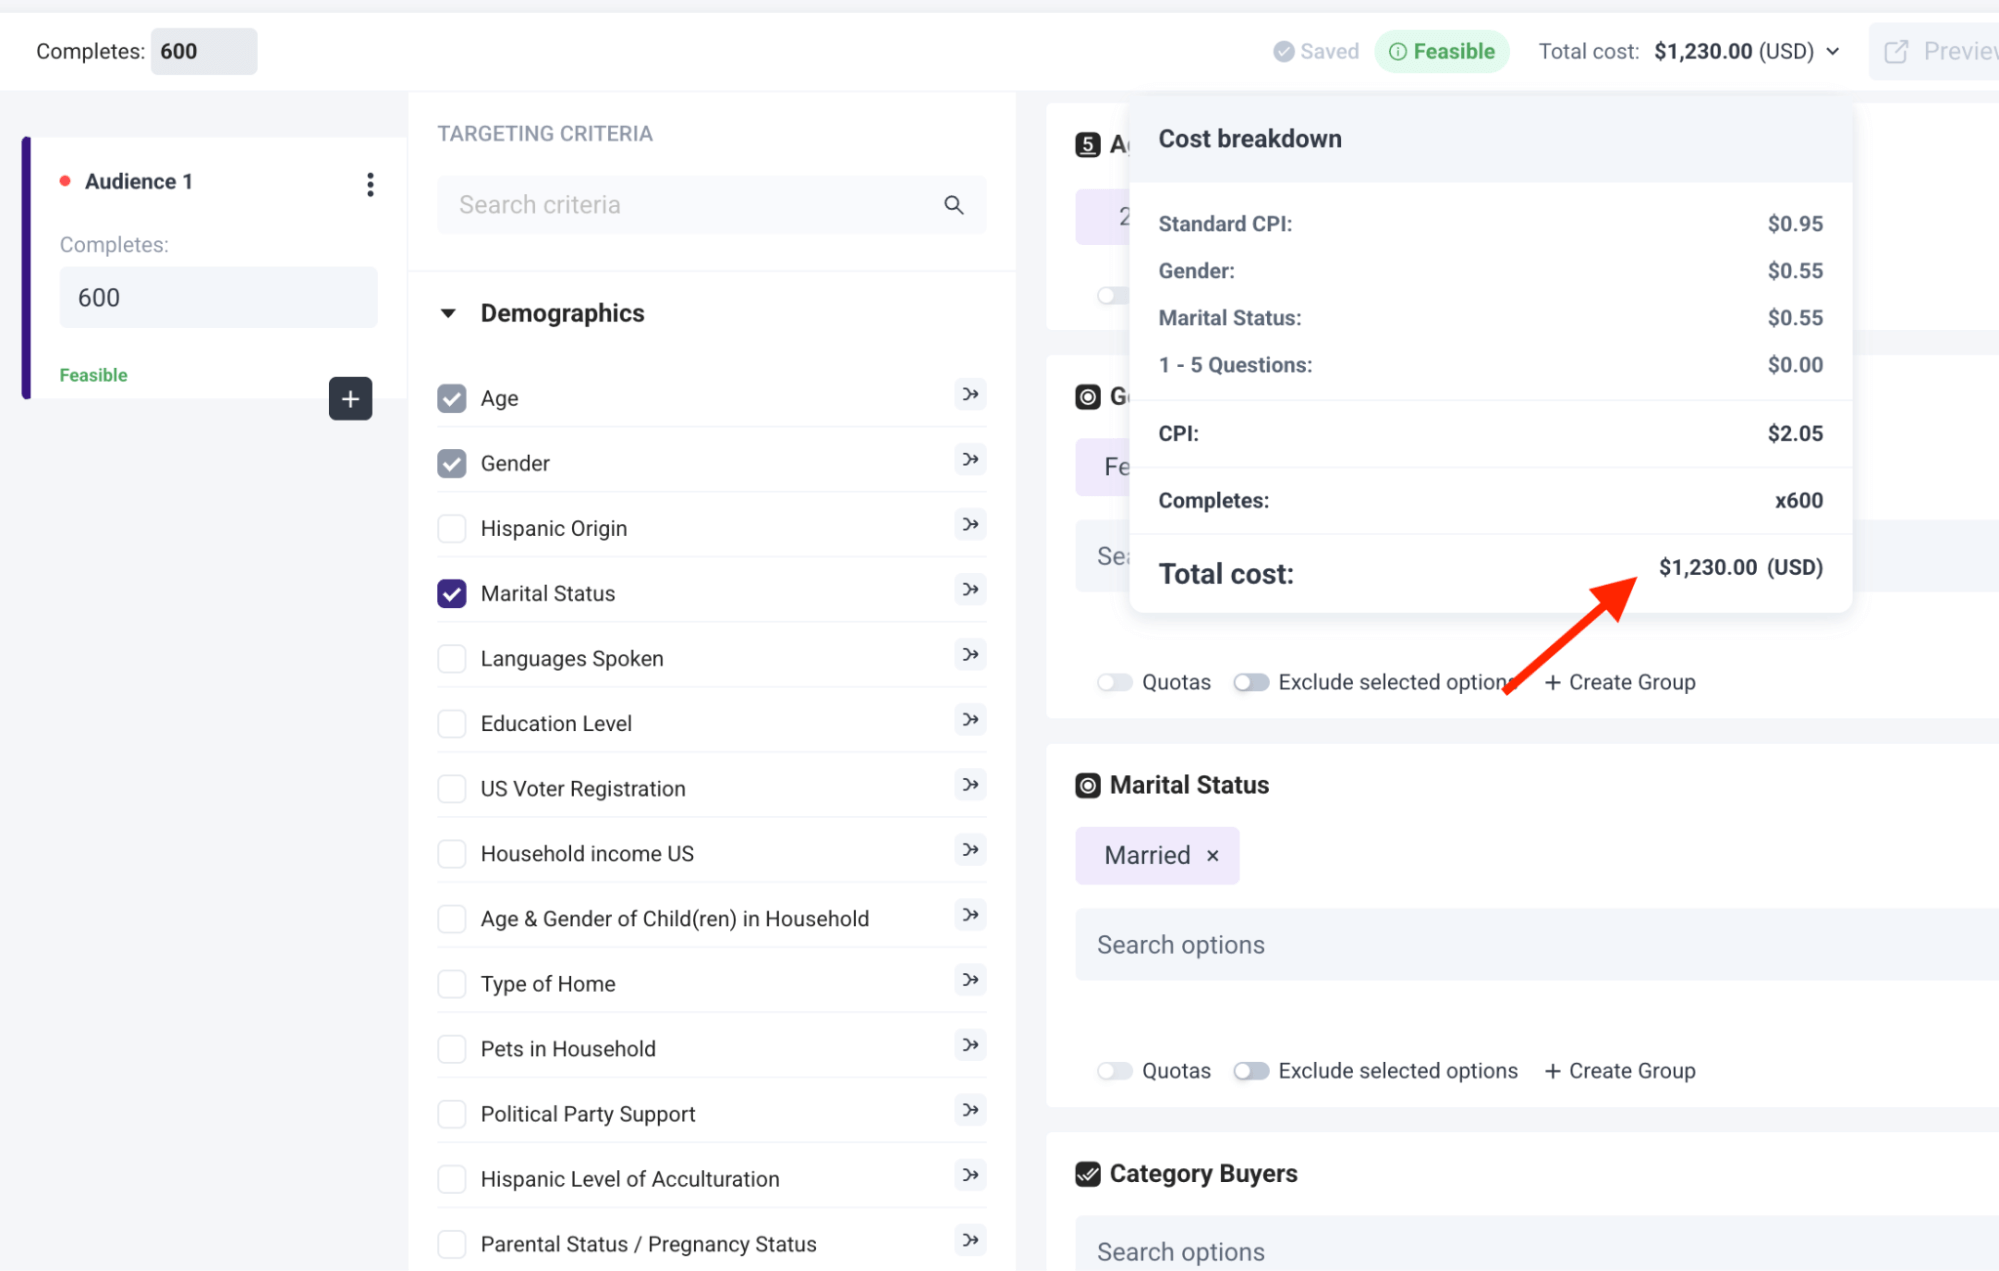
For example, if you're creating a consumer preferences survey targeting women aged 25–45 who shop at specialty grocery stores, you'll see the base cost ($0.95), plus additional costs for each targeting parameter (perhaps +$0.55 for the gender filter and +$0.55 for the shopping behavior filter), giving you a total of $2.05 per response.
If you need 600 responses, you'll immediately see your total project cost of $1,230 before launching — no surprises, no hidden fees, and no unexpected charges appearing after your survey is complete.
Precise Audience Targeting Capabilities
Some tools force you to settle for broad, generic audiences, limiting your ability to target the niche segments crucial for your research. With Pollfish, you never have to compromise:
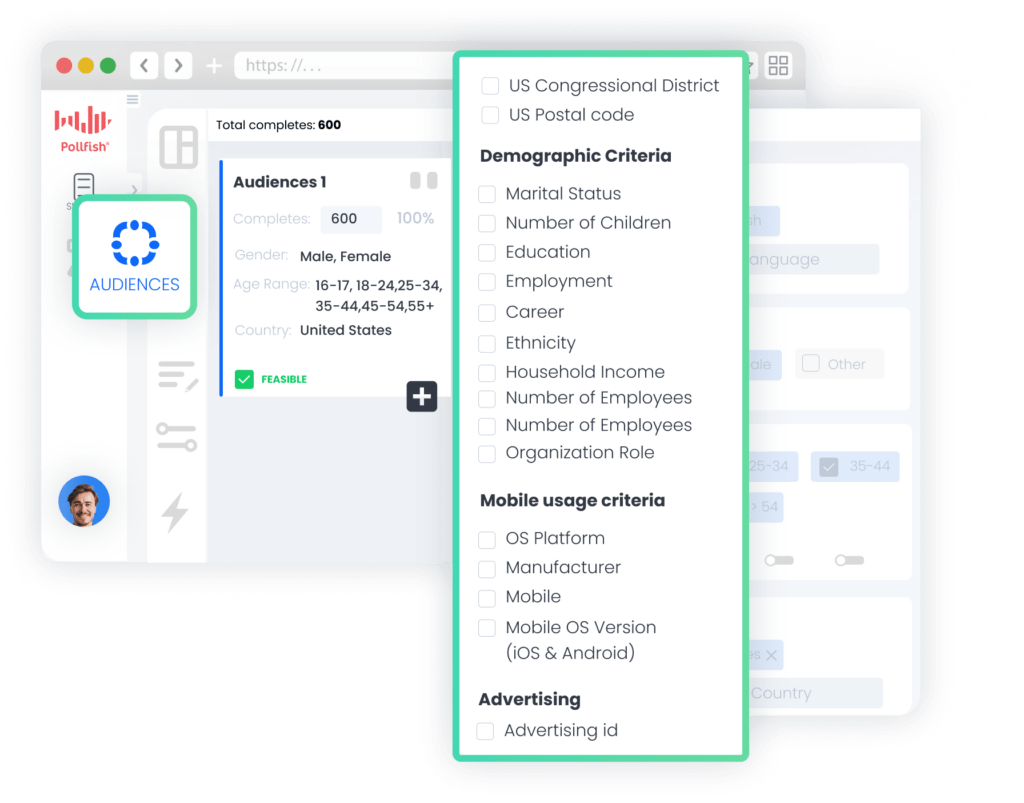
❇️ Comprehensive Targeting Parameters
Select from over 50 distinct targeting criteria across six intuitive categories (Demographics, Geographic, Consumer Lifestyle, Employment, Behavioral Data, and Media).
For example, you can select broad parameters like "College-educated professionals" or hyper-specific segments such as "Female corporate executives ages 35–44 in the Pacific Northwest who own German luxury vehicles, have purchased organic coffee in the last month, and use financial planning apps."
❇️ Audience Quota Management
Set precise demographic distribution requirements to ensure perfectly balanced representation across key segments. This prevents skewed results from overrepresentation while maintaining statistical validity.
Flexible Questionnaire Design Tools
Many tools force you to compromise on survey design for advanced questionnaire functionality (e.g., complex question types, intricate branching logic).
In comparison, with Pollfish, you get:
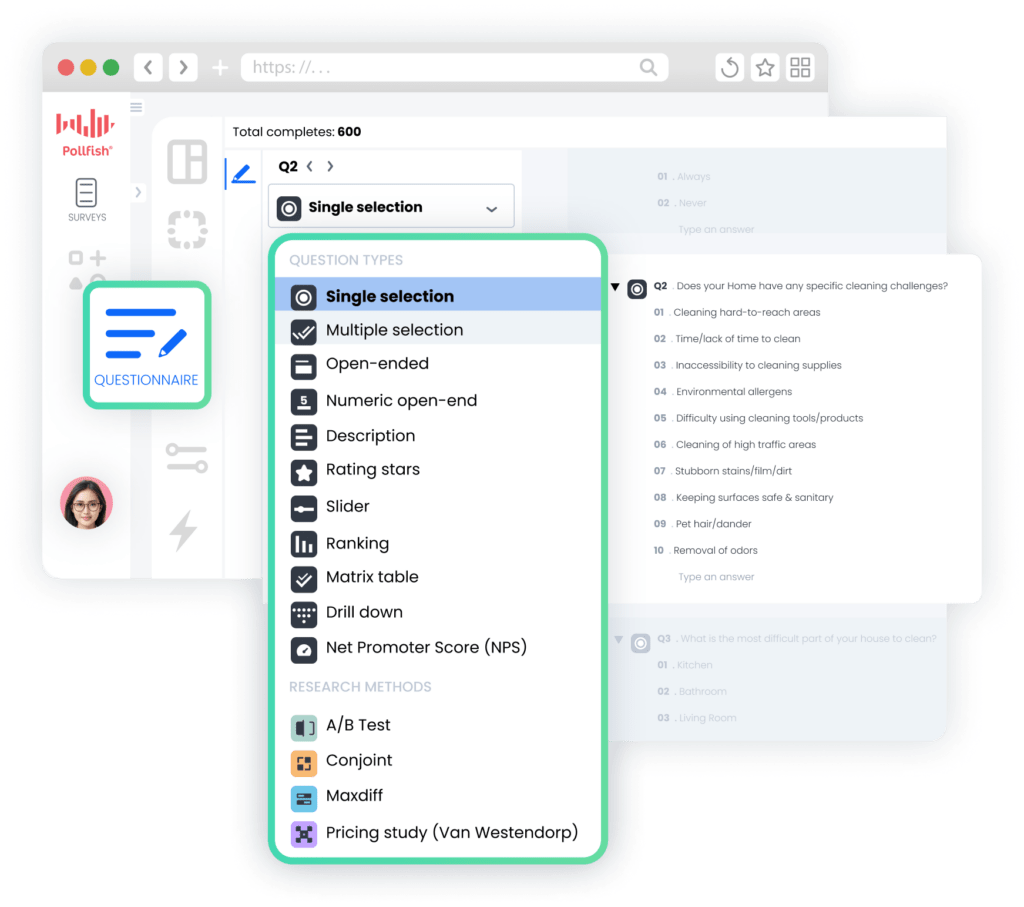
❇️ Diverse Question Type Library
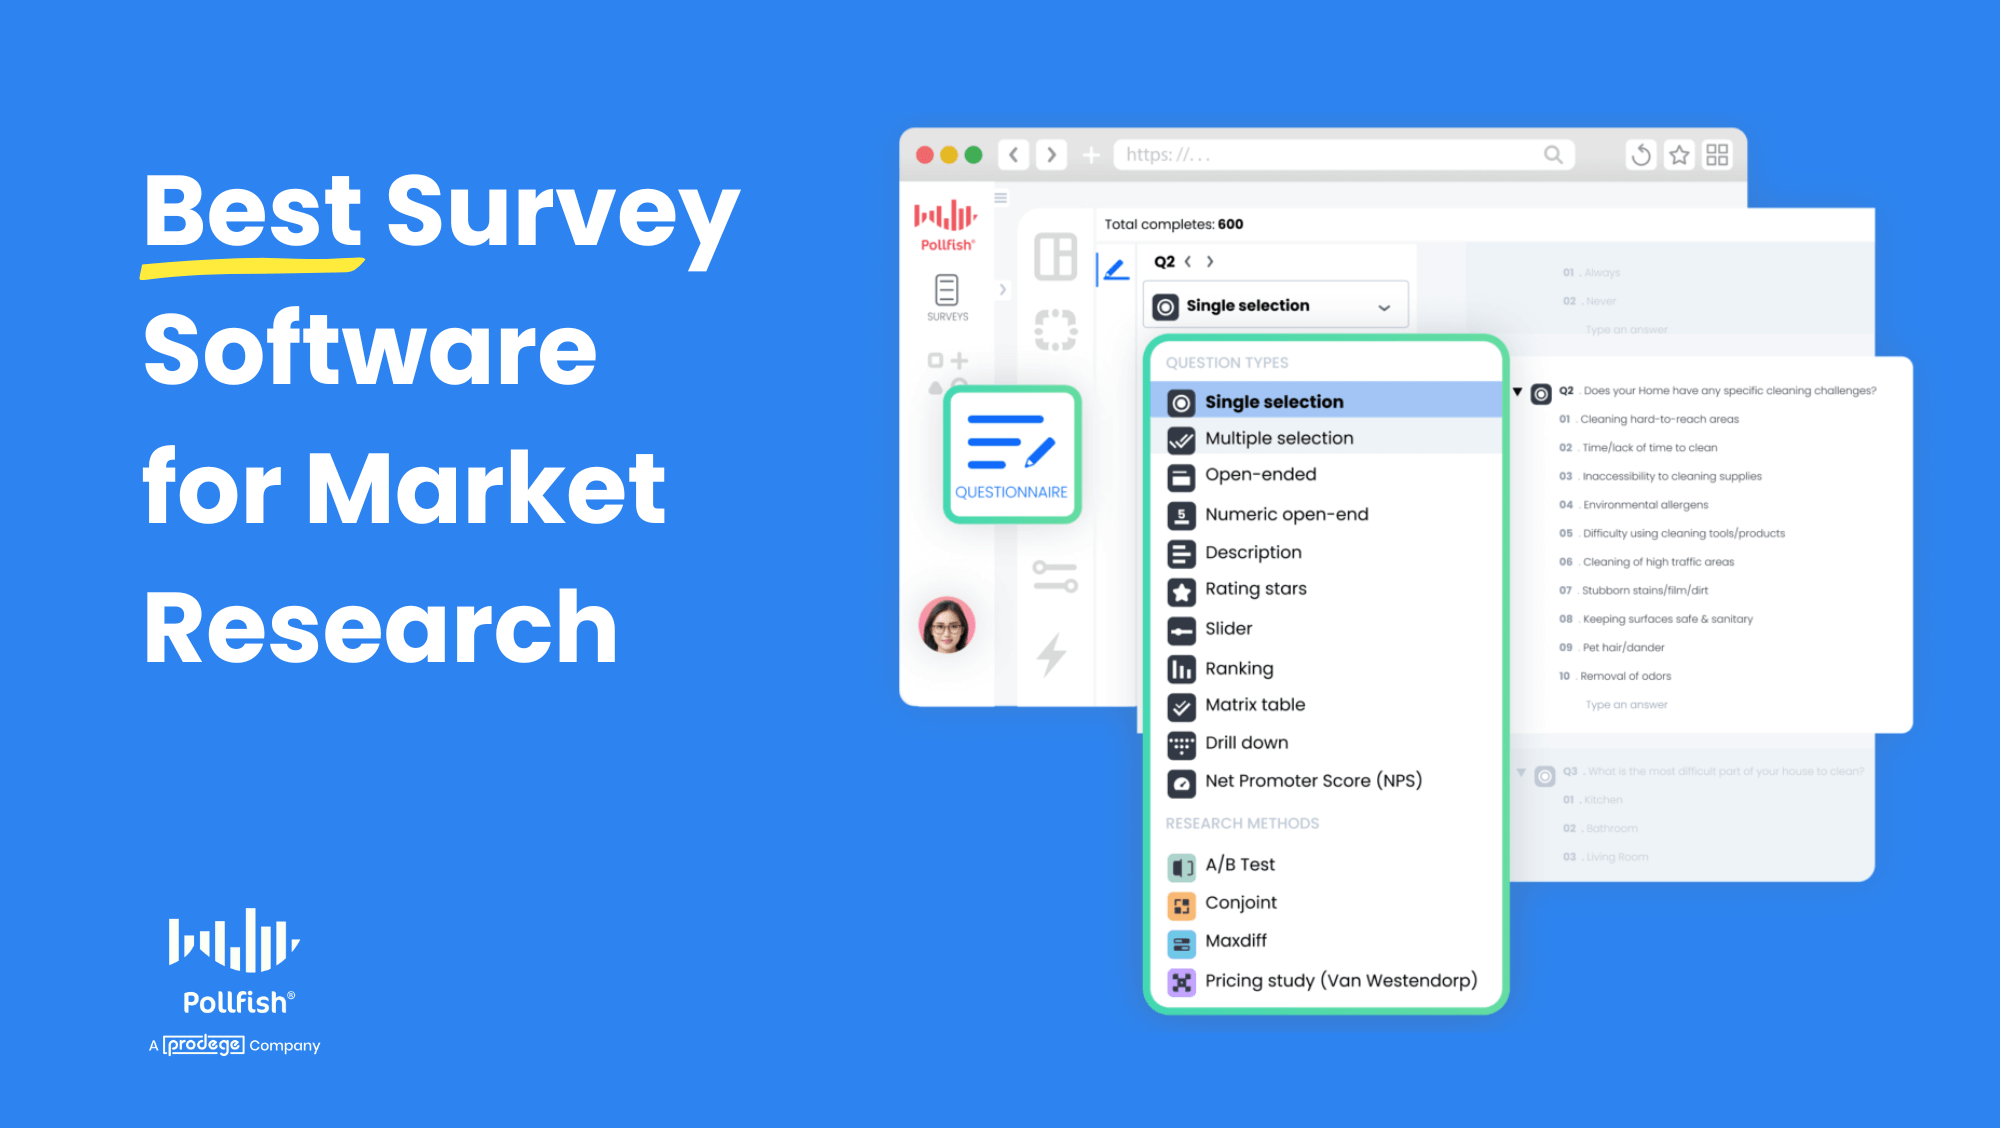
Choose from 14 question formats, from basic (single/multiple selection, open-ended questions) to advanced (matrix questions, slider scales, ranking), plus specialized research methods (conjoint analysis, MaxDiff, Van Westendorp pricing), and more.
❇️ Sophisticated Skip Logic and Branching
Create personalized survey paths based on prior answers, allowing different respondent segments to view tailored question sets that maximize relevance and enhance the survey experience.
❇️ Bias-Reducing Randomization Features
Automatically shuffle question and answer choice positions to eliminate primacy and recency bias, improving data quality and preventing skewed results.
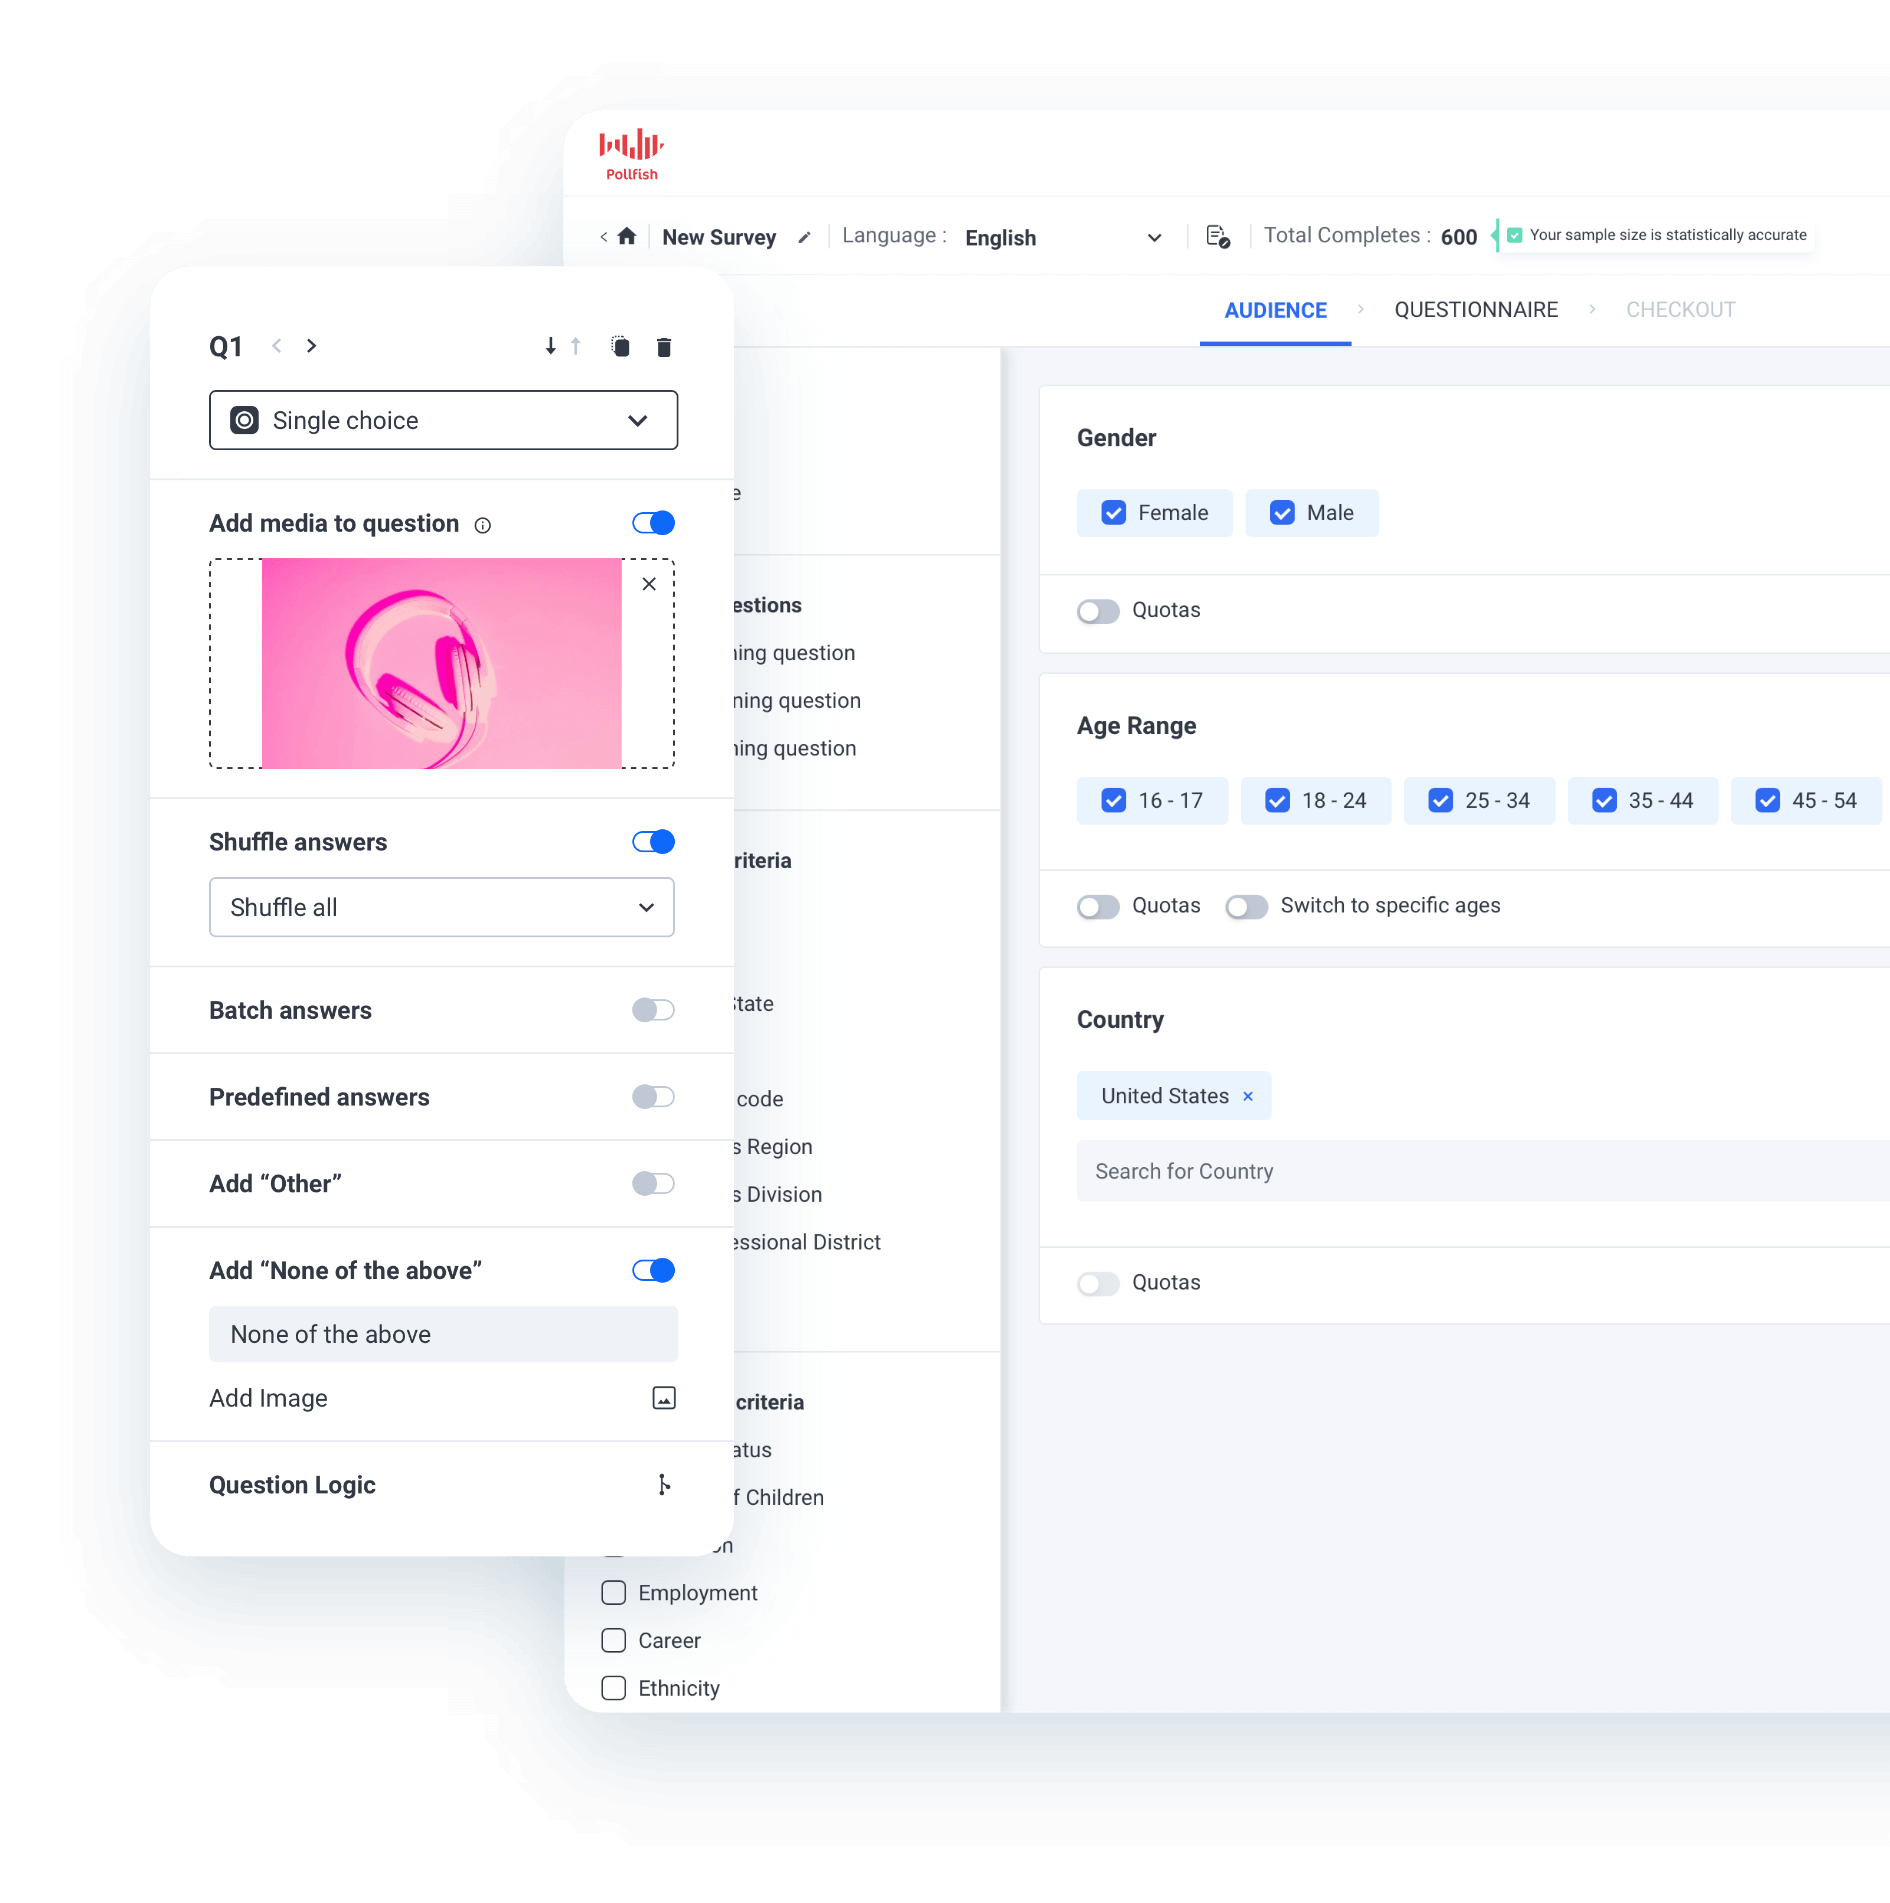
❇️ Multimedia Integration Capabilities
Easily incorporate images, videos, and audio into your survey questions, enhancing testing scenarios for concepts, advertisements, packaging designs, and more.
❇️ AI-Powered Survey Creation
Use artificial intelligence to generate professionally designed surveys from simple prompts, reducing development time and ensuring consistent application of best practices throughout your questionnaire.
❇️ Pre-Built Survey Templates
Access a library of expert-designed survey templates for common research objectives (brand tracking, customer satisfaction, concept testing, etc.), offering solid starting points that can be tailored to your needs.
Powerful Data Analysis Capabilities
Many DIY survey tools bury insights under weak reporting features, forcing you to export to Excel and spend hours hunting for key data.
In contrast, Pollfish includes a suite of powerful reporting tools to uncover valuable insights, including:
❇️ Real-Time Results Dashboard
Track responses as they roll in with dynamic visualizations. Spot trends early and adjust your strategy on the fly — no need to wait for full completion — enabling faster, smarter business decisions.
❇️ Multi-Dimensional Response Filtering
Instantly analyze results by specific demographic segments or response patterns (e.g., "show me responses only from dissatisfied customers in urban areas"), dramatically reducing the time between data collection and insight discovery.
❇️ Automated Statistical Significance Testing
See at a glance which differences between segments are statistically significant, eliminating guesswork and helping you avoid acting on random noise.
❇️ Customizable Data Visualization Options
Build the exact visualizations your report needs, from chart types to color schemes — professionally presented, aligned with your brand guidelines, and designed to make insights easy to grasp.
❇️Flexible Export Capabilities
Export research results and visualizations to multiple formats (PDF reports, Excel spreadsheets, SPSS files, PowerPoint presentations, etc.) — making it easy to share findings with stakeholders or dive deeper in specialized tools.
Get Started with a Free Pollfish Account
Sign up for a free account or schedule a one-on-one demo to explore how Pollfish can meet your specific needs and use cases.
2. Qualtrics
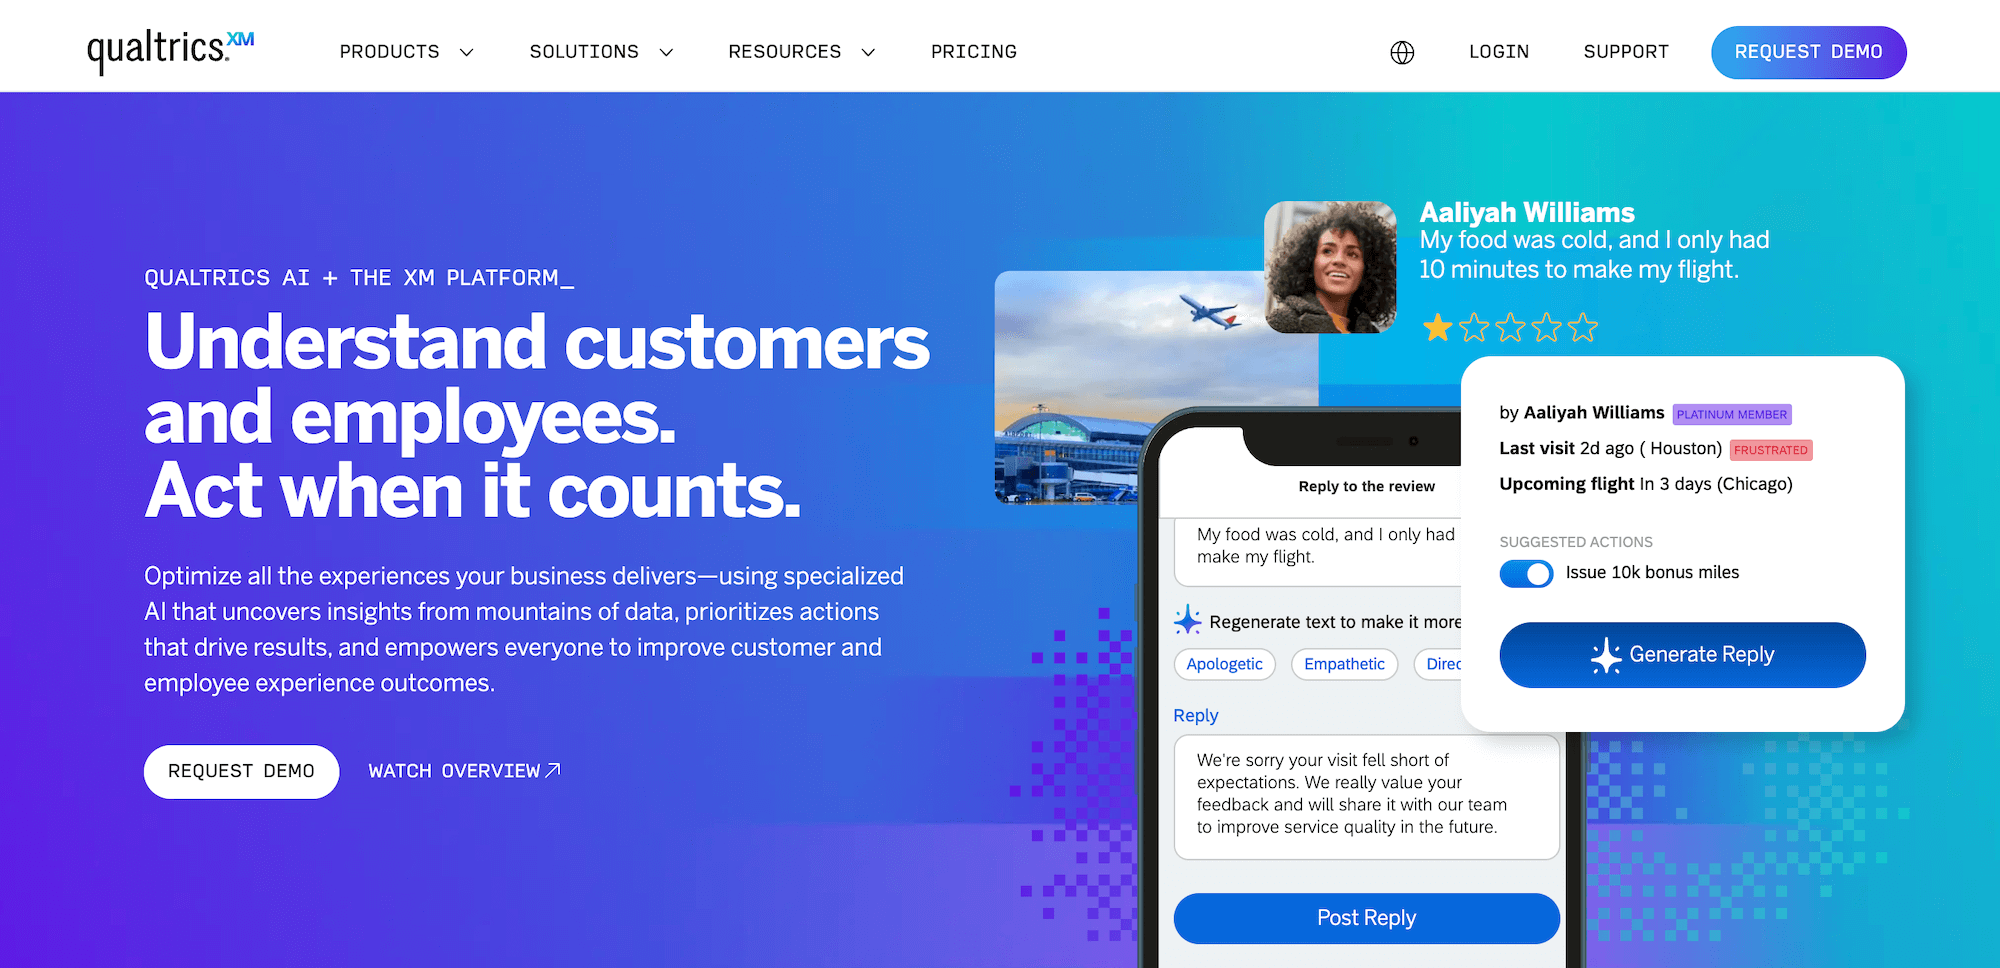
While Qualtrics offers DIY survey functionality, its subscription pricing model with per-user license fees may be less accessible for smaller teams or occasional research.
Beyond surveys, Qualtrics positions itself as an end-to-end solution for organizations looking to manage the full spectrum of customer, employee, and market insights:
Customer Experience: Key features include Online Reputation Management, Contact Center Analytics, Agent Coaching, and Omnichannel Experience Management.
Employee Experience: Key features include Employee Retention Analytics, Continuous Employee Listening, and 360 Development Feedback.
Strategy & Research: Key features include Brand and Communication Research, User Experience Research, and Edge Audiences.
For companies focused on agile DIY market research, Pollfish’s emphasis on data quality, speed, and usage-based pricing may better align with their needs than Qualtrics’ broader offering.
3. SurveyMonkey
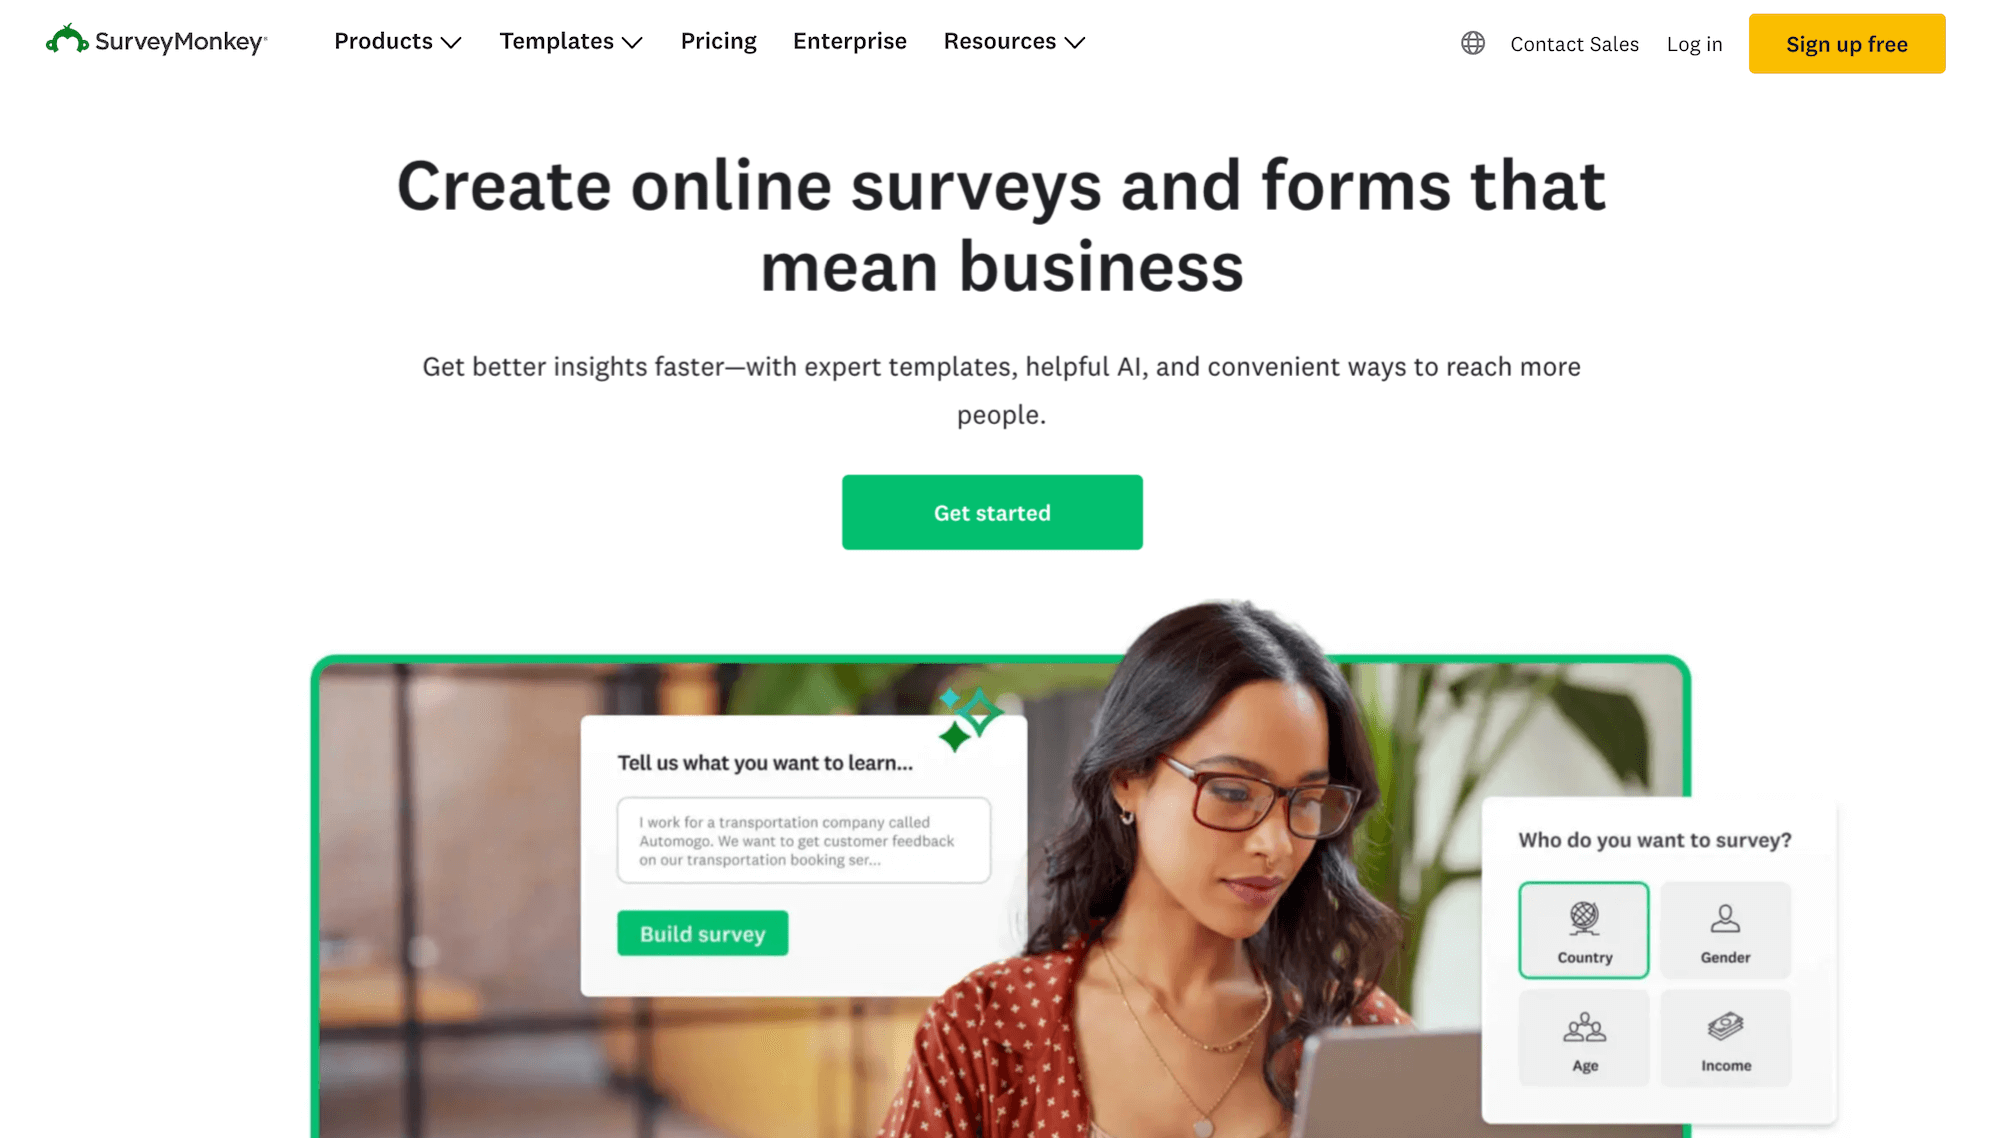
SurveyMonkey’s widespread brand recognition and simplicity make it a popular entry-level tool for basic DIY survey needs. However, companies looking for more robust audience targeting capabilities and stronger data quality controls may find SurveyMonkey's feature set and panel approach lacking compared to Pollfish's offering.
4. Suzy
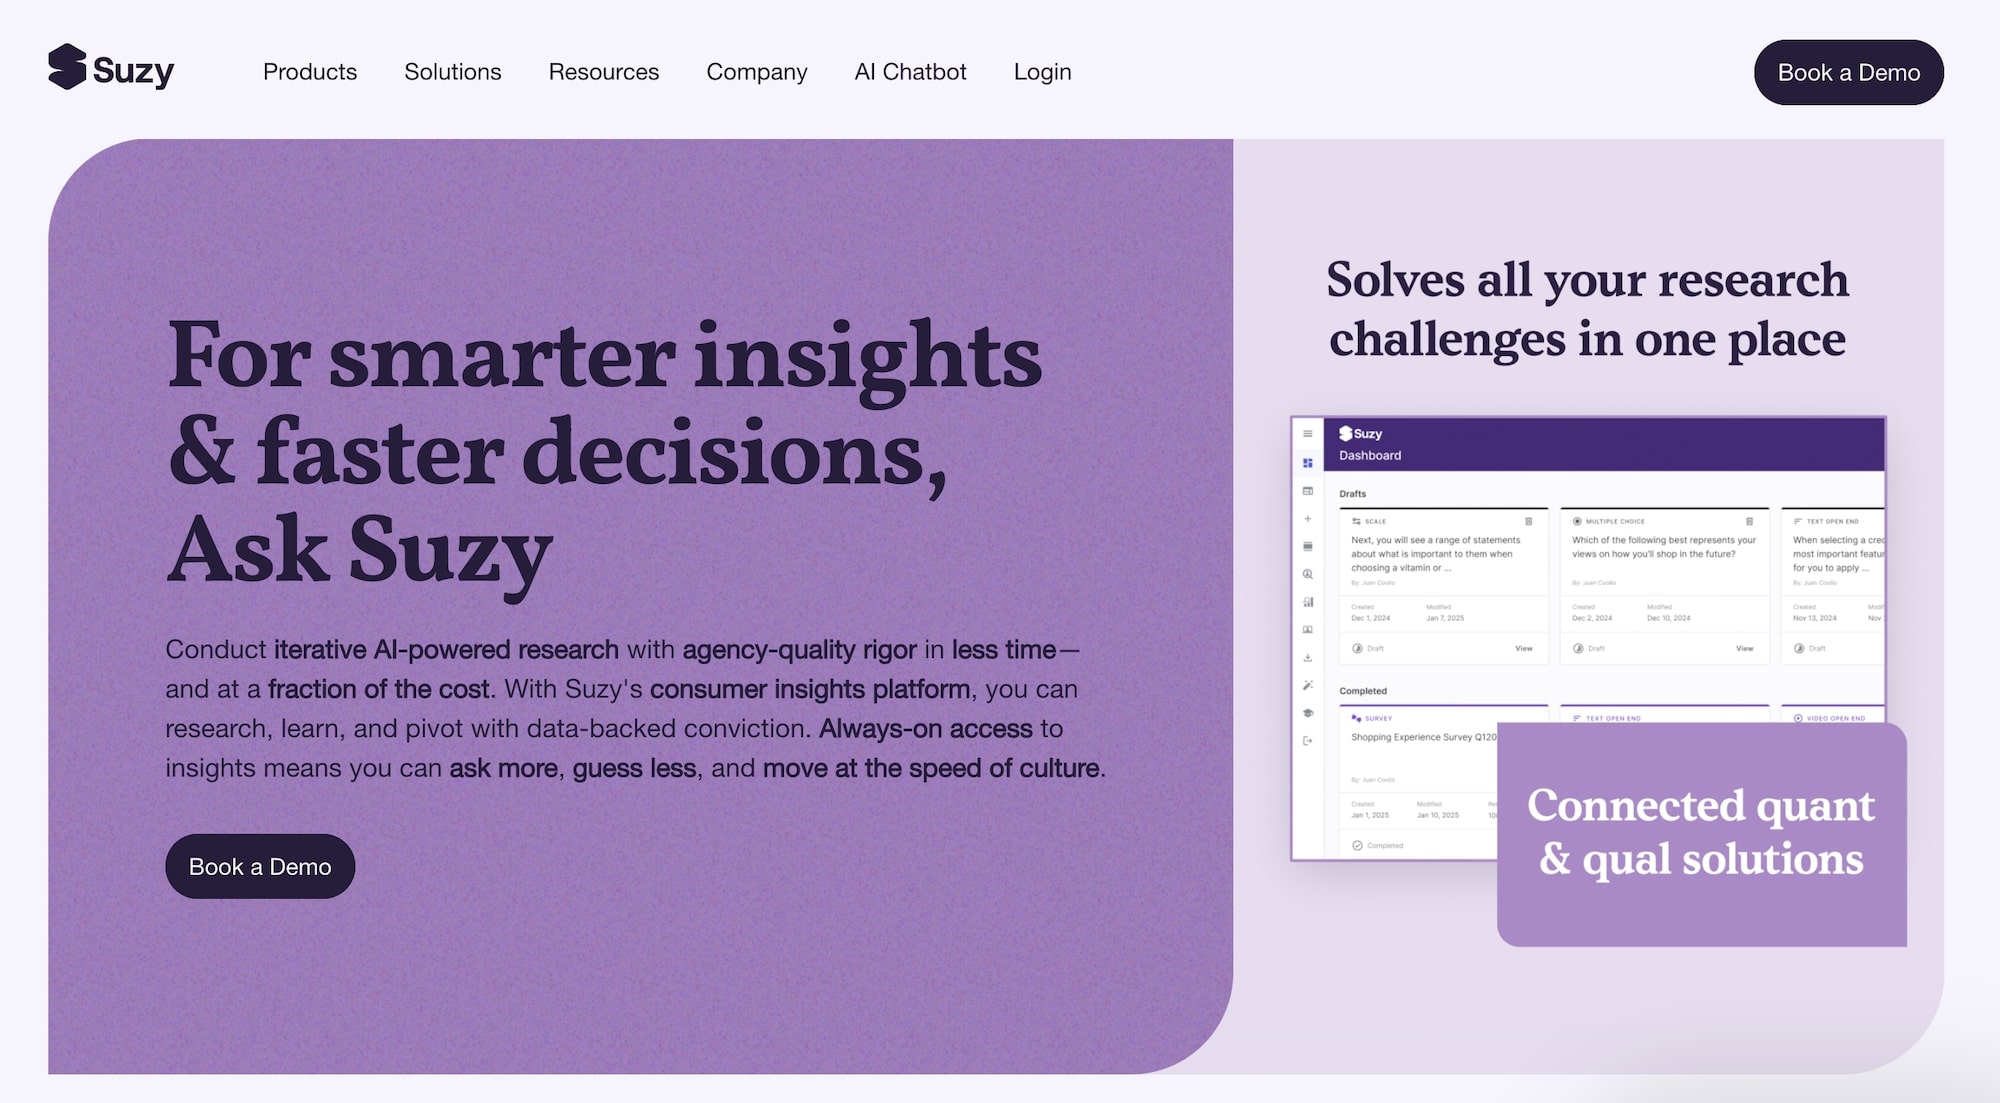
Suzy offers do-it-yourself survey functionality, great for quantitative research.
Beyond this, they have a unique qualitative research offering called “Suzy Live,” which integrates 1-on-1 interviews, focus groups, and in-home product testing into one platform for comprehensive consumer insights. You can read more about it here.
For exact pricing, Suzy requires direct consultation, as plans are tailored to specific research volumes and use cases. Pricing may become costly for larger teams and higher volumes.
5. Google Forms
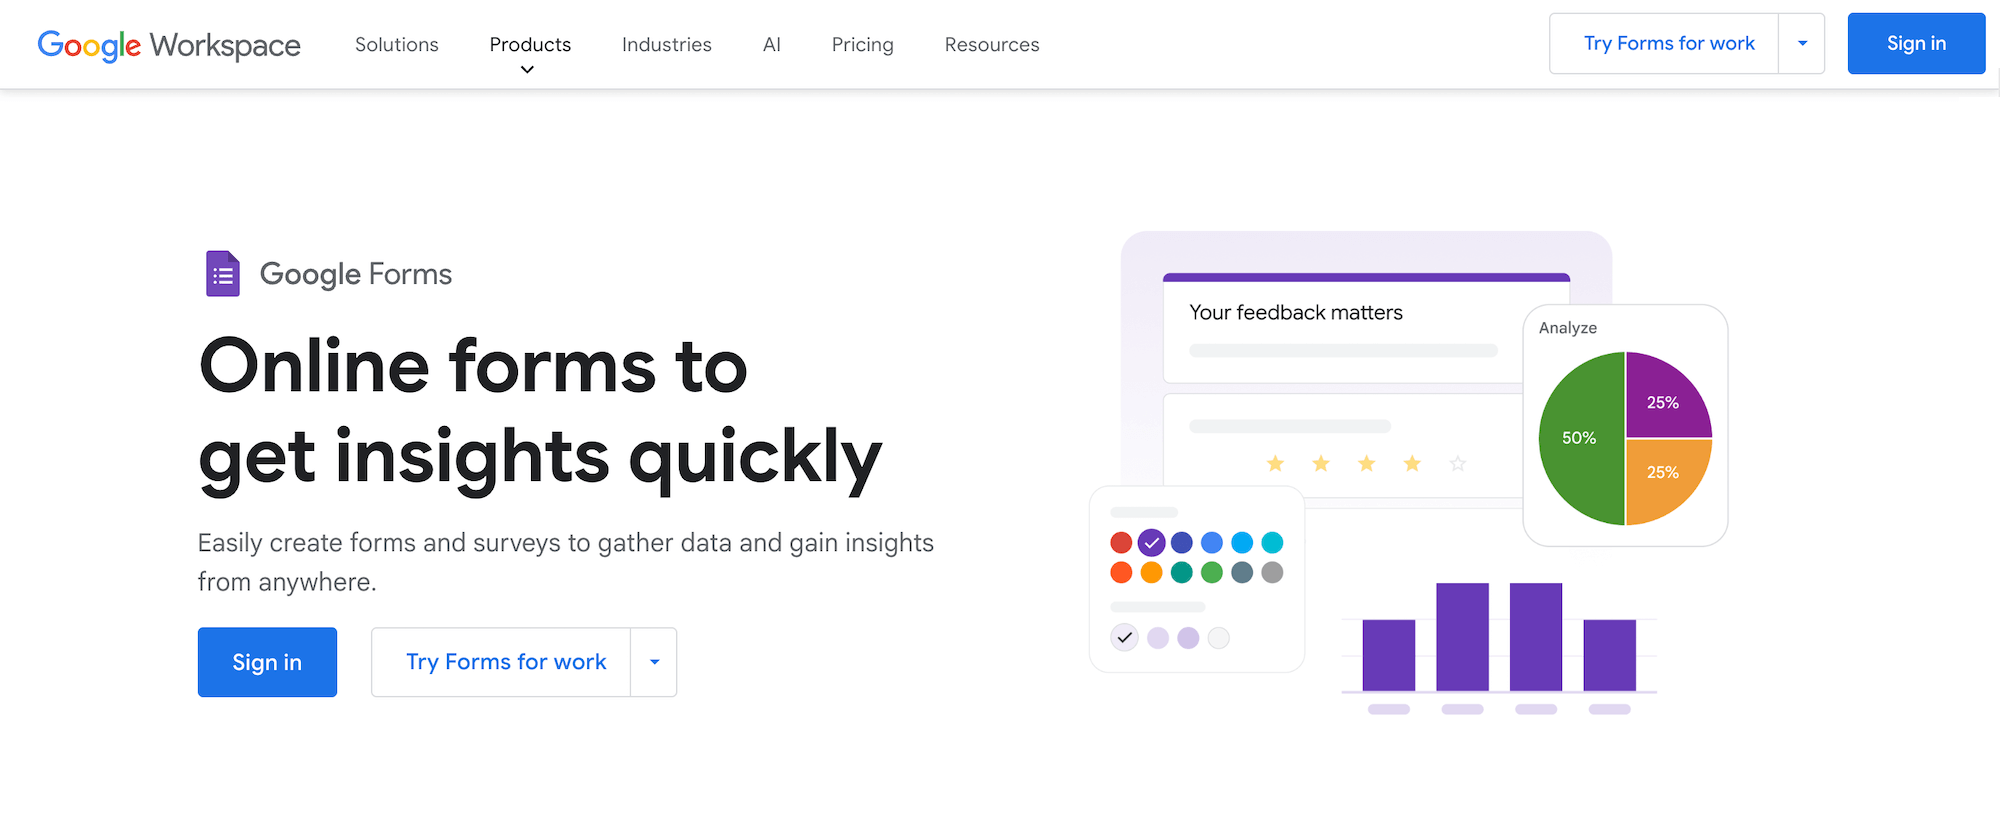
Google Forms is a simple, no-cost option for those who need a quick way to collect data from known contacts, such as their own customers, employees, or mailing lists. Its seamless integration with Google Workspace makes it convenient for collaboration and data analysis within that ecosystem.
While Google Forms doesn't provide audience targeting functionality (you'll need to find respondents yourself), this limitation may be irrelevant depending on your specific needs and existing contact base.
Get Started with Pollfish Today
Sign up for a free account or schedule a one-on-one demo to discover how Pollfish can meet your specific needs and use cases.
Getting Around Pollfish
Whether you're running a quick pulse check or a complex study, the Pollfish Platform is built with smart, intuitive features, designed to help you confidently launch the right survey to the right audience.
Let’s take a tour of the essentials.
🏠 Your Survey Dashboard
It's where all your projects live.
Drafts, under approval, running, and completed surveys
Create a new project or duplicate an old one
Track real-time performance
Download & export your results anytime
📝 Build Your Questionnaire
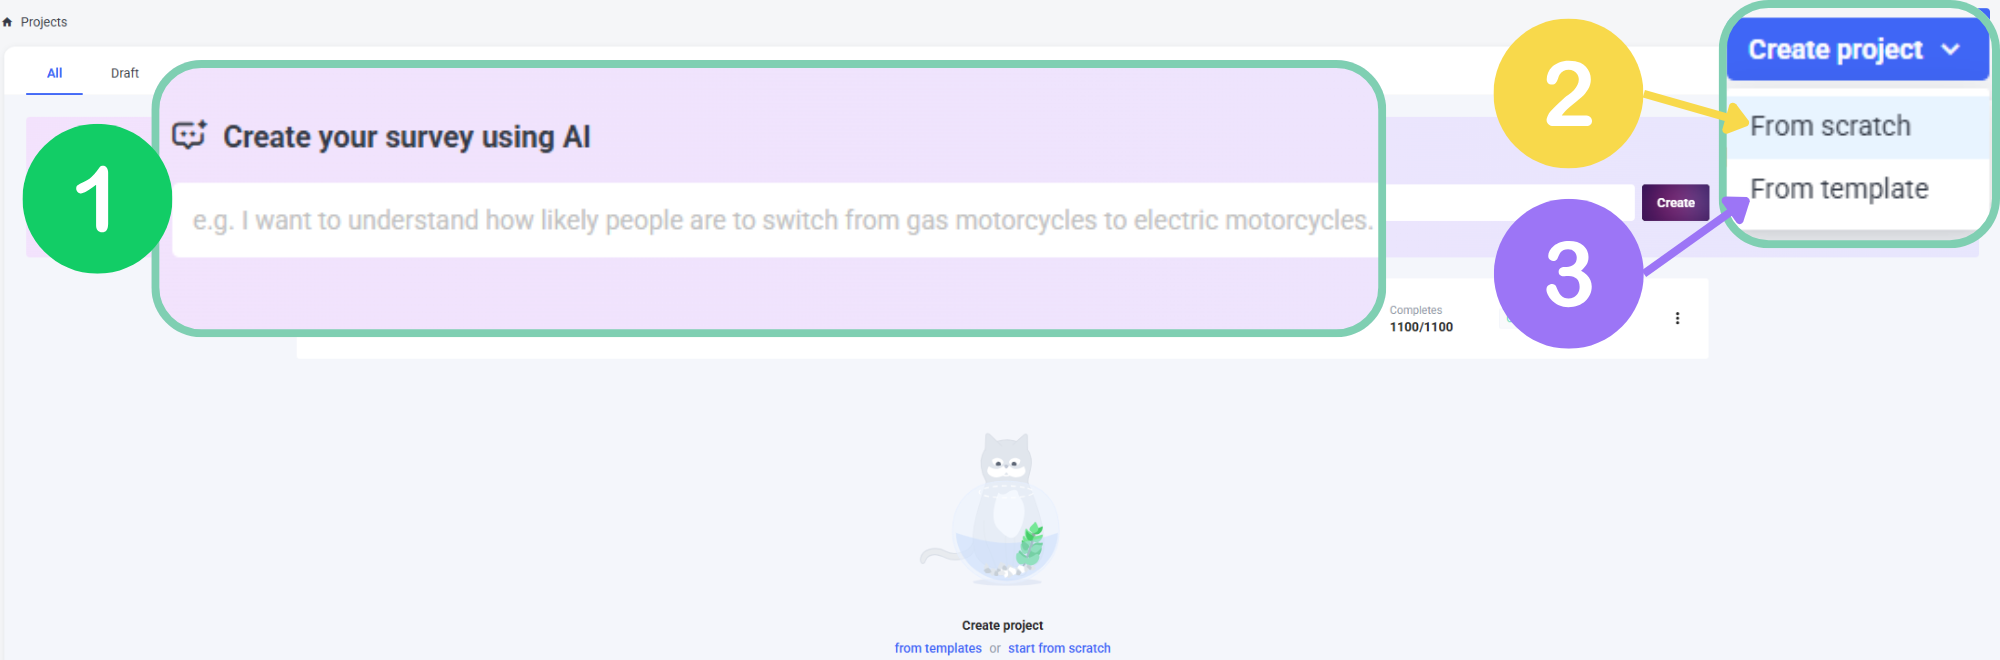
From your survey dashboard, there's 3 ways to build a survey:
With AI: Let our fully conversational research assistant help you craft high-quality surveys with expert precision and minimal effort. Or paste a pre-built survey into the prompt and let us build your survey for you. Then modify, translate, and adjust response options, all with expert guidance.
- From Scratch: Import a pre-built survey, copy/paste questions & answers or add any question type, text, images, logic jumps & more. Everything is fully customizable.
From a Template: Choose from over 20 popular and fully customizable templates to ask the right questions and save time.
🎯 Choose Your Audience
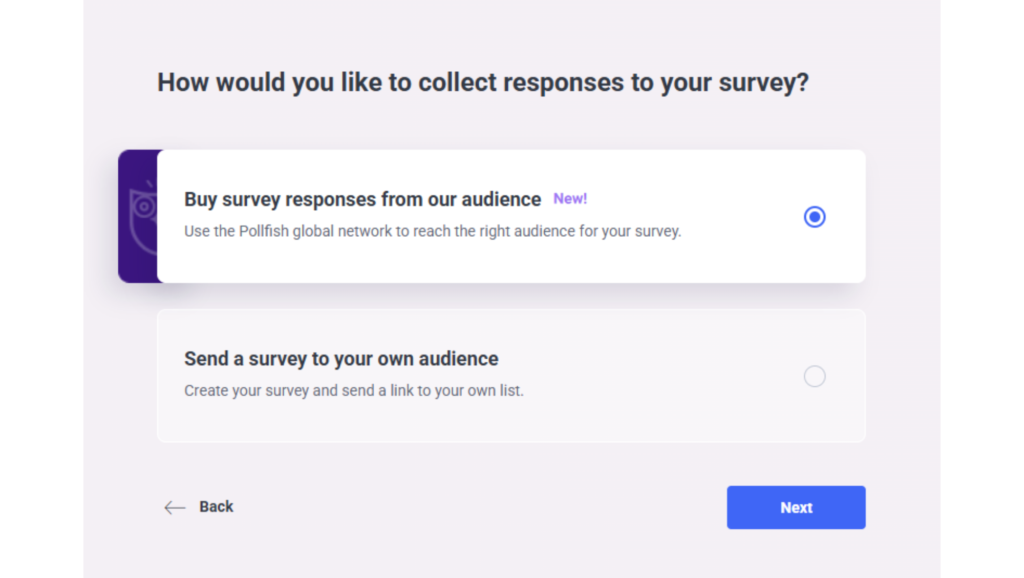
Once you've chosen how you'll build your survey, there's two flexible ways to reach the right people:
Pollfish Audience
Access millions of people with our diverse and extensive audience. Backed by Prodege’s variety of owned and operated loyalty programs.
✓ ISO-certified, ESOMAR Gold Standard Data
✓ 160+ countries
✓ 1000's of filters to contact your target persona. Including demographic, geographic, lifestyle, behavioral data points and more
✓ Cost-effective, transparent, pay-per-complete pricing
Use Your Own Audience
Survey your own database of customers for more specific insights on your brand.
✓ Build your survey and share your survey link - via email, social, or on your website
📚 How audience targeting works →
🔍 Advanced Pollfish Audience Targeting Criteria
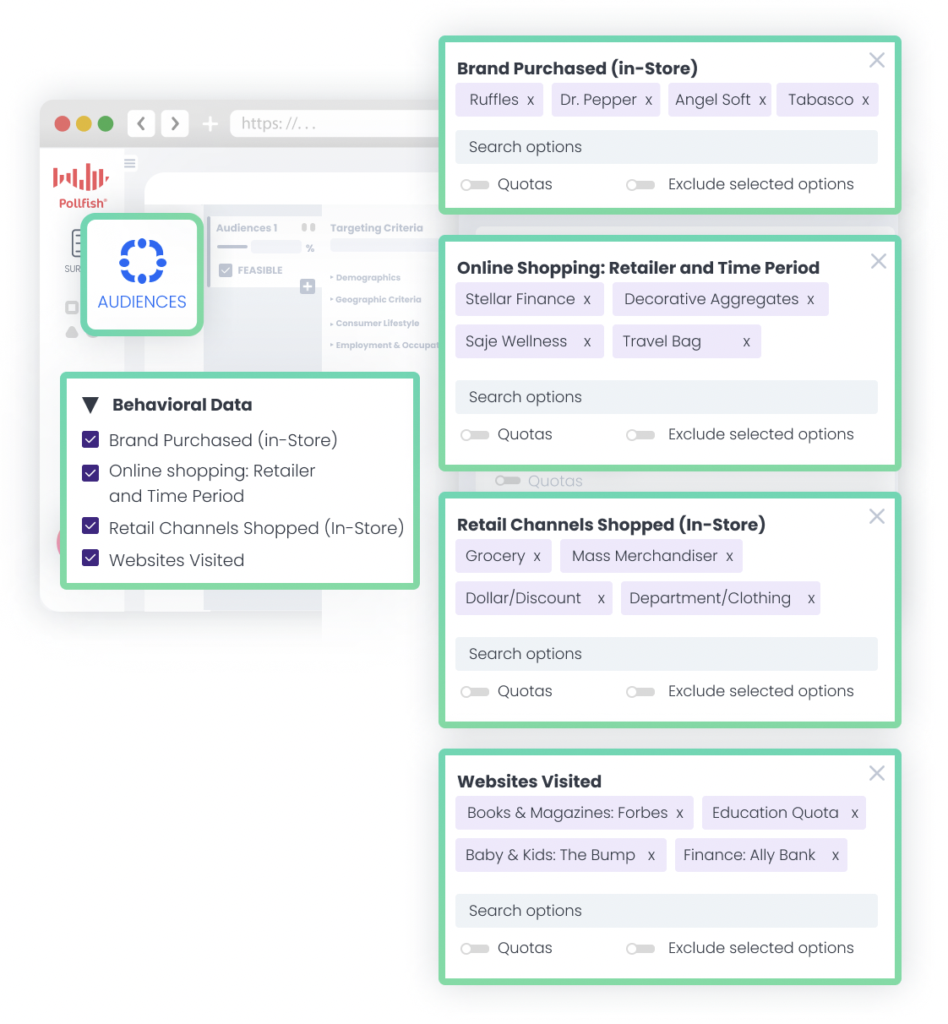
The Pollfish audience gives you precision targeting capabilities:
Demographics: Age, gender, location, income, etc.
Behaviors: 6,979 behavioral criteria to choose from, including verified brand purchases, online shopping, retail channels shopped, websites visited and much more
Screening questions: Include screeners (labelled SQ) with the Add question button. Ask qualifying questions upfront, to avoid responses from people who don't fit your research needs. Save time, money, and keep your insights clean.
💡 Using Pollfish Audience for your project? We'll review your survey before launch to ensure your setup gets the results you need.
Browse all targeting options →
🚀 Launch Your Survey
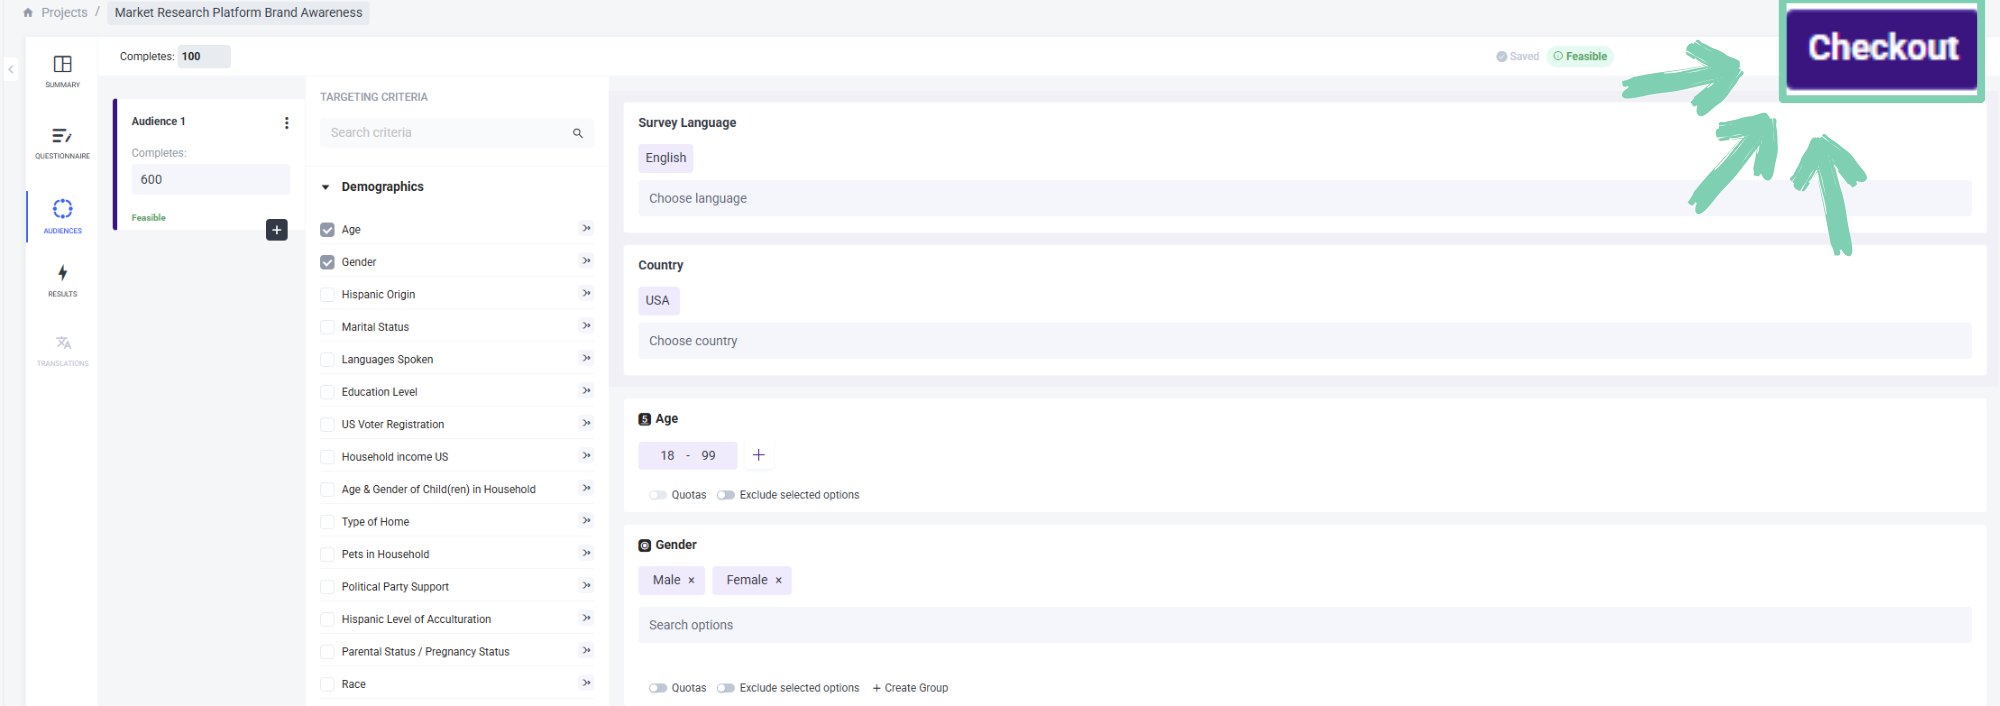
Quick. Reviewed. Real-time results.
Submit your survey for expert review (Pollfish audience only)
Set live once approved
View real time responses in your account - usually within minutes
Analyze insights as they come in
Responses are quality checked
Survey auto-completes and notifies you via email
Transparent pay-per-complete pricing is shown as you create your survey. No hidden fees and no nasty surprises.

 Live Expert Support
Need help? Have questions? Can't find a feature?
Click the chat bubble in the bottom right of your dashboard to get live, expert support 24/7.
Real humans to support your research goals. All day, every day.
🤝 Looking for Managed Services?
Our research experts are here to support you.
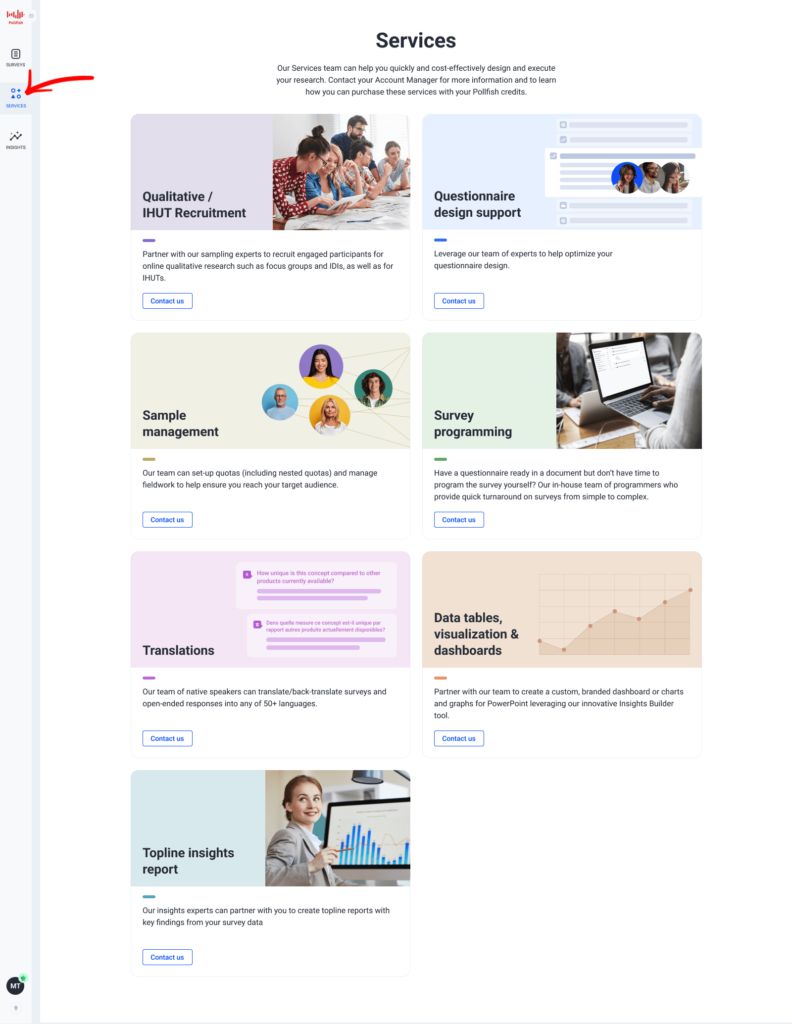
Not sure where to start or simply short on time? Pollfish offers a range of professional services to take your survey from idea to insights. No stress and no guesswork.
How we can help:
Survey Design & QA: Get expert-written questions, logic flows, and formatting
Targeting Strategy: We help you reach the exact audience you need
Full Project Management: Let us handle everything - from setup to launch to analysis
Whether you’re new to survey research or managing complex studies, we’ll tailor the support to your goals.
✅ Ready to Dive In?
Head to your dashboard and start exploring Pollfish.
11 Best Qualtrics Competitors & Alternatives in 2025
11 Best Qualtrics Competitors & Alternatives in 2025

What factors should you look for when considering a Qualtrics alternative? Based on our experience helping companies of all sizes run market research surveys, we’ve identified several key elements:
- Specialized vs. broader focus: Specialized tools that focus solely on surveys tend to be more cost-effective, easier to manage, and simpler to use because they’re designed for a specific purpose. However, if you need various business functions beyond market research, you should choose a platform that provides features beyond surveys. For example, besides surveys, Qualtrics also offers Contact Center Analytics and Quality Management & Compliance tools.
- Data quality safeguards: Most survey platforms buy data from third-party panel providers, often leading to the problem of getting answers from "professional survey takers" — users who prioritize completing as many surveys as possible over providing quality responses. Instead, you should choose a software that leverages first-party data and engages respondents within the apps they already use, resulting in more authentic responses and reliable survey data.
- Turnaround time: Many survey tools have slow turnaround times, taking days to deliver results even for general audiences. The software you choose should have large, engaged respondent communities that can deliver hundreds of mainstream audience responses within hours. You should also receive accurate turnaround estimates for more niche audiences, helping you meet deadlines and get insights faster.
- Survey design flexibility: Many survey platforms have limited functionality, forcing you to compromise on your research goals. For instance, they may lack the targeting criteria needed for your specific audience, or offer only basic question types and logic that don't fully address your unique requirements. Instead, the survey software you choose should provide the flexibility and features needed to execute your research exactly as intended, ensuring you never have to settle for "close enough."
- Pricing structure & transparency: Subscription-based pricing models common among survey platforms often result in paying for unused capacity and unexpected costs for essential features or adding users. Instead, choose a software that offers a pay-as-you-go approach, allowing you to pay only for the responses you need, get unlimited user access, and show your total cost upfront as you build your survey, ensuring budget predictability.
- Market research support team: While most survey platforms offer basic technical support, their reps often lack advanced research methodology knowledge to provide guidance on more complex needs (e.g., questionnaire design, data analysis). The software you choose should have a support team staffed with seasoned market researchers available to offer expertise on these topics and more, ensuring you adhere to industry best practices.
Keep these factors in mind while we compare Qualtrics competitors, starting with an in-depth look at our survey-focused market research software, Pollfish.
11 Best Qualtrics Competitors
- Pollfish
- SurveyMonkey
- Alchemer
- Suzy
- Medallia
- Forsta
- InMoment
- Google Forms
- QuestionPro
- Microsoft Forms
- AskNicely
1. Pollfish
In a nutshell, Pollfish lets you create market research surveys that reach a highly targeted audience using precise targeting filters.
You can choose from various question formats, add screening questions, and apply advanced logic pathways to customize your survey. Survey responses are automatically organized into clear, structured reports for effortless data analysis.
(You can skip to our detailed platform overview here.)
Why choose Pollfish over Qualtrics and other survey platforms?
We'll highlight six key benefits that differentiate Pollfish as a compelling alternative for your market research needs:
- Ensure high data quality for every survey response by leveraging first-party data from our proprietary panel, along with comprehensive fraud prevention measures that include continuous respondent monitoring, a 30-day quarantine for new members, and sophisticated data cleaning techniques.
- Receive faster survey results by leveraging Pollfish's large, highly engaged respondent communities, enabling you to gather responses within hours for general audience surveys.
- Pay only for the responses you need with our flexible pay-as-you-go model, eliminating the need for subscriptions, annual fees, and commitments that may result in unused capacity.
- See complete pricing upfront with our transparent cost structure that shows your total survey cost in real-time as you build your audience, preventing surprise fees and allowing for better budget planning.
- Work with a support team that’s staffed with knowledgeable market researchers, who can help with questions ranging from advanced questionnaire design, logic and routing in surveys, data analysis and interpretation, and anything related to market research best practices.
- Build surveys tailored to your exact specifications using our robust platform capabilities for audience targeting, questionnaire design, and data analysis, ensuring you never have to compromise on your research goals.
Ensure High Data Quality for Every Survey Response
The Problem with Relying on 3rd Party Panel Suppliers
Many survey platforms, including Qualtrics, rely on third-party panel providers to supply respondents rather than owning and managing their survey panels directly. This leads to several issues that can negatively impact data quality:
🚫 "Professional Survey Takers" Problem
Third-party panels typically operate on a direct payment model where individuals specifically sign up to take surveys in exchange for cash rewards. This incentivizes people to sign up for multiple platforms to maximize earnings as "professional survey takers." As a result, they may:
- Provide rushed responses as they prioritize completing surveys quickly instead of giving thoughtful answers.
- Use strategic answering techniques to qualify for more survey opportunities rather than responding honestly.
- Generally contribute lower-quality data that fails to capture genuine consumer opinions accurately.
🚫 Lack of Transparency Regarding Data Sources
Third-party panels rarely disclose their verification methods or respondent sources. This lack of transparency creates uncertainty about data quality, a significant concern given the rise of survey fraud in recent years.
🚫 Multiple Middlemen Add Costs
Each intermediary between you and your respondents adds their markup. You pay more without improving data quality.
The Advantages of Pollfish's First-Party Data Approach
Following Pollfish's acquisition by Prodege (a market research and consumer insights giant renowned for being the largest single panel owner in the world), we leverage first-party data through a fundamentally different approach:
✅ Natural Environment Engagement
We embed surveys within apps people already use for other purposes, such as gaming or utilities. This allows us to reach respondents in their natural environment rather than relying on people who self-select into survey panels. The result is more authentic responses from real consumers, not just "professional survey takers."
✅ Comprehensive Fraud Prevention
Owning our panel gives us full control to implement comprehensive quality safeguards:
- Continuous monitoring of respondent behavior to confirm they are genuine.
- 30-day "quarantine" for new members to complete internal profiling surveys before participating in client surveys.
- Sophisticated data cleaning techniques to identify and remove low-quality responses (e.g., trap questions, speeding prevention, anti-VPN measures, etc.).
✅ Precise Behavioral Targeting
Direct panel ownership lets us gather valuable behavioral data, like purchase receipts, enabling laser-focused targeting based on verified consumer actions rather than self-reported preferences or demographic assumptions.
For example, if a consumer recently purchased premium coffee beans from specialty retailers, you can precisely target them for your high-end coffee machine campaign using verified purchase receipts rather than assumed preferences or demographic generalizations.
✅ Lower Costs with Better Quality
Building and managing our own respondent network in-house eliminates extra fees and markups from third-party panel providers. This direct approach simultaneously reduces costs while significantly increasing data quality for our clients.
Receive Faster Survey Results with Pollfish's Large, Engaged Respondent Communities
A common issue raised by users of other survey platforms is the lengthy wait time for responses. You often have to wait multiple days to get results back, even for general audience surveys.
For a general US audience survey on a broad topic with high incidence (like opinions on streaming service preferences), Pollfish can often gather 500+ responses within hours. This is extremely fast compared to other platforms, made possible due to the large, engaged respondent communities we've cultivated.
More niche, targeted audiences (e.g., pediatric oncologists with over 10 years of clinical experience) will have a longer turnaround time than broad, general population surveys. But Pollfish is still typically faster than competitors even for these niche surveys, and you can reach out to us for exact time estimates.
Pay Only for the Responses You Need Without Subscriptions or Commitments
The Problem with Qualtrics' Subscription Pricing Model
Qualtrics offers a subscription-based pricing structure that may present challenges for some businesses:
🚫 Paying for Unused Capacity
With Qualtrics, you commit to an annual subscription fee regardless of your actual platform usage. For companies with fluctuating research needs, this could result in paying for unused capacity during slower periods.
🚫 Costly Per-User Licenses
Qualtrics charges additional license fees for each team member needing platform access. This gets expensive fast, especially if you have a large team or want to provide organization-wide access.
Pollfish's Usage-Based Pricing Model
Pollfish offers a different pricing approach that’s more flexible to your fluctuating research needs:
✅ Pay Only for What You Use
With Pollfish, you only pay for the survey responses you collect. No annual fees, no subscriptions, no sunk costs. Just a simple pay-as-you-go model for the research you actually conduct.
✅ Unlimited User Access
Pollfish doesn't charge per-user license fees. You can loop in your whole team, or even allow organization-wide access, without worrying about added costs.
See Complete Pricing Upfront with No Surprise Fees
🚫The Problem: Hidden Pricing and Surprise Fees
Many market research platforms use pricing models that can be confusing and lead to unexpected expenses. Here's a common scenario:
- You sign up at what appears to be a fair monthly or yearly price.
- As you begin using the platform, you discover that certain essential features require additional payment.
- You encounter unexpected charges for things like targeting specific demographic segments, adding more users to your account, etc.
- What started as a reasonable budget item ends up being a much larger and unplanned cost.
✅ The Pollfish Advantage: Complete Pricing Transparency
With Pollfish, you always see your total cost updating in real-time as you build your target audience:
For example, let's say you're setting up a survey on consumer preferences:
- You start by choosing a base audience (starting at $0.95 per response)
- You add targeting criteria like "Female respondents only" (+$0.55)
- Include "Married" in the marital status criteria (+$0.55)
You'll immediately see the cost per completed response is $2.05. If you need 600 responses, your total is clearly displayed as $1,230. That's the final price - no unexpected fees later.
This transparent model allows you to plan more reliably and adhere to your research budget without the frustration of surprise costs popping up.
Work with Support Specialists Who Understand Advanced Research Methodology, Not Just Basic Platform Features
The Customer Service Shortcomings of Most Survey Platforms
Customer service is not a priority for most survey platforms in the market. Once customers sign their contracts, they often feel abandoned, with several specific issues that stand out:
🚫 Lack of Advanced Research Expertise
Support reps at most survey companies can only handle basic technical inquiries. They lack deep knowledge about research methodology to help with more advanced needs.
🚫 Slow Response Times
Many survey platforms have frustratingly slow response times. Customers may wait days to hear back about urgent issues, causing critical delays in research projects and missed deadlines.
🚫 Limited Support Hours
Most competitors don't offer support outside standard business hours. If you're working on a survey late at night or on a weekend, you'll likely be unable to receive assistance until regular business hours resume.
How Pollfish Solves These Problems
At Pollfish, we’ve made customer service a central part of our value proposition instead of treating it like an afterthought, unlike most survey platforms. Here’s how:
✅ Support from Knowledgeable Market Researchers
Our support team is staffed with knowledgeable market researchers, not just tech support. We can help you with questions ranging from advanced questionnaire design, logic and routing in surveys, data analysis and interpretation, and anything related to market research best practices.
✅ Rapid Response Time
Connect with our team via live chat in minutes, not days, which can help you maintain research momentum and meet tight deadlines.
✅ 24/7 Availability
Pollfish offers genuine 24/7 customer support, unlike most competitors. This round-the-clock availability ensures you can get help whenever you need it, regardless of time zone or day of the week.
Build Research Projects Exactly to Your Specifications Without Compromise
With surveys, oftentimes there will be very specific, unique requirements for your particular use case. It's crucial to ensure that your chosen software has robust functionality to fully address your precise research needs. You shouldn’t have to compromise on your research goals due to limitations of the survey platform.
Let’s consider the following examples of common limitations:
- You need to target a particular audience segment, but the platform doesn’t offer the necessary targeting criteria. You’re forced to settle for a broader audience that doesn't fully match your ideal respondent profile.
- You want to include certain question types and logic in your survey design, but the platform's options are too basic.
- You have to export the raw data and utilize external tools to truly make sense of the results because the platform only provides rudimentary reporting and analytics.
To illustrate how Pollfish provides the flexibility and functionality to avoid these types of limitations, we'll briefly cover its capabilities in 3 key areas:
- Setting your survey audience
- Designing your questionnaire
- Analyzing results via user-friendly reports
For a more comprehensive look at these areas and an overview of the entire Pollfish platform, refer to this in-depth article on getting started with Pollfish surveys. It walks through each step of the process, from survey creation to data analysis, and more.
Note: While most customers use Pollfish as a DIY (do-it-yourself) tool to build their own surveys, we also offer a full-service option where market research professionals manage your entire project from start to finish.
Set Your Survey Audience
Choose from over 50 targeting criteria across six categories:
- Demographics
- Geographic Criteria
- Consumer Lifestyle
- Employment & Occupation
- Behavioral Data
- Media.
You can keep your targeting broad by focusing on just a few key criteria, such as age and gender. However, our platform also allows you to be incredibly specific in your targeting. For example, you could target women who meet all of the following criteria:
- Aged 25–34
- Living in the Pacific Northwest
- With a bachelor's degree or higher
- Owns dogs
- Enjoys hiking and camping
- Subscribes to Netflix and Disney+
- Have visited travel websites in the past month
- Earns between $75,000 and $100,000 per year
- Works in healthcare
- Frequently shops at Target and Amazon
Most users won’t need to be this precise in their targeting criteria. Our goal is simply to illustrate the depth of customization available to you if your survey requires it.
This is just a brief overview. For more information on setting your survey audience, view this video.
Design Your Questionnaire
Design surveys using Pollfish's 14 diverse question types, from simple multiple selection to complex matrix formats and more. Then, enhance your survey quality through advanced features like skip logic for personalized respondent pathways, screening questions, answer randomization, multimedia integration, AI survey creation, and pre-built survey templates for common market research use cases.
This is just a brief overview. See this page for more information on designing your questionnaire.
Analyze Results via User-Friendly Reports
Pollfish lets you visualize each survey answer with appropriate chart formats (simple tables, color-coded column charts, or intuitive pie charts) in an easy-to-navigate dashboard.
The platform also enables powerful data filtering by specific demographics or responses, such as only viewing results from female millennials in urban areas, or isolating feedback from respondents who indicated they "strongly disagree" with your product pricing.
The Insights Builder tool (available on the Elite plan) takes analysis further by enabling sophisticated data manipulation without Excel. You can create complex graphs comparing multiple variables at once, apply statistical testing to identify significant findings (like which features truly drive customer satisfaction), and customize visualizations with your brand's specific color palette.
When you're ready to share results, export options include PDF, Excel, Crosstabs, and SPSS formats, with the ability to seamlessly transfer graphs to PowerPoint presentations using your company's templates and branding elements.
This is just a brief overview. Click here for an interactive demo of our Survey Results Dashboard.
Learn More About Pollfish
For more information on Pollfish, we invite you to:
- Create a free account (no payment information required).
- Book a personalized demo to see how Pollfish works for your specific needs.
2. SurveyMonkey
SurveyMonkey is a market research platform that can help you:
- Create surveys (e.g., drag and drop survey builder, customizable templates, advanced survey design features)
- Create and customize online forms for events, applications, payments, etc.
- Analyze results via custom dashboards, charts, word clouds, and other analysis tools
- Export your data to 200+ popular apps like Mailchimp, Google Sheets, Microsoft Teams, and more
3. Alchemer
Alchemer is a survey and data collection platform that boasts several features and capabilities, which include:
- A plethora of different survey question types and advanced survey design features like logic and branching
- Real-time feedback and actionable insights from customers as they use your app or website
- Customer text sentiment analysis
- Integrations with platforms like Salesforce, HubSpot, Zendesk, Asana, Zapier, Microsoft Teams, etc.
4. Suzy
Suzy is a Qualtrics alternative and consumer insights platform that can help you:
- Conduct surveys with real-time feedback from targeted audiences
- Utilize templates, AI, and more for survey creation
- Connect with audiences through email, CRM, and social media integration
- Analyze consumer feedback with dynamic AI-powered analytics and customizable reporting
5. Medallia
Medallia is an all-around experience management software that can help you:
- Conduct agile research via surveys, online focus groups, and panel studies
- Increase contact center efficiency via conversation intelligence, agent coaching, quality management, and assurance optimization
- Improve employee experience via employee listening and activation solutions
- Implement comprehensive customer experience management programs across multiple touchpoints
6. Forsta
Forsta is another one of the best Qualtrics alternatives that can help:
- Conduct research via online surveys and focus groups
- Analyze what people say about your brand on Google, Facebook, Yelp, and more
- Receive input from customers via activity-based diary entries
- Measure and improve user experience through comprehensive journey mapping
- Centralize and analyze data from multiple sources in a single hub that connects feedback with behavioral and observed data
7. InMoment
InMoment is another Qualtrics competitor that lets you:
- Capture customer feedback across multiple channels
- Monitor, analyze, and respond to online reviews across popular platforms
- Automate the analysis of contact center conversations, chat logs, and emails to uncover customer sentiment
- Place microsurveys and interaction tracking to help you optimize customer journeys
- Analyze structured and unstructured data to detect customer intentions automatically, predict behavior, etc.
8. Google Forms
Google Forms is a free tool that can help you:
- Easily create forms via drag and drop functionality with a minimal learning curve
- Share forms via email and social media, or embed them on your site
- Customize forms using templates, flows, and quizzes, with colors that align with your company's branding
- Easily visualize responses and optionally export to Google Sheets
9. QuestionPro
QuestionPro is a Qualtrics alternative that can help you:
- Easily create surveys via drag and drop functionality, with various question types and templates
- Utilize sophisticated methodologies like conjoint analysis, MaxDiff, A/B testing, etc.
- Map the entire customer journey and collect feedback at various touchpoints
- Gather feedback throughout the employee lifecycle
10. Microsoft Forms
Microsoft Forms offers a free plan and lets you:
- Easily create simple surveys, quizzes, and polls on customizable forms without extensive technical knowledge
- Visualize response data via automatically generated reports
- Export to Excel for more customized, in-depth analysis
- Integrate with other Microsoft 365 apps
11. AskNicely
AskNicely is a customer experience software that lets you:
- Gather customer feedback through email, SMS, and embedded surveys at key touchpoints
- Run NPS and CSAT measurement programs with intuitive dashboards
- Turn happy customers into brand advocates by streamlining the review request process to generate more 5-star ratings and referrals
- Connect seamlessly with platforms like Salesforce, Microsoft Teams, Zendesk, etc. to embed feedback collection into existing workflows
Get Started with Pollfish Today
Create a free account (no payment info required) or book a personalized demo to discover how Pollfish can meet your needs.
11 Best Survey Software for Market Research in 2025
11 Best Survey Software for Market Research in 2025
When selecting the best survey software for your market research needs, these essential factors deserve careful consideration:
- Data quality: Beware of survey tools that buy respondents from third-party vendors, because this introduces significant quality control issues that compromise your research data integrity (more on this later). Instead, choose platforms that own and manage their respondent communities directly for fundamentally more accurate research results.
- Flexible survey design capabilities: Your research needs are specific and unique — never settle for "close enough" when designing your surveys, as even minor compromises can significantly distort your findings. Without precise audience targeting, you risk collecting data from irrelevant respondents who don't represent your population of interest, while platforms with limited questionnaire design tools force compromises in question structure and logic flows that yield unreliable responses, and inadequate data analysis capabilities leave critical insights buried in your survey data.
- Pricing structure & transparency: Consider the advantages of flexible pay-per-response models against expensive monthly or yearly subscriptions that might include capacity you won't use. Pay attention to the importance of upfront pricing transparency and avoid platforms with hidden fees that appear only after you've committed.
We’ll start by discussing how Pollfish (our own product) performs in these areas, and categorize the tools in this list into two groups: premium tools with advanced functionality and entry-level options.
Best Survey Software for Market Research
Premium Tools with Advanced Functionality
1. Pollfish
Here's a brief overview of what we'll discuss in this section:
How Pollfish leverages proprietary respondent communities instead of external third-party panels
- Competitor limitations: Rather than maintaining their own respondent communities, most survey platforms acquire survey participants from external 3rd-party panel providers. This creates serious data quality concerns through "professional survey takers," response manipulation, and a growing survey fraud epidemic.
- Pollfish’s approach: Pollfish takes a fundamentally different approach by owning and nurturing our respondent communities directly, implementing rigorous verification and anti-fraud processes, providing precise behavioral targeting based on verified actions (not just self-reported preferences), and more.
3 key feature categories that influence research quality
- Audience targeting: You may require reaching a highly specific audience segment, but find yourself constrained by limited targeting options, ultimately settling for a broader respondent group that only partially matches your target demographic.
- Questionnaire design: When crafting your survey, you might envision dynamic question formats or sophisticated branching logic, only to find the platform's survey building capabilities don't support these advanced requirements.
- Data analysis: It's disappointing when a platform provides only basic analytical tools, forcing you to export raw data and rely on external applications (like Excel) to perform the in-depth analysis essential for actionable insights.
Transparent pay-per-response pricing model (rather than being locked into a subscription)
- Competitor limitations: Many survey software charge expensive monthly or annual subscription fees that lock you into paying for capacity you may not fully utilize. Others have confusing pricing with hidden costs that only become apparent after you've committed.
- Pollfish’s approach: We offer transparent, pay-as-you-go pricing that allows you to pay only for the responses you need, with no surprise fees.
Let's explore each of these areas in more detail.
While Competitors Rely on External Third Party Panels, Pollfish Leverages Proprietary Respondent Communities
Most survey platforms don't maintain their own respondent communities. Instead, they acquire survey participants from external 3rd-party panel providers, which often employ a cash-for-completion model where participants specifically enroll to earn money through surveys.
This leads to what we call “professional survey takers”, who participate in dozens of surveys weekly across multiple platforms primarily as an income source. These respondents are motivated by speed and quantity (not thoughtful participation), and they provide answers that will qualify them for surveys, regardless of truth.
In addition, many 3rd-party panel providers operate as "black boxes," concealing their methods for combating survey fraud. This lack of transparency is concerning because survey fraud isn't just a minor data quality issue — it's a pervasive threat that can completely undermine the validity of your market research. There are now organized networks using AI-powered tools, device farms, and identity spoofing to generate convincingly human-like responses. (The survey fraud ecosystem has grown increasingly sophisticated).
When your survey results come from “professional survey takers” or fraudulent respondents, you're building business strategies on fundamentally misleading information. Imagine investing six months and significant resources developing a new product line because survey results showed strong demand, only to launch it and discover actual customers have little interest. This disconnect between research findings and market reality doesn't just waste resources — it affects your credibility with stakeholders and deflates team morale.
At Pollfish, We Have a Fundamentally Different Approach
Unlike competitors who rely on third-party panels, Pollfish (through parent company Prodege) owns and operates an extensive network of consumer communities.
This end-to-end ownership of the respondent ecosystem enables Pollfish to implement multi-layered quality controls, sophisticated targeting, and seamless in-app engagement, delivering higher quality survey responses that competitors using 3rd-party panels cannot match.
The key data quality advantages of Pollfish's owned respondent ecosystem include:
✅ Incentives through natural environmental engagement
Surveys are seamlessly integrated into apps that people already use and enjoy in their daily lives for purposes like gaming, shopping, or entertainment. Respondents can earn in-app rewards or incentives for completing surveys, such as bonus lives in a game or discounts on purchases.
By engaging users during their regular in-app activities instead of in dedicated survey environments (where respondents might be mindlessly clicking through their 20th consecutive questionnaire), Pollfish captures more genuine, thoughtful responses that better reflect people's true opinions and preferences.
✅ Authenticated purchase history via digital receipt uploads
Pollfish's ecosystem rewards respondents not just for taking surveys but also for uploading actual shopping receipts to earn cashback. This verification process serves two vital purposes:
- First, it confirms that respondents are genuine humans, not bots or fraudulent accounts.
- Second, when building your survey audience in Pollfish, you can precisely target respondents based on their documented purchase history — for example, specifically reaching people who have bought Cheerios in the last month, purchased Nike products, or shopped at Walmart. This behavioral targeting is based on proven actions verified through receipt uploads, not just what respondents claim about themselves, significantly increasing the reliability of your audience selection.
✅ Sophisticated respondent verification system
Every participant in Pollfish's ecosystem undergoes a comprehensive validation process that starts before they ever see a client survey:
- Mandatory 30-day evaluation period: New members are exempt from participating in client surveys during their first month. During this period, they can only complete internal profiling surveys that help Pollfish establish their baseline response patterns and verify the consistency of their demographic information. This allows Pollfish to identify potentially problematic respondents before they ever reach client surveys.
- Cross-platform behavior analysis: Because members engage with Pollfish's communities across various activities, Pollfish can verify consistency in behavior patterns. For example, if someone reports being a pet owner in surveys but their shopping history (as verified by receipt uploads) reveals no pet food, toy, or supply purchases that would typically be associated with pet ownership, Pollfish can flag this discrepancy for review.
✅ Comprehensive fraud prevention at every step
While traditional 3rd-party panels typically apply basic quality checks after surveys are completed, Pollfish employs more sophisticated fraud prevention methods:
- Unique User ID: Each participant receives a unique identifier that tracks their activity across our platform, preventing individuals from taking the same survey multiple times or creating duplicate accounts.
- Device-Carrier Validation: Our system cross-references the respondent's mobile carrier information with their device data to verify consistency and flag suspicious patterns that might indicate location or identity spoofing.
- Sophisticated Trap Questions: We strategically place specialized validation questions that appear simple to humans but confound automated systems. These include not just image recognition tasks, but attention verification questions that adapt based on previous responses to appear natural within the survey flow.
- Response Timing Analysis: We can detect and flag not just speeders who rush through the entire survey, but also identify suspicious patterns like inconsistent timing (fast on complex questions, slow on simple ones).
- Geolocation Authentication: We employ advanced IP validation technology that blocks responses submitted through VPNs, proxies, and other location-masking services to ensure geographic targeting accuracy.
- Progressive Trust Evaluation: Respondents receive continuously updated quality scores based on their historical response patterns.
3 Key Feature Categories That Influence Research Quality
Now that we've established the critical importance of data quality — since even the most sophisticated survey tools offer little value if they're built on flawed data — let's look at what our market research survey software can actually do.
As we’ve mentioned earlier, there are 3 essential feature categories that truly effective survey platforms must deliver to meet your precise research requirements:
- Audience targeting: You might need to reach a precisely defined audience segment, yet find yourself limited by insufficient targeting parameters, ultimately forcing you to compromise with a broader respondent pool that only partially aligns with your intended demographic.
- Questionnaire design: When developing your questionnaire, you may envision specific interactive question formats or complex conditional logic paths, only to discover the platform's survey construction tools lack these advanced features.
- Data analysis: It's frustrating when the platform's analytics capabilities offer only surface-level insights, compelling you to download your raw response data and use third-party software (e.g., Excel) just to conduct the deeper analysis necessary for meaningful decision-making.
Up next, we'll examine how Pollfish addresses each of these critical feature areas.
Define your respondent pool using granular demographic and behavioral filters
Pollfish offers an extensive range of targeting criteria to precisely define your survey's audience:
- Targeting criteria options: Choose among 50+ targeting parameters spread across 6 key categories: Demographics, Geographic Criteria, Consumer Lifestyle, Employment & Occupation, Behavioral Data, and Media.
- Example in action: Most companies won't set all of the parameters below simultaneously, but here's an example of how detailed your targeting could be:
- Demographics: Men, ages 35-49, $200,000+ income, single, never married
- Geography: Metropolitan areas across the Midwest
- Consumer Lifestyle: Regular energy drink consumers, enthusiasts of extreme sports, fishing, and camping
- Employment: Employed full-time, work in the construction industry
- Purchase Behavior: Recently bought Gatorade and 5-hour energy products
- Set audience quotas: Optionally, you can set audience quotas to ensure a balanced sample and avoid skewed results (e.g., For example, you might set survey audience quotas to ensure 30% of respondents are males aged 18-24, 40% are females aged 25-34 with children, and 30% are adults aged 55+ with household incomes above $75,000 to achieve a representative sample across key demographic segments).
Note: To learn more about Pollfish’s audience targeting capabilities, view this video.
Build questionnaires with diverse question types and advanced survey design features
Craft engaging surveys using a wide variety of question formats and advanced survey design capabilities:
- Choose from 14 question types, including single/multiple selection, open-ended, matrix, rating stars, sliders, and more. (See complete list and explanation for each question type.)
- Specialized question formats like A/B Test, Conjoint Analysis, Max Diff, and ProVan Westendorp for specific research needs.
- Screening questions: Use screening questions to ensure only relevant participants complete your survey. (e.g., Include a screening question like "Do you currently have a pet in your household?" to qualify participants for a pet food market research study).
- Skip logic: Implement skip logic and advanced branching to create personalized paths based on response. (e.g., In a healthcare survey, if a participant selects they take prescription medication, they follow a branching path with questions about medication frequency, whereas those without prescriptions are routed to questions about preventative care).
- Answer shuffling: Randomize answer order to reduce bias and improve data quality (e.g., implement answer shuffling for the question "Which factor most influences your purchasing decision?" to prevent primacy bias from skewing results toward options listed first).
- “Other” and “None of the above”: Automatically include "Other" and "None of the above" for all answer choices with a simple toggle, rather than doing it manually for each question (a common frustration for researchers who regularly create surveys).
- Multimedia elements: Incorporate multimedia elements like videos into survey questions, and optionally require video viewing completion before advancing to ensure attentiveness.
- And the list goes on, including popular survey templates for market research, an AI survey builder, and more.
Click here to learn more about designing a questionnaire with Pollfish, and the customization options at your disposal.
Leverage built-in reporting capabilities for easy data visualization and analysis
Pollfish's user-friendly reporting tools allow you to easily uncover meaningful insights from your survey data, all within our platform, without having to use Excel.
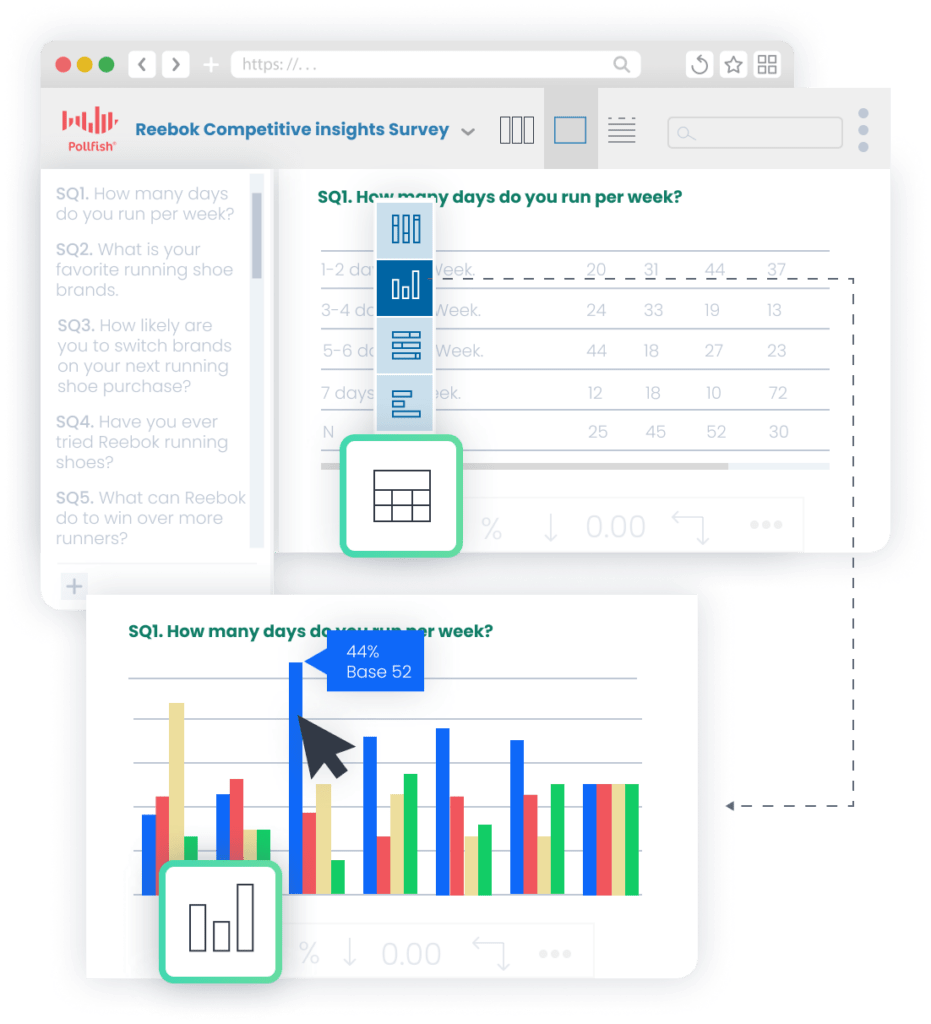
- Intuitive data visualization: Visualize every single survey answer using tables, color-coded charts, and graphs that automatically update based on filters.
- Customizable Styling: Customize graph colors and styling to align with your brand guidelines. For instance, if your company uses a specific blue (#0057B8) and orange (#FF6B00) color scheme in all marketing materials, you can easily apply these exact brand colors to your survey result visualizations.
- Flexible Data Exporting: Export results in various formats (PDF, Excel, Crosstabs, SPSS) for further analysis and presentation.
- Drill down by key audience segments:Apply audience targeting filters to analyze survey results by specific audience segments such as age, gender, location, and more.
- Example use case: Using the demographic filters on the left side of the dashboard, you could select just "Millennials (25-40)" to see their specific feedback. The results would instantly update to show only responses from this age group, revealing that millennials were twice as likely to say your proposed pricing was "very reasonable" compared to the overall sample. You could then further refine this by adding gender filters to compare male vs. female millennials' price sensitivity, discovering that female millennials were particularly enthusiastic about your pricing proposition.
- Drill down by specific responses: Utilize response-based filtering to drill down into data by individual question answers.
- Example use case: When reviewing your customer satisfaction survey results in Pollfish, you could use response-based filtering to focus on only the respondents who selected "Very Dissatisfied" to your overall satisfaction question. This would allow you to examine what these dissatisfied customers specifically disliked by seeing their responses to other questions, such as product quality, customer service interactions, or pricing concerns. You could discover that 78% of dissatisfied customers cited "slow response times" as their primary frustration, giving you a clear priority for improvement efforts.
- Advanced analysis without Excel: Our Advanced Insights Builder (available on Elite plan) enables complex data manipulation using multiple variables without needing Excel.
- Example use case: You could instantly analyze 4 variables simultaneously by creating a visualization showing how purchase intent (variable 1) for your product varies across different age groups (variable 2), income levels (variable 3), and geographic regions (variable 4). This might reveal that high-income millennials in urban areas show 87% purchase intent compared to just 43% among similar demographics in rural regions — a complex, multi-dimensional insight that would typically require extensive Excel manipulation but is available with just a few clicks on our platform.
- Built-in stat testing: Stat testing results can be clearly visualized using color-coding and traditional notation (capital and lowercase letters).
- Example use case: If you compared customer satisfaction scores across different age groups, our platform would automatically highlight statistically significant differences - showing that Gen Z customers (highlighted in dark green with capital "A" notation) rate your mobile app experience significantly higher than Baby Boomers (marked with lowercase "b").
Note: This is just a glimpse of what's possible. If you have particular reporting requirements and want to confirm that Pollfish can meet them, please contact us here.
Transparent Pay-per-Response Pricing Model (Rather Than Being Locked Into a Subscription)
Up next, we’ll examine how our usage-based pricing structure delivers exceptional value compared to alternatives.
The Downsides of Subscription-Based Pricing
- Many competitors offer inflexible subscription models that require you to commit to monthly or annual fees, regardless of your actual usage. This means that during slower periods or months when no research is conducted, you still pay the full subscription rate — essentially wasting money on unused capacity.
- Additionally, tiered pricing structures can be misleading. While some tools may advertise an attractive base rate, essential features often remain locked until you upgrade, leading to unexpected costs for targeting specific demographics, accessing comprehensive reporting tools, and more.
- Furthermore, as your team grows, paying for each additional user can significantly increase your total costs. This also creates budget unpredictability, especially when scaling teams for short-term projects or seasonal demands.
Pollfish’s Approach: Transparent, Usage-Based Pricing
- You only pay for the survey responses you collect, starting at $0.95 per response. Our straightforward cost structure scales with your actual usage, and we can apply significant volume discounts for larger research initiatives.
- You see your total cost calculated in real-time through our dynamic pricing display. As you build your survey specifications, the platform immediately shows both the per-response rate and your total complete project cost before you commit, eliminating budget surprises.
- You can add unlimited team members at no additional cost. If you're on the market research team, you can include everyone from your immediate department, plus collaborate seamlessly with stakeholders from marketing, product development, customer experience, and executive leadership without worrying about per-user fees.
Register for a Free Pollfish Account
Ready to experience Pollfish firsthand? We invite you to register for a free account (no credit card needed, no obligations) and book a demo walkthrough.
2. Qualtrics
Qualtrics is a survey software for market research that can help you:
- Create customizable surveys with advanced question types and logic.
- Combine quantitative and qualitative research methods including video feedback and interviews.
- Optionally distribute surveys through multiple channels including email, SMS, QR codes, website embeds, and more.
- Store and search all research insights using AI-powered search capabilities.
- Visualize insights through real-time analytics dashboards.
For more information on what differentiates Pollfish from Qualtrics and other competitors, visit this article.
3. Suzy
Suzy is a survey tool for market research that with several features and capabilities, some of which include:
- Custom surveys with both basic and advanced question types.
- Logic branching for personalized respondent experiences.
- Video-based qualitative research capabilities through Suzy Live.
- Retargeting of certain respondent groups for follow-up studies.
- AI-moderated conversations for conversational surveys at scale.
To learn more about what differentiates Pollfish from Suzy, visit our article on the best Suzy alternatives.
4. SurveyMonkey
SurveyMonkey is a survey platform for market research with several features and capabilities, some of which include:
- AI-powered SurveyMonkey Genius to guide survey creation and analysis.
- Extensive library of expert-built templates and pre-written questions.
- Sentiment analysis to categorize open-ended responses automatically.
- Offline response collection through the SurveyMonkey Anywhere app.
- Integration with a plethora of apps including Marketo, HubSpot, Tableau, PowerBI, etc.
5. Alchemer
Alchemer can be used as a market research survey software. It offers several features and capabilities, some of which include:
- Custom survey experiences with branded URLs and domains
- A plethora of question types and advanced logic capabilities
- Built-in automation actions including email triggers based on respondent behavior
- Report creation tailored to different stakeholders
6. SurveySparrow
SurveySparrow can be used as a market research survey platform. It offers several features and capabilities, some of which include:
- Conversational surveys that feel engaging to respondents
- Various question types including opinion scales, rank order, matrix, and more
- Complete survey customization with themes and styling of buttons, text, fonts, and colors
- Filtering and data comparison tools for analysis
- Multi-channel distribution through email, SMS, QR codes, web links, and social media
- Offline survey app for data collection without internet connectivity
7. Forsta
Forsta can be used as a market research survey tool. It has several features and capabilities, some of which include:
- Supports video open-ends to capture qualitative insights alongside quantitative data
- Offers easy translation capabilities for multilingual surveys
- Allows for customizable branding and design of surveys
- Enables multimedia embedding within surveys for enhanced engagement
- Includes robust reporting and data export options
Budget-Friendly Entry-Level Options
8. Google Forms
Google Forms is a free tool that can be used as an online survey software for market research. It has several features and capabilities, some of which include:
- Various question types including multiple choice, checkboxes, short answer, and more
- Supports image and video embedding within surveys
- Enables conditional logic for creating branching and skip patterns
- Enables easy distribution via email, links, embedding, etc.
- Allows for real-time response monitoring as data comes in<
- Provides basic data visualization with automatic charts and graphs
- Features full integration with Google Workspace (Google Sheets, Dogs, Slides)
9. Typeform
Typeform can be used as a software to run market research. It has several features and capabilities, some of which include:
- Various question types including multiple choice, opinion scales, matrix questions, etc.
- Conditional logic to show questions based on previous answers
- Video embedding for more engaging survey experiences
- Optional URL redirects based on responses
- Customization of fonts, colors, and branding elements
- Optional hidden fields to track where respondents are coming from
- Data export options for further analysis
- Multi-language capabilities for global research
10. SurveyPlanet
SurveyPlanet is a market research tool that can help you run surveys. It offers several features and capabilities, some of which include:
- Various question types and branching or skip logic based on previous answers
- Pre-written survey templates and questions for quick start
- Insights on which survey sections cause participants to abandon
- Survey length estimator to help reduce abandonment rates
- Optional email and text notifications for new survey responses
11. Microsoft Forms
Microsoft Forms can help you run surveys for market research. It offers several features and capabilities, some of which include:
- Various question types including multiple choice, text, rating, and ranking
- Ability to import questions from Excel files
- Branching logic to direct respondents to specific questions based on previous answers
- Automatic insights for data analysis including word clouds for text responses
Get Survey Responses (3 Free Options & Paid Solution)
Get Survey Responses (3 Free Options & Paid Solution)

Finding people in your target audience and getting them to complete your survey is a challenge, and there are two main approaches to solving this problem:
- Free survey recruitment platforms: These work on a reciprocal model where you earn responses for your own survey by participating in surveys created by other users. Free platforms primarily focus on finding respondents for your survey — they’re not end-to-end survey solutions.
- Paid end-to-end survey tools: These are all-in-one platforms that handle every aspect of the survey process and deliver higher quality data. You can design your questionnaire, select an audience that precisely matches your criteria, and analyze the results — all within a single platform.
In this post, we'll examine how 3 leading free survey recruitment platforms work, highlight their key limitations, and show how Pollfish, our end-to-end survey solution, helps teams get more high-quality responses while staying within their budget.
3 Popular Free Survey Tools & How They Work
The most popular options on the market to get free survey responses are:
- SurveyCircle — Operates on a rankings based incentive system called SmartRank® (rather than a direct one-for-one swap), where participating in surveys earns points that increase your own survey's ranking and visibility.
- PollPool — Operates on a reward system where you earn PollCoins by completing other users' surveys. As your PollCoin balance grows, your status increases, which directly speeds up how quickly you receive results for your own surveys. If you prefer not to take others' surveys, you can simply purchase PollCoins directly.
- SurveySwap — Operates on a simple credit-based system. One minute of survey time equals one point. For example, after completing a 5-minute survey, you earn 5 points — enough to have one person complete your own 5-minute survey. If you prefer not to take surveys yourself, you can simply buy points instead.
It's important to remember that these free platforms are primarily for participant recruitment — they’re not end-to-end survey tools.
The typical workflow looks like this:
- Create your survey using an external tool (e.g., Google Forms or a paid platform like Pollfish).
- Link your finished survey to the free survey recruitment platform of your choice.
- If the free platform allows, select your target audience from their available criteria, which tend to be extremely broad (e.g., location, language, etc.).
- To view responses, log into your original survey tool where the data is collected and use that tool's reporting features for analysis. The free recruitment platforms usually only show you the number of responses received and your current credit balance.
Limitations of Free Tools for Survey Responses
Free survey exchange platforms can be appealing for academic research projects, early-stage startups, non-profits, or any time budgets are quite small. However, they have some notable downsides:
- Inability to precisely target your desired audience: If you need to survey a specific audience segment, like dog owners aged 30–40 in NYC with a household income over $100k, free platforms won't provide the granular filters needed to target that exact group. You'll end up having to settle for a generic audience that doesn't fully match your ideal participant profile (e.g., people with a NYC address).
- Lower response quality: On free platforms, respondents are incentivized to complete as many surveys as possible, as quickly as possible, so they can earn more credits to redeem for responses to their own surveys. This model encourages people to rush through surveys without carefully reading questions or thoughtfully considering their answers. As a result, the data quality is significantly lower compared to paid platforms that use trusted consumer research panels and have advanced quality checks in place.
- Inefficient use of time filling out surveys: With free survey platforms, you may spend hours filling out other people's surveys just to unlock responses to your own. This might not be an effective use of your skills and bandwidth, and it’s valuable time that could be used on other important research activities.
- Clunky multi-platform workflow: Using different tools to create surveys and find survey participants adds extra steps and slows things down. With an all-in-one solution, you can manage everything — from designing your questionnaire to targeting the right audience to analyzing the results — in one place. This improves data quality and makes the process faster, simpler, and more efficient.
Pollfish’s Flexible Pricing Model & How to Get Survey Responses in 4 Simple Steps
Pollfish overcomes the limitations of free survey platforms by offering an all-in-one solution for creating and analyzing surveys, ensuring high-quality responses from your targeted audience. When you launch your survey, it reaches our global audience of 250M+ consumers, with built-in quality checks and fraud prevention measures.
We stand out from many other DIY market research tools with our flexible, transparent pricing model:
- Pay-per-response model: With Pollfish, you only pay for the results you need, on-demand. There are no subscriptions, annual contracts, or use-it-or-lose-it response allotments — ensuring you never waste money on unused capacity.
- Real-time cost calculator: As you build your audience, you'll see the cost-per-response and total cost update instantly. For example, if your cost-per-response is $0.95 and you need 500 responses, the total cost will clearly display as $475 — no setup fees, hidden charges, or surprises.
Now, let's explore how you can get survey responses with Pollfish in 4 simple steps. You'll see how to fine-tune every aspect of your survey and capture the exact data you need from the right respondents.
Step 1: Set your audience
The first step is to set your target audience (although you can start with the questionnaire first if you prefer).
Pollfish offers over 50 targeting criteria to choose from, organized into 6 categories:
- Demographics
- Geographic Criteria
- Consumer Lifestyle
- Employment & Occupation
- Behavioral Data
- Media
You can keep your audience broad by selecting just a few key demographic filters like age and gender. But you also have the flexibility to get extremely precise.
For example, while it's unlikely anyone would ever target such a specific audience, to illustrate the level of granularity possible with Pollfish, you could choose to survey only:
- Men ages 45–54
- Living in Phoenix
- With a master’s degree
- Who own pets
- Enjoy cycling and hiking
- Subscribed to Peacock
- Have visited pet websites in the past month
- Earn between $100,000–$150,000 per year
- Work in the technology industry
- Frequently shop at Trader Joe's
In addition, to ensure high audience quality, Pollfish maintains carefully curated proprietary respondent communities:
- New members undergo a 30-day evaluation period before participating in client surveys.
- Continuous validation methods are employed, such as cross-referencing respondent-provided demographic information with behavioral data, like shopping receipt uploads (e.g., a respondent claiming to buy organic products weekly can be verified against actual purchase history, eliminating misrepresentation).
- We also utilize sophisticated anti-fraud measures, including unique user IDs, device-carrier validation, advanced proxy detection, etc.
This is just the tip of the iceberg. Data integrity stands at the core of our company's mission, with additional verification layers and continuous quality improvement measures to ensure you receive the most reliable survey results.
Step 2: Design your questionnaire
With audience targeting complete, the next step is to design your questionnaire. This involves two key components:
- Select from 14 question types, including Single selection, Multiple selection, Open ended, Numeric open ended, Description, Rating stars, Slider, Ranking, Matrix single selection, Matrix multiple selection, Net Promoter Score (NPS), A/B test, Conjoint analysis, Max Diff, and Van Westendorp. (Learn more about each question format.)
- Implement advanced survey design elements. Beyond the question types themselves, Pollfish provides a range of additional customization options to increase response quality, such as:
- Screening questions: Further qualify survey respondents by their answers (e.g. ask "Do you own a dog?" to screen out non-dog owners).
- Skip logic branching: Create custom question paths based on previous answers (e.g. show different follow-ups to those who select "puppy" vs. "adult dog").
- Randomize answers: Shuffle the order of answer options to prevent bias (e.g., when asking "What matters most when buying dog food?", randomly vary whether "price," "ingredients," or "brand" appears first for each respondent to avoid skewing results toward the first option).
- Multimedia: Include images and videos in questions for added context and engagement (e.g. show photos of different packaging designs and optionally require respondents to watch videos in their entirety before answering).
- Carry forward answers: Insert a respondent's previous answer into a follow-up question for specificity and personalization.
- One-click "Other" and "None" options: Add these common answer choices to all relevant questions with just one toggle switch, eliminating the tedious task of manually typing them for each individual question in your survey.
No matter how precise or complex your online survey needs to be, Pollfish almost certainly has the capability to execute on your vision. (See more survey design possibilities.)
Step 3: Launch your survey and receive fast turnaround time
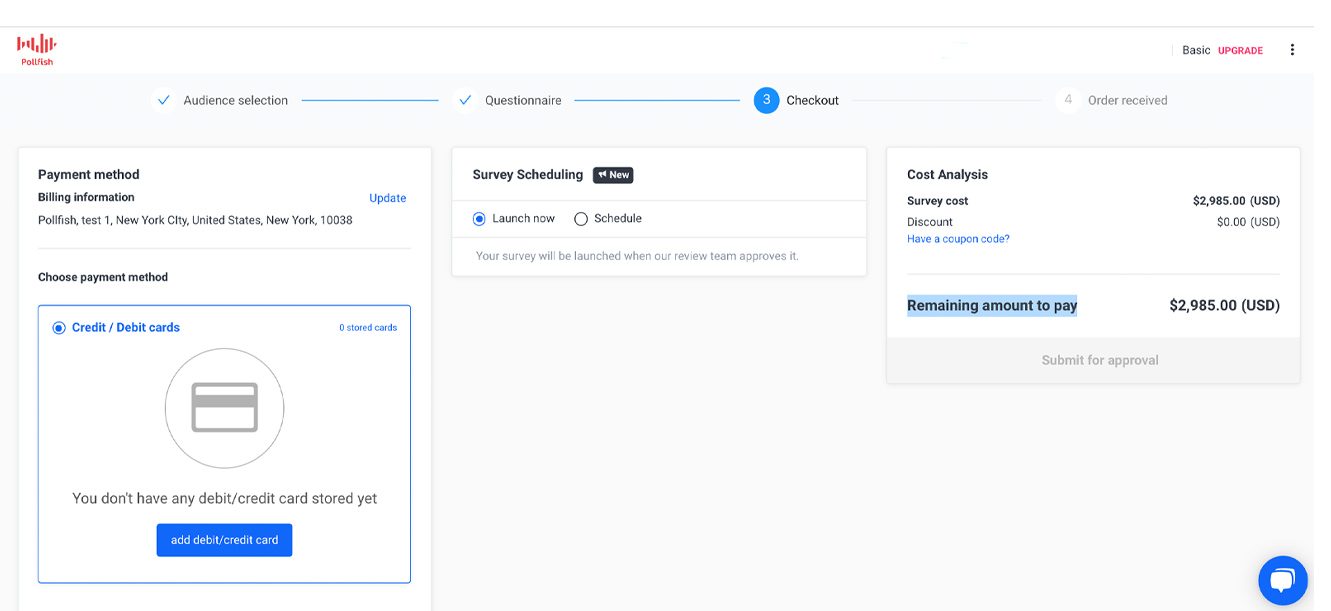 Once approved, your survey goes live and Pollfish's respondent targeting engine begins identifying qualified participants.
Since Pollfish engages respondents through its own consumer communities, rather than relying on third-party panel providers, we can deliver faster turnaround times than most competitors — without any extra charge.
- For general population surveys (e.g., coffee consumption preferences among American adults 18–49), it's common to receive hundreds of responses within just a few hours.
- For more niche audiences, it may take a few days depending on the criteria. For example, a survey targeting board-certified pediatric oncologists practicing in rural hospitals might require more time. However, even with niche audiences, we're typically faster than competitors.
Step 4: Analyze your results
Once your survey is complete, Pollfish's reporting dashboard allows you to easily explore your results. You can browse an interactive example of the reporting interface here.
Some of our key analysis features include:
- Automatic chart creation: Pollfish will automatically visualize each survey question with an appropriate chart type (bar, pie, line, etc.) so you can quickly interpret results at a glance.
- Custom styling: Have a specific color palette, font, or other branding element you want to carry into your reports? Pollfish lets you customize the look and feel of your charts.
- Demographic filtering: Want to compare results between men and women, or see how different age groups responded? Demographic filters let you drill down and examine any segment with ease.
- Response-based filtering: Zoom in on people who provided a certain response to understand the rest of their answers (e.g. among those who said your product price "exceeds their budget", how did they rate its features?).
- Flexible export options: Export your charts and findings via PDF, Excel, SPSS, Crosstabs, or various image formats to easily include them in presentations and decision-making discussions.
- Advanced analytics, eliminating the need for Excel: Pollfish’s Advanced Insights Builder (available on the Elite plan) empowers you to perform complex analysis that would normally require exporting to Excel, like comparing survey results across multiple variables. For instance, breaking down sentiment by age, gender, income, and region simultaneously. It also allows for stat testing to identify meaningful differences between groups, the ability to create advanced custom charts, and much more — all without leaving the platform.
Create a Free Pollfish Account
Create your free Pollfish account and start designing your first market research survey. You can also request a demo for personalized help.

14 Best Market Research Tools & Software (by Category) in 2025
14 Best Market Research Tools & Software (by Category) in 2025
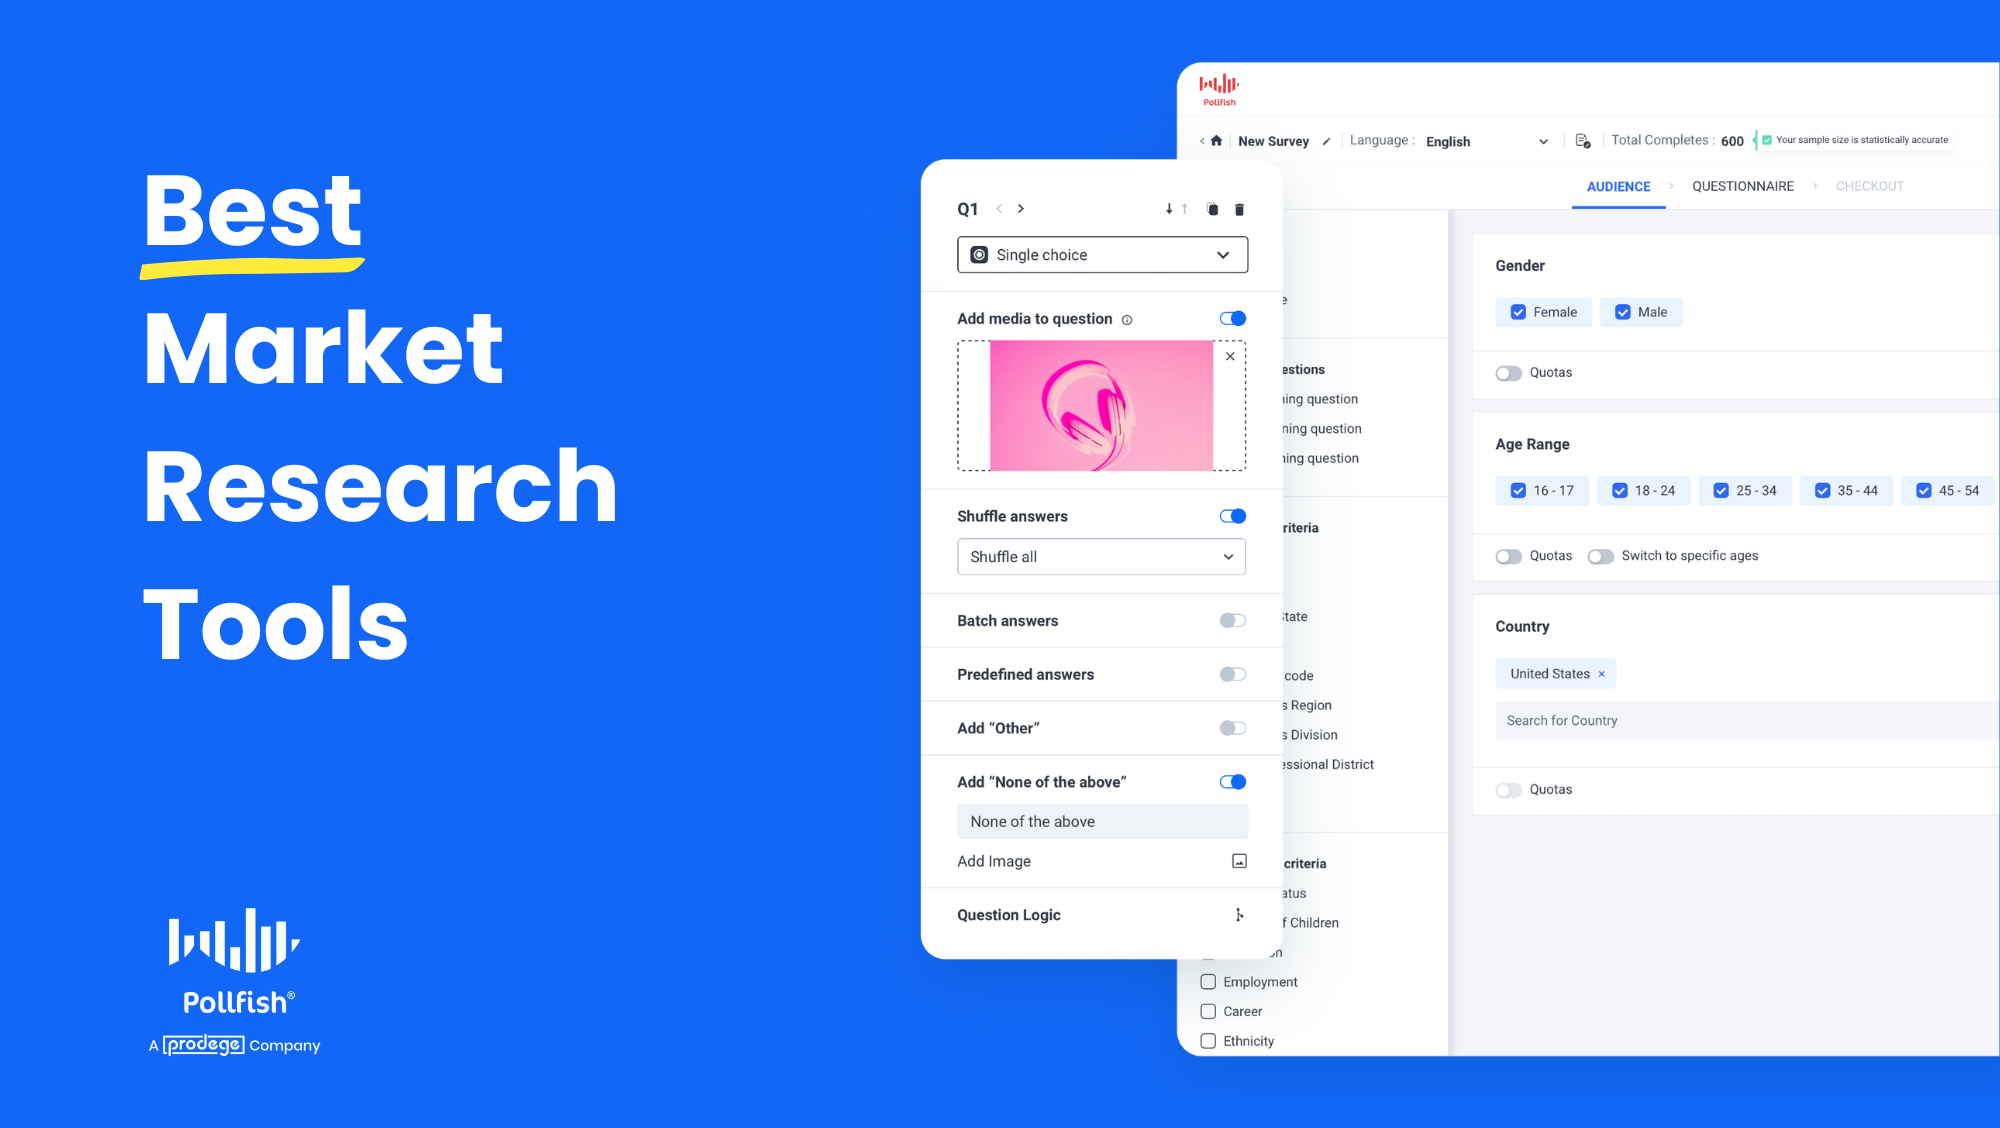
Market research is a broad category that includes everything from surveys, online focus groups and one-on-one interviews, broad data aggregators, social media sentiment analysis, and more.
To accommodate these use cases, there are hundreds of different types of market research tools available so it can be difficult to wade through all of them to find what you need.
To help narrow down your search, we’ll cover 14 options in the following categories:
- Surveys: Surveys are easy to conduct, often delivering results within hours or days. They help you get answers to specific questions rather than relying on information others choose to share. Most survey software also makes it easy to analyze and segment data for targeted insights.
- Focus groups and interviews: When speaking to research participants, you can ask follow-up questions, gauge their tone and mood, and gain deeper insights than most other research methods. However, they’re extremely expensive and time-consuming to conduct.
- Data aggregators: While data aggregators like Statista or the U.S. Census Bureau provide broad statistics on a wide range of topics, the audience targeting options may not be as specific as what you need.
- Social media sentiment: Depending on your research goals, analyzing social media mentions (e.g., posts, comments, hashtags) related to your brand, a competitor, or a specific topic can be valuable. On social media, people tend to be more honest, offering unique perspectives you might not hear via other research methods.
- Data visualization: Analyzing large market research datasets can be overwhelming, but data visualization tools like Tableau simplify complex data into clear visuals, making it easier to spot trends and gain actionable insights.
- Competitor research: You can gain insights by analyzing competitors’ marketing campaigns, such as their best-performing social media posts, ad photos and copy, organic keywords they’re targeting on Google, and more.
To kick off the list, we’ll provide an in-depth overview of how our market research software, Pollfish, can help you easily launch surveys.
Survey Market Research Tools
We'll begin by exploring four widely used survey market research tools, starting with our own platform, Pollfish. Throughout the article, we'll also cover other categories of market research tools, providing a comprehensive overview of available options.
1. Pollfish
Pollfish understands that survey fraud and low-quality responses are significant concerns that can compromise the integrity of your research. In this section, we'll outline our comprehensive approach to addressing these issues, which should be a top priority regardless of the survey software you use. Even a perfectly designed survey can be compromised if the software lacks strong safeguards against fraudulent and poor-quality responses.
Once we've covered this crucial aspect of maintaining data integrity, we'll delve into the features and functionality of our survey market research platform. We'll start with a concise summary of how it works, followed by a more detailed breakdown.
Finally, we’ll highlight three additional benefits of choosing Pollfish:
- Fast survey turnaround.
- Transparent, usage-based pricing.
- Stellar customer support, from basic inquiries to advanced research guidance.
Addressing Survey Fraud & Low-Quality Responses: Pollfish's Multi-Layered Strategy
Survey fraud and low-quality responses have become major challenges in market research, particularly since the COVID-19 pandemic. Many companies struggle with bots, speedsters, and other forms of bad data, leading to inaccurate results and frustrated clients.
At Pollfish, combating survey fraud and ensuring high-quality responses isn’t just an afterthought — it's part of our DNA. We’ve invested significant effort in developing a robust, multi-faceted approach that enhances the validity and reliability of our data, setting us apart in the industry.
Specifically, we own and nurture proprietary consumer communities worldwide. Our direct relationship with these consumers enhances the quality and authenticity of our survey responses.
One of our primary communities, Swagbucks, allows members to engage in activities such as downloading games, shopping online, and uploading receipts to earn "swag bucks," which can be redeemed for cash or prizes.
Owning communities like Swagbucks offers several data quality benefits:
- Our long-standing relationships with panel members allow us to closely monitor behavior and verify authenticity. For instance, if a member makes a purchase through our shopping channel, we can be confident they’re a genuine person, not a bot.
- New members undergo a 30-day evaluation period, completing internal profiling surveys to ensure they are reliable respondents before they can participate in client surveys.
- When members submit purchase receipts, we store that information in our database. This enables Pollfish users to create targeted audiences based on behavioral data, such as filtering respondents who have purchased specific products (e.g., Frosted Flakes cereal) or shopped at particular stores (e.g., Dollar General). Leveraging this purchase data improves the accuracy of audience targeting.
To further ensure the quality of our survey responses, we employ advanced data cleaning techniques, including:
- Unique user ID: We prevent duplicate survey takers by assigning individual user IDs.
- Technical consistency: We verify that the respondent's carrier and targeting information align.
- Verified partnerships: We remove low-quality respondent pools to maintain data integrity.
- Trap questions: We incorporate "captcha" type questions to identify and eliminate bots.
- Speeding prevention: We set time minimums for each question to ensure thoughtful responses.
- Anti-VPN measures: We only allow responses from verifiable locations to prevent fraud.
- Gibberish detection: We filter out nonsensical or irrelevant responses.
- Straight-lining detection: We identify and remove respondents who repeatedly select the same answer.
- Human review: We manually check text responses for quality and coherence.
- Ranking system: We assign trust scores to our panelists based on their response quality history.
Brief Overview: How Our Survey Market Research Software Works
Creating a market research survey with Pollfish involves three key steps:
Step 1: Define Your Target Audience
Select from a wide range of targeting criteria, organized into six categories: Demographics, Geographic Criteria, Consumer Lifestyle, Employment & Occupation, Behavioral Data, and Media. This flexibility allows you to tailor your audience to be as specific or broad as needed for your research goals. Pollfish also enables you to set audience quotas to ensure a balanced sample and prevent skewed results.
Step 2: Craft Your Survey
Pollfish offers dozens of question types, allowing you to choose the best format for your needs, including single selection, multiple selection, open-ended, numeric open-ended, rating stars, slider, ranking, matrix (single and multiple selection), Net Promoter Score (NPS), and more.
Enhance data quality by adding screening questions, shuffling answer options, and utilizing skip logic to create custom survey paths based on participants' responses.
Step 3: Analyze Your Data
Utilize our powerful, user-friendly reporting tools to uncover meaningful insights. Results can be visualized in table formats, color-coded charts, pie charts, and more.
You can also apply targeting filters to focus on specific subgroups or demographics, as well as response-based filtering to refine data based on specific survey responses. The Insights Builder tool, available on the Elite plan, enables you to perform advanced data manipulation and analysis, making it easy for you to create complex graphs and sort and filter variables without the need for Excel. You can also customize the colors of your graphs to match your brand's color palette, ensuring a consistent and professional look across all your visualizations.
Note that while Pollfish is a user-friendly, DIY platform for market research that lets you easily create and launch surveys, we also offer a full-service option.
This can be useful if you have more complex requirements, need customization or functionality not currently available within Pollfish, or are new to conducting surveys and unsure about best practices. Many of our customers choose this route, where we meet to discuss your specific needs, identify the most appropriate type of research for your goals, and provide complete assistance in running your survey from start to finish.
Note: We invite you to register for a free account or book a demo call with our team, where we’ll provide personalized recommendations on how to get the most out of Pollfish.
In-Depth Overview: A Closer Look at How Our Survey Market Research Software Works
Now that we've provided a brief overview of creating a survey with Pollfish, let's take a closer look at each of the three steps and explore the platform's capabilities in greater detail.
Step 1: Precisely Define Your Survey’s Target Audience (Choose from an Extensive Range of Targeting Criteria)
We offer an unparalleled range of targeting criteria, allowing you to precisely define your survey’s target audience, whether it's broad or extremely niche.
The targeting options are conveniently organized into six main categories:
- Demographics
- Geographic Criteria
- Consumer Lifestyle
- Employment & Occupation
- Behavioral Data
- Media
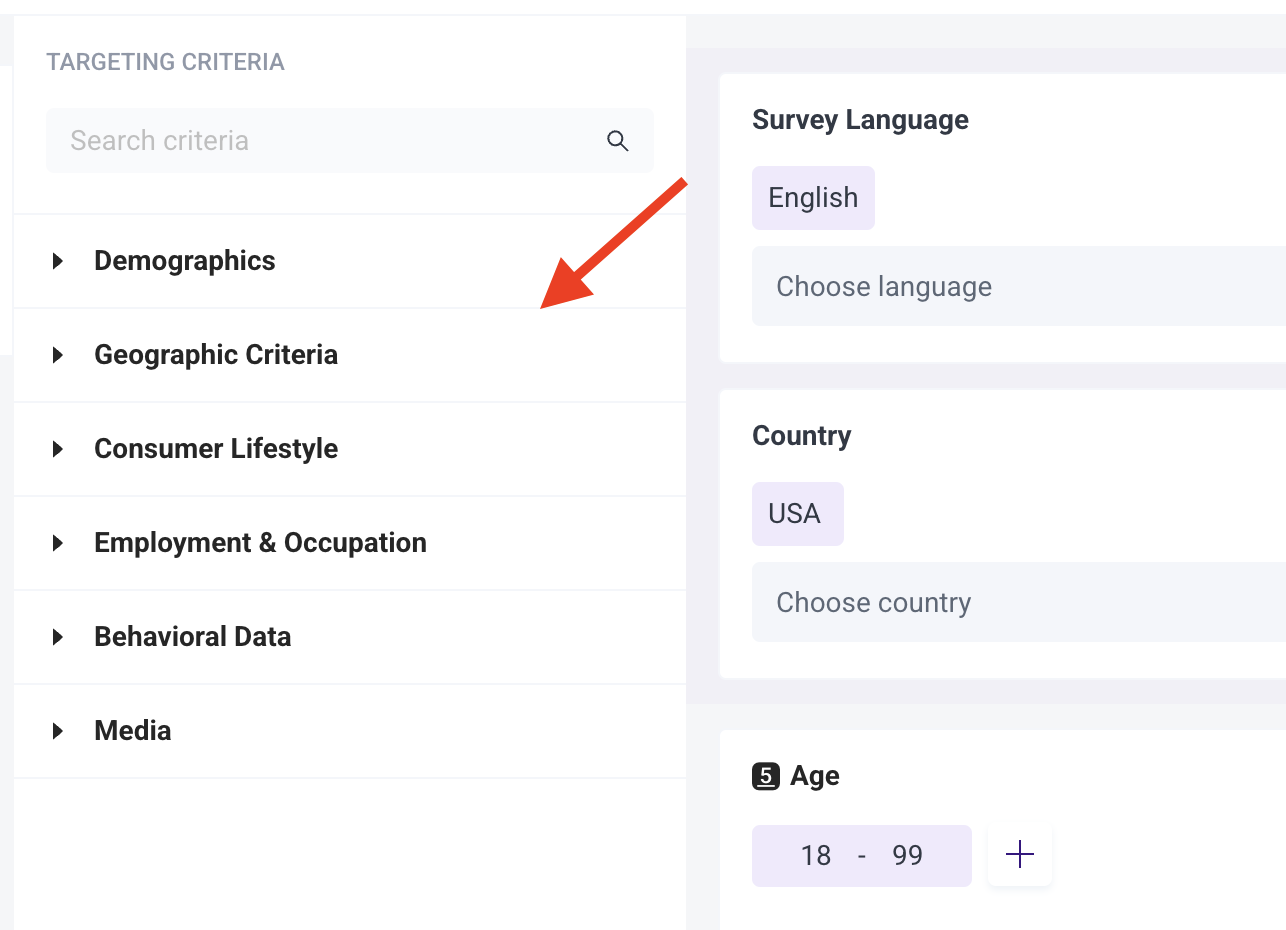
Below, we’ll dive into the details of each category to explore the available options.
Note that while most customers will use only a handful of these targeting options, we want to showcase the full spectrum of possibilities. Pollfish empowers you to be as specific and meticulous as your research goals demand, ensuring you get insights from the most relevant respondents.
Demographics
Age, Gender, Hispanic Origin, Marital Status, Languages Spoken, Education Level, US Voter Registration, Household Income (US), Age & Gender of Child(ren) in Household, Type of Home, Pets in Household, Political Party Support, Hispanic Level of Acculturation, Parental Status / Pregnancy Status, Race, Device Type, Device Operating System (OS), Ethnicity, Number of Children in Household
Geographic Criteria
US State, US Division, US DMA, US Region, US Statistical Area (CBSA), US County, US Zip Code
Consumer Lifestyle
Beverage Consumption, Hobbies & Interests, Sports Participation, Gambling Participation, Music Streaming Services Use, Movie Theater Frequency, Home Movie Viewing Frequency, Video Game Participation, Video Game Consoles, Video Game Genres, Travel by Air for Business/Leisure, Vehicle Make/Brand Own or Lease, Vehicle Type Own or Lease, Health Ailment Diagnosis
Employment & Occupation
Employment Status, Industry Work In, B2B Department, Number of Employees, Job Title
Behavioral Data
Brands Purchased (In-Store), Online Shopping: Retailer, In-Store Shopper, Category Buyers, Retail Channels Shopped (In-Store), Websites Visited, Retail Channels Shopped (Online)
Media
Video Streaming Services Used
Pollfish provides you with the flexibility to be as narrow or as broad as your project demands.
If you're unsure about the best targeting filters for your research objectives, our team is here to help. We'd be delighted to schedule a call to understand your goals and provide personalized recommendations on the most effective filters to employ, ensuring your survey reaches the ideal audience.
Optionally Set Audience Quotas (to Ensure a More Balanced Sample)
Pollfish enables you to set quotas on your target audience to ensure that your survey results are not heavily skewed towards any particular group.
Age quotas are a popular way to utilize this feature. For example, if you want to set quotas based on age groups, you can define four distinct age ranges:
- Gen Z (18–28 years old)
- Millennials (29-44 years old)
- Gen X (45–60 years old)
- Baby Boomers (61–79 years old)
If you're aiming for a total of 500 survey responses, you can choose to distribute the responses equally among each age group. In this scenario, you’d set a quota of 125 responses per age category, as shown below:
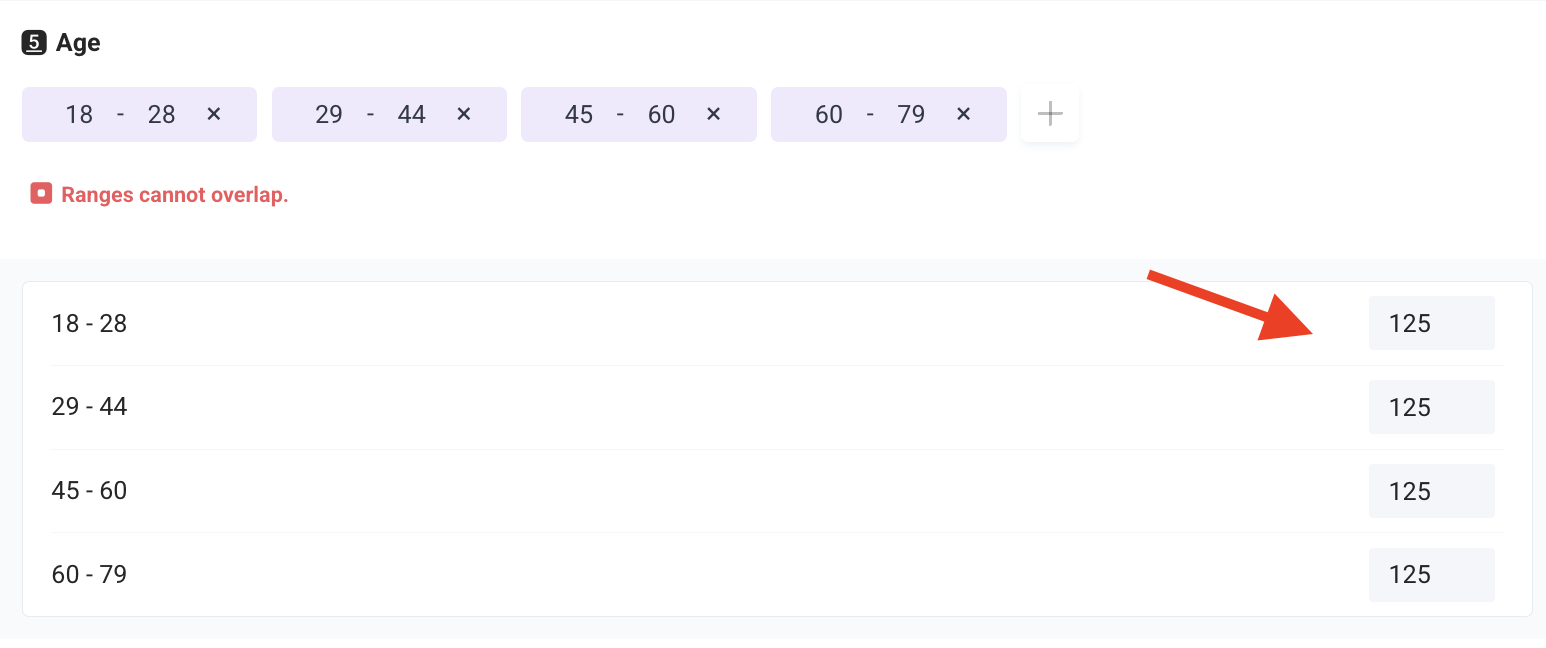
As another option, you can set quotas to have a higher representation of certain age groups, such as Millennials and Gen X, while having fewer respondents from other age ranges, like Gen Z and Baby Boomers.
Step 2: Craft Your Survey Using a Wide Range of Question Types That Align with Your Research Objectives
Pollfish offers a comprehensive set of question types and features to help you create surveys that align with your research objectives.
Choose from 14 Question Types
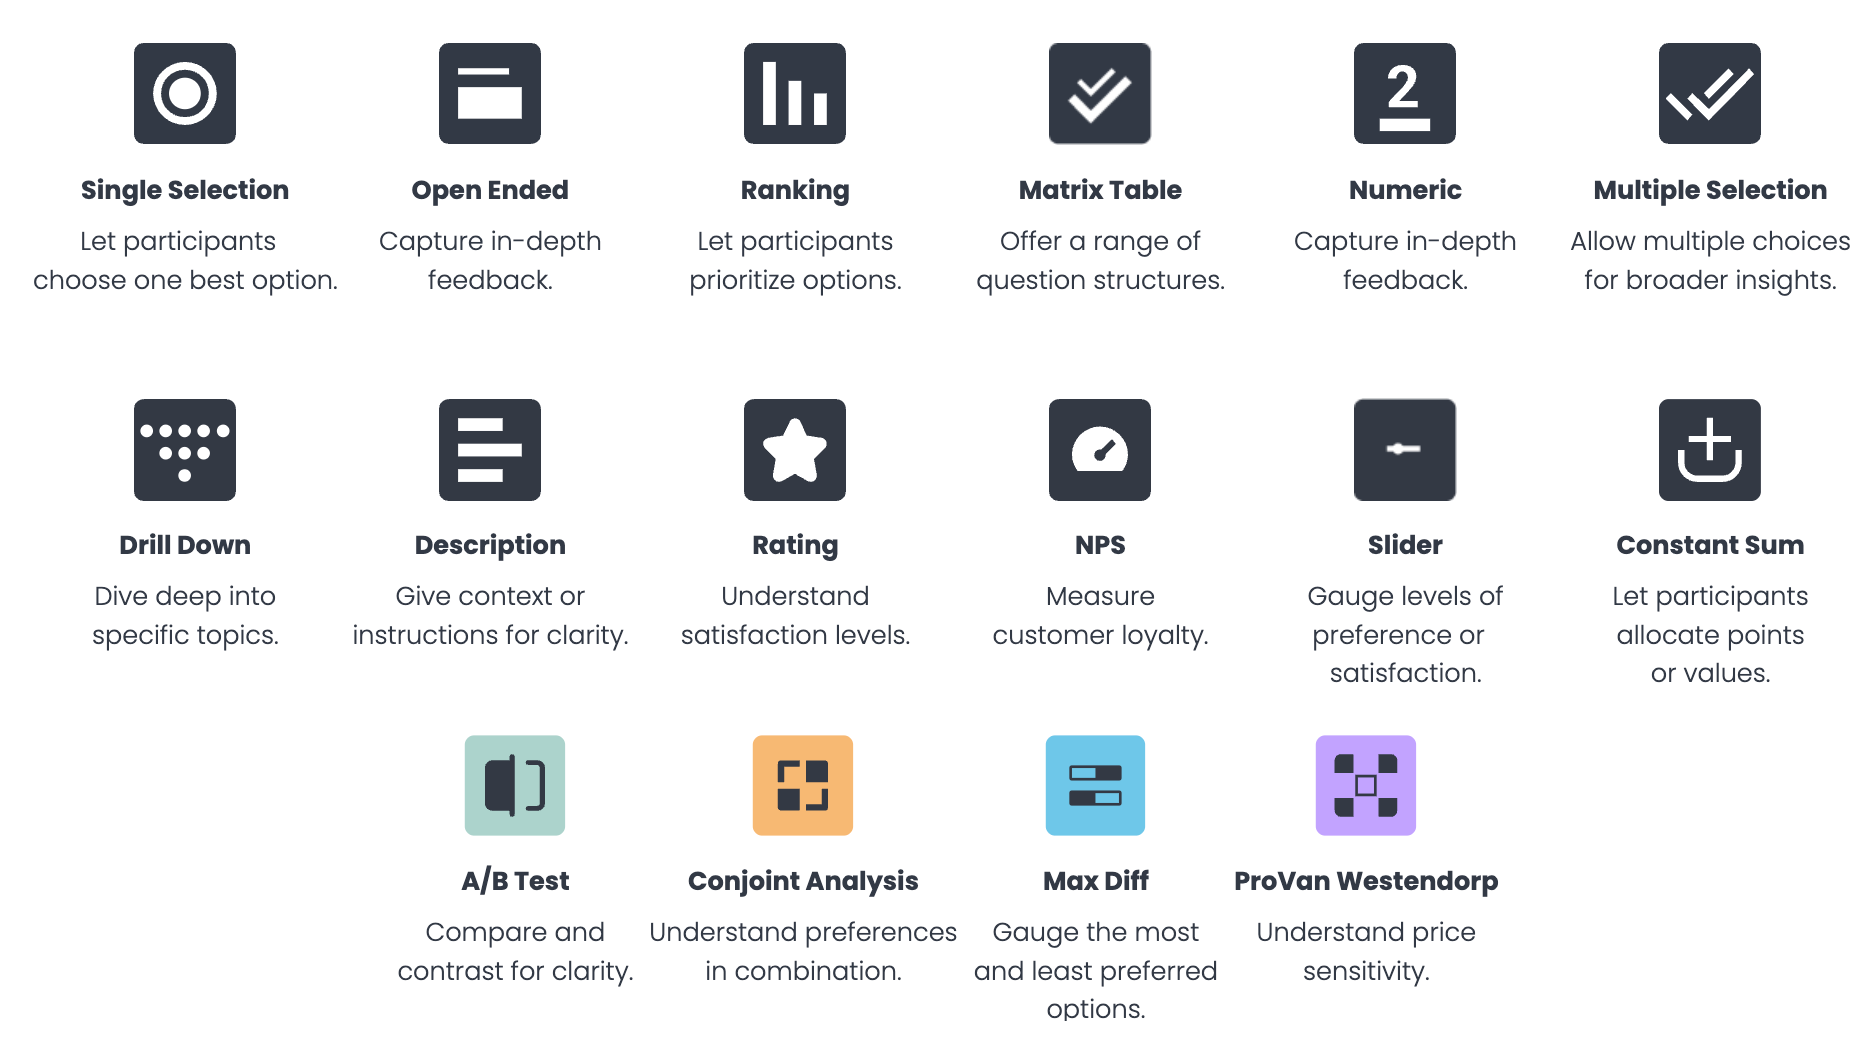
With so many question types available, you can choose the best format for your needs:
- Single selection
- Multiple selection
- Open ended
- Numeric open ended
- Description
- Rating stars
- Slider
- Ranking
- Matrix single selection
- Matrix multiple selection
- Net Promoter Score (NPS)
- A/B test
- Conjoint analysis
- Max Diff
- Van Westendorp
Click here for a more in-depth explanation of each survey question mentioned above, and guidance on choosing the most appropriate ones for your survey.
Add media files to questions
Enhance your questions by adding media files, such as videos. You have the option to require respondents to watch the entire video before they can continue with the survey (ensuring genuine engagement and higher quality responses).
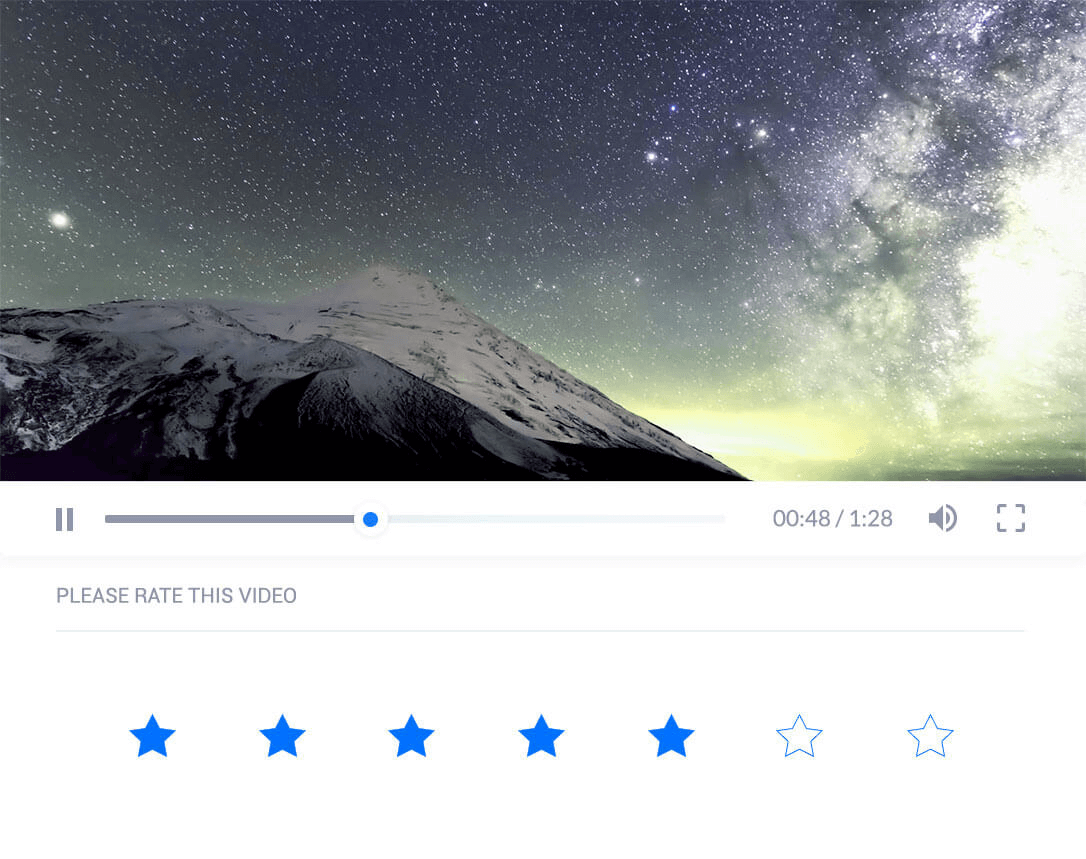
Add screening questions
Screening questions allow you to filter respondents based on their answers, ensuring that only relevant participants complete your survey.
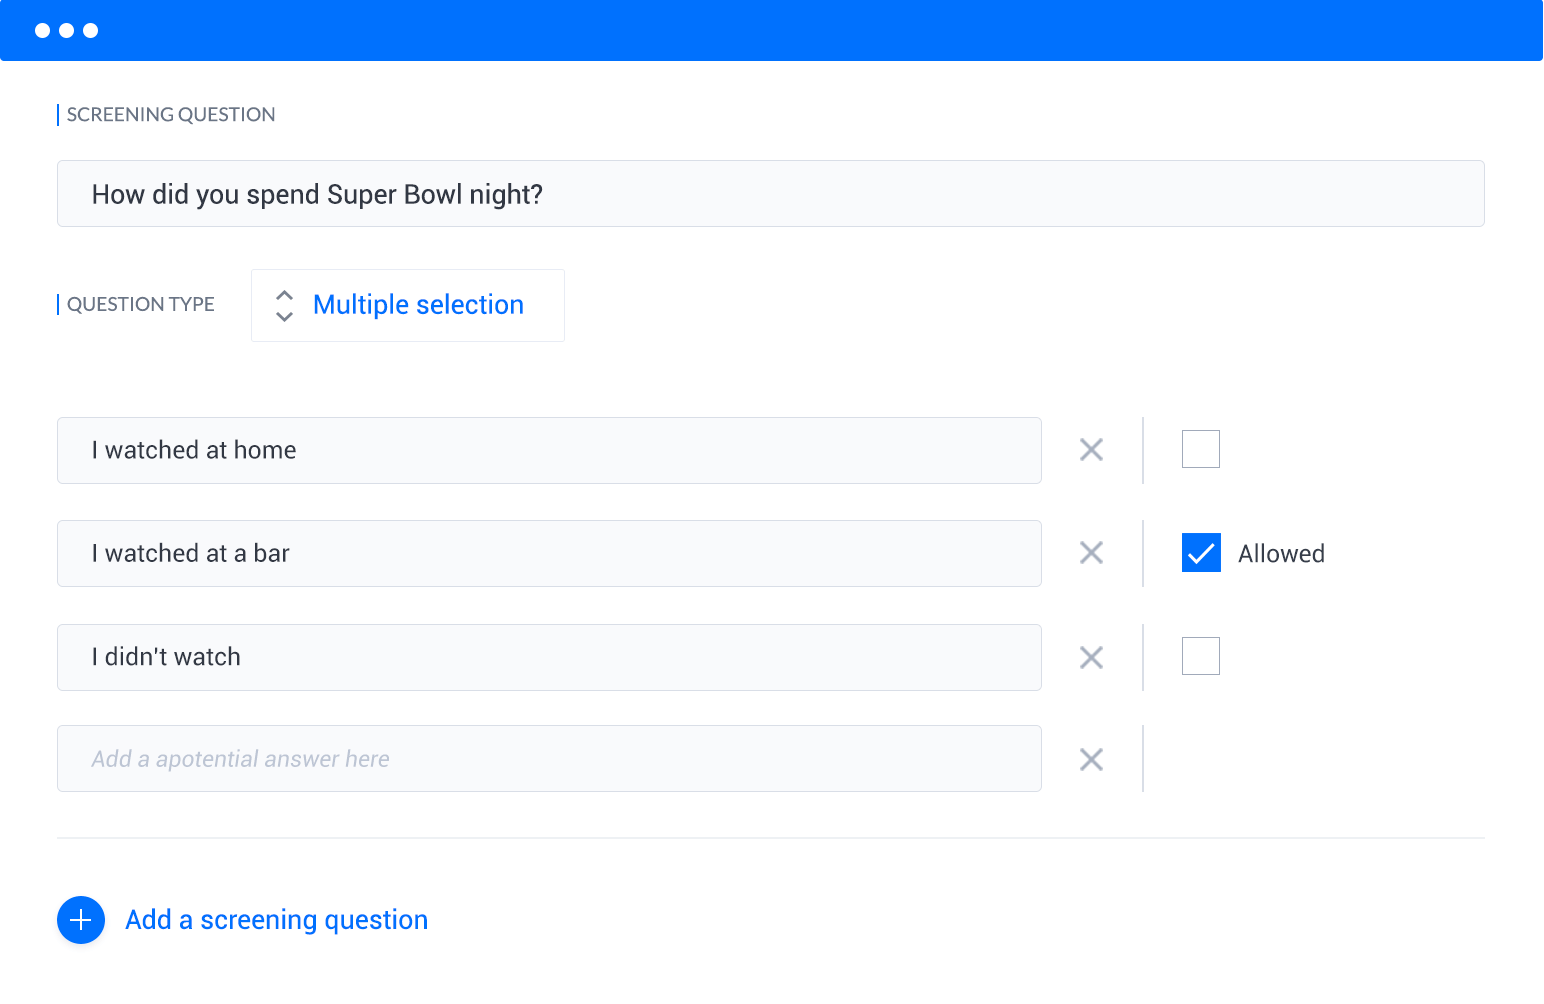
Per the above example, if you asked, "How did you spend Super Bowl night?" and wanted to focus solely on responses from individuals who watched the game at a bar, the survey would be designed to screen out those who selected "watched at home." Only participants who chose "watched at a bar" would be able to proceed with the remainder of the survey questions.
"Other" and "None of the above" Answer Choices
A common frustration for researchers is the need to repeatedly type and add "Other" and "None of the above" as answer choices for each relevant survey question. This repetitive task not only takes valuable time but also increases the risk of forgetting to include these options in some questions.
At Pollfish, we’ve addressed this issue. By simply toggling the "Other" or "None of the above" options, these choices will automatically populate for all relevant question types. The platform ensures that these options always appear as the last choices in the question, even when the answers are randomized or shuffled (a feature we’ll cover next).
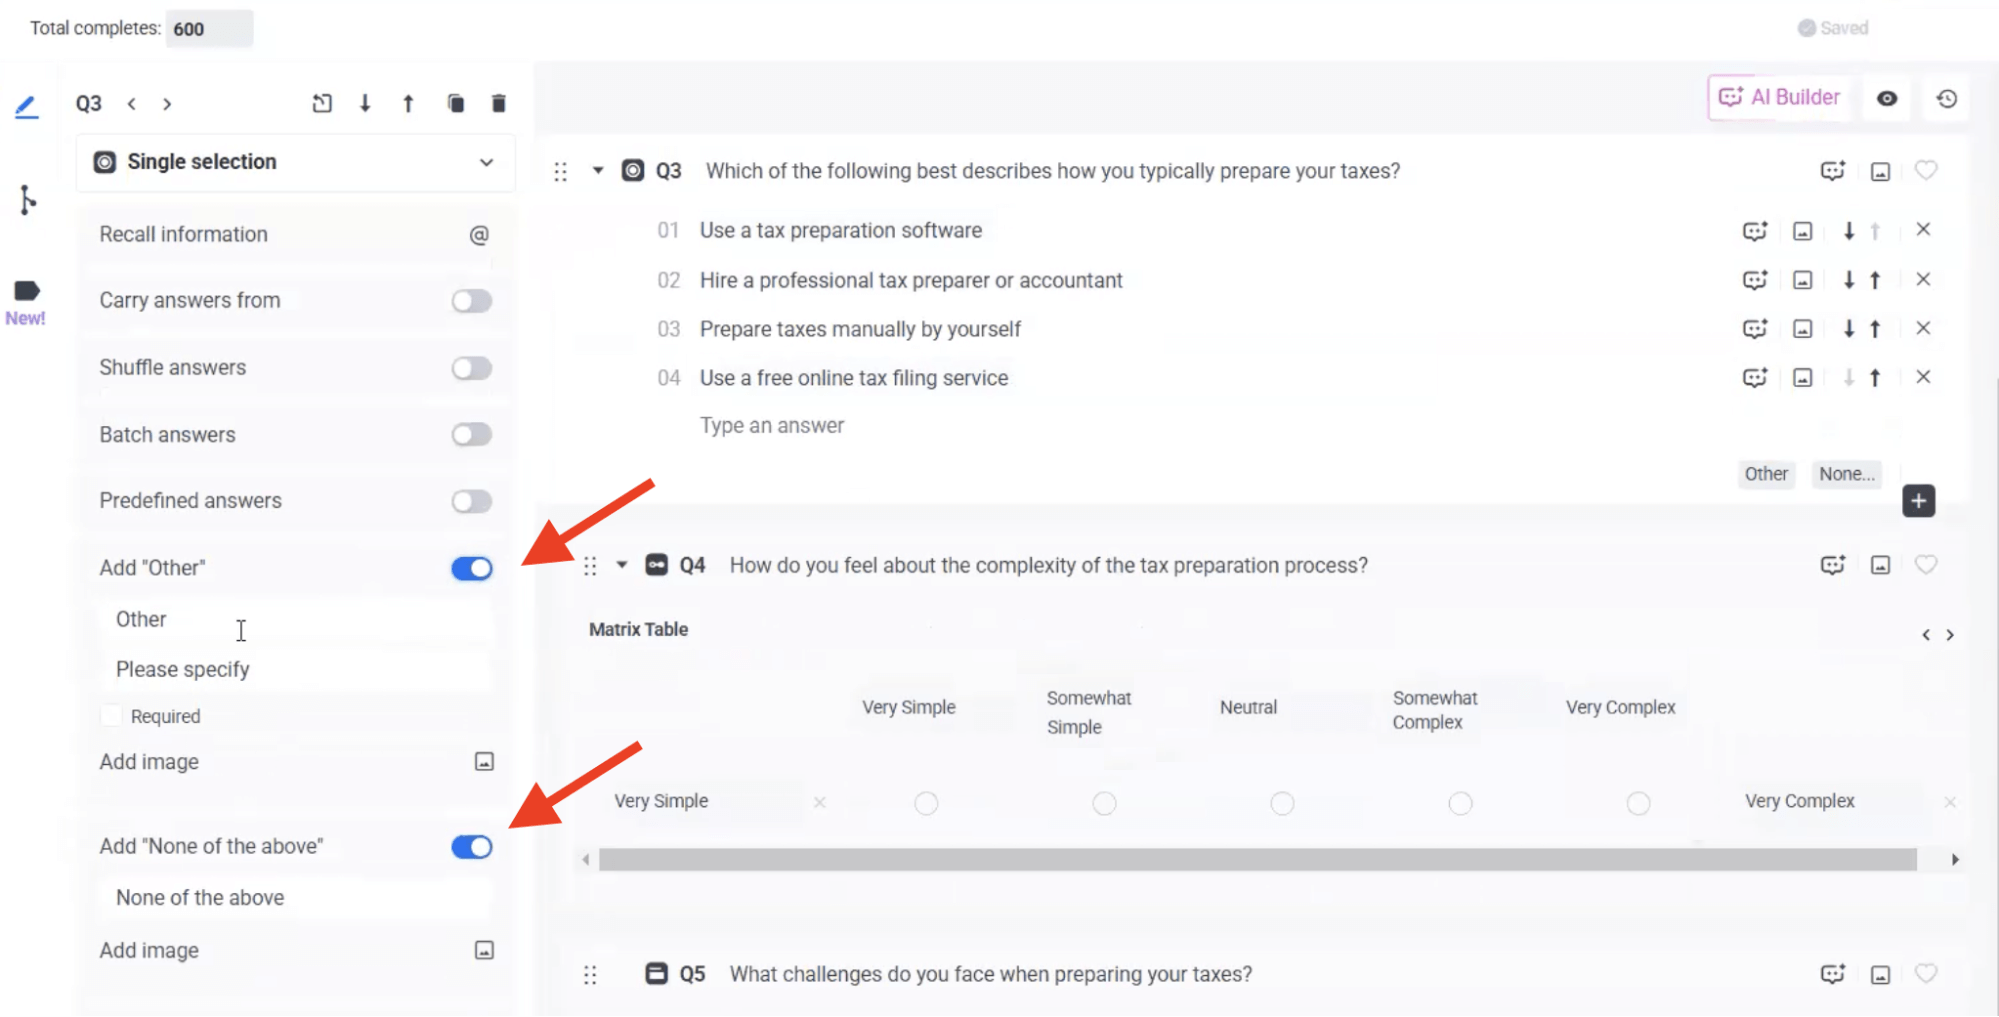

Shuffle Answers
Pollfish lets you randomize the order of answer choices, reducing potential bias and ensuring more accurate and reliable data.
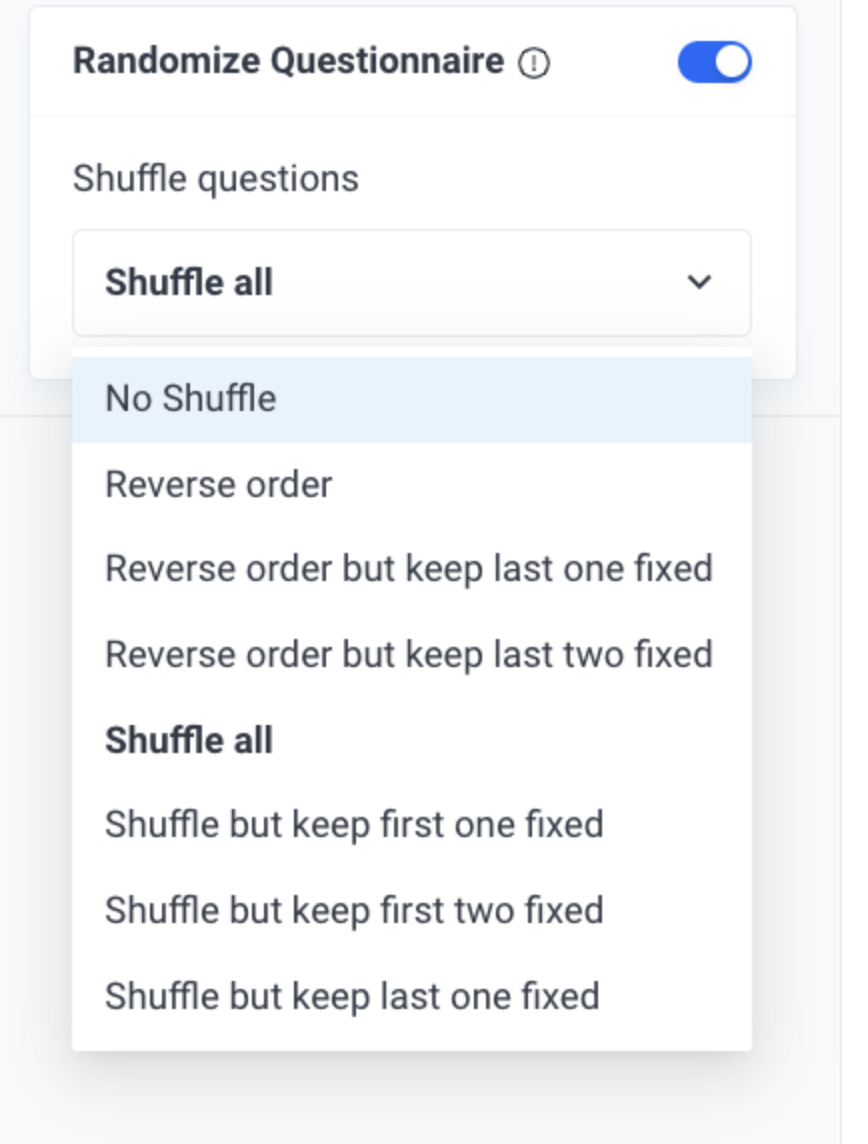
Various shuffling options are available, such as shuffling answers in reverse order, keeping the last answer fixed, and more.
Add Skip Logic (Conditional Branching)
Skip logic allows you to direct respondents towards different survey paths based on their previous answers. For example, if a respondent selects "cost" as an important factor in the first question, you can direct them to a series of cost-related questions (while skipping other irrelevant questions).
This helps respondents be served questions that are more relevant to them, increases survey completion rate, and gets you higher quality data.
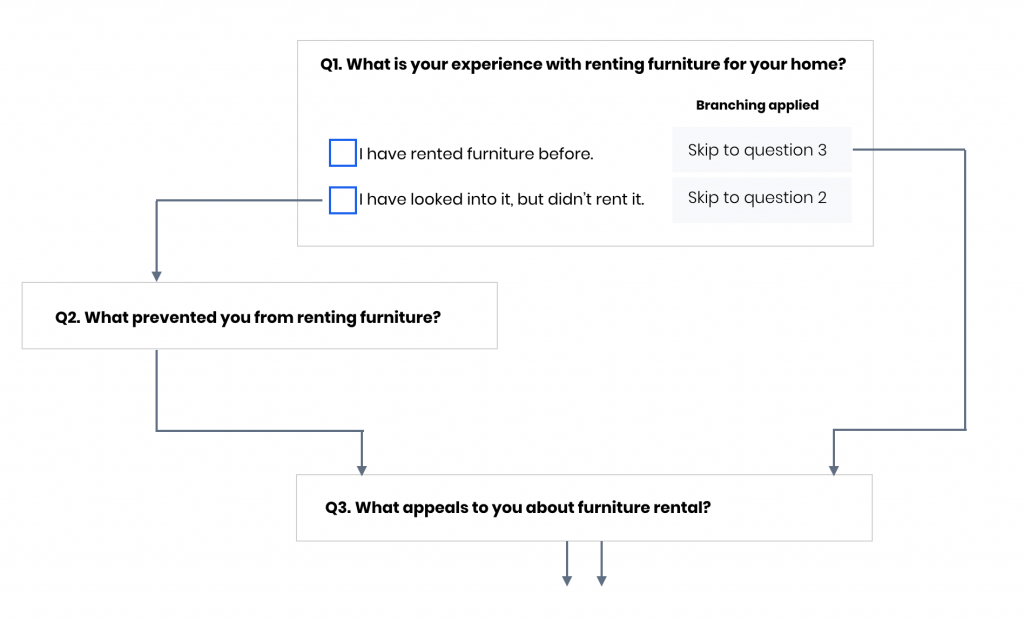
Per the above example, say you're conducting a survey about furniture rentals. In the first question (Q1), you ask “What is your experience with renting furniture for your home?”. Using skip logic, you can guide respondents to different follow-up questions based on their answer:
If they have rented furniture before, they skip Q2 and proceed to Q3, which asks what appeals to them about furniture rental.
If they have looked into it but didn't rent, they are directed to Q2, asking what prevented them from renting, before moving on to Q3.
Advanced Logic Path
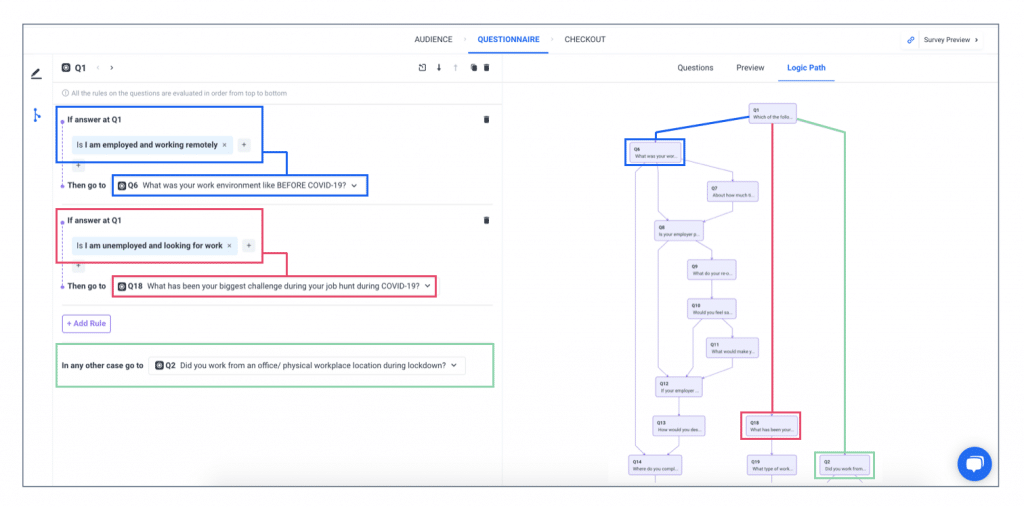
An advanced logic path is a more sophisticated version of a standard skip logic sequence.
A common use case for this feature is aided awareness, where respondents are asked about their familiarity with specific brands. If a respondent indicates they are unaware of the brands, they can be skipped to a later question.
To illustrate this concept, consider a survey where in question 1 (Q1), respondents are asked which sodas they have purchased in the past month.
If a respondent selects Diet Coke, Pepsi, and Fanta, the next series of questions (Q2–Q5) will be related to those three brands. If they had selected "Don’t know, can’t recall", they would have been directed to question 6 (Q6), skipping questions about those brands altogether.
Step 3: Uncover meaningful insights from your survey data with our powerful, user-friendly reporting tools
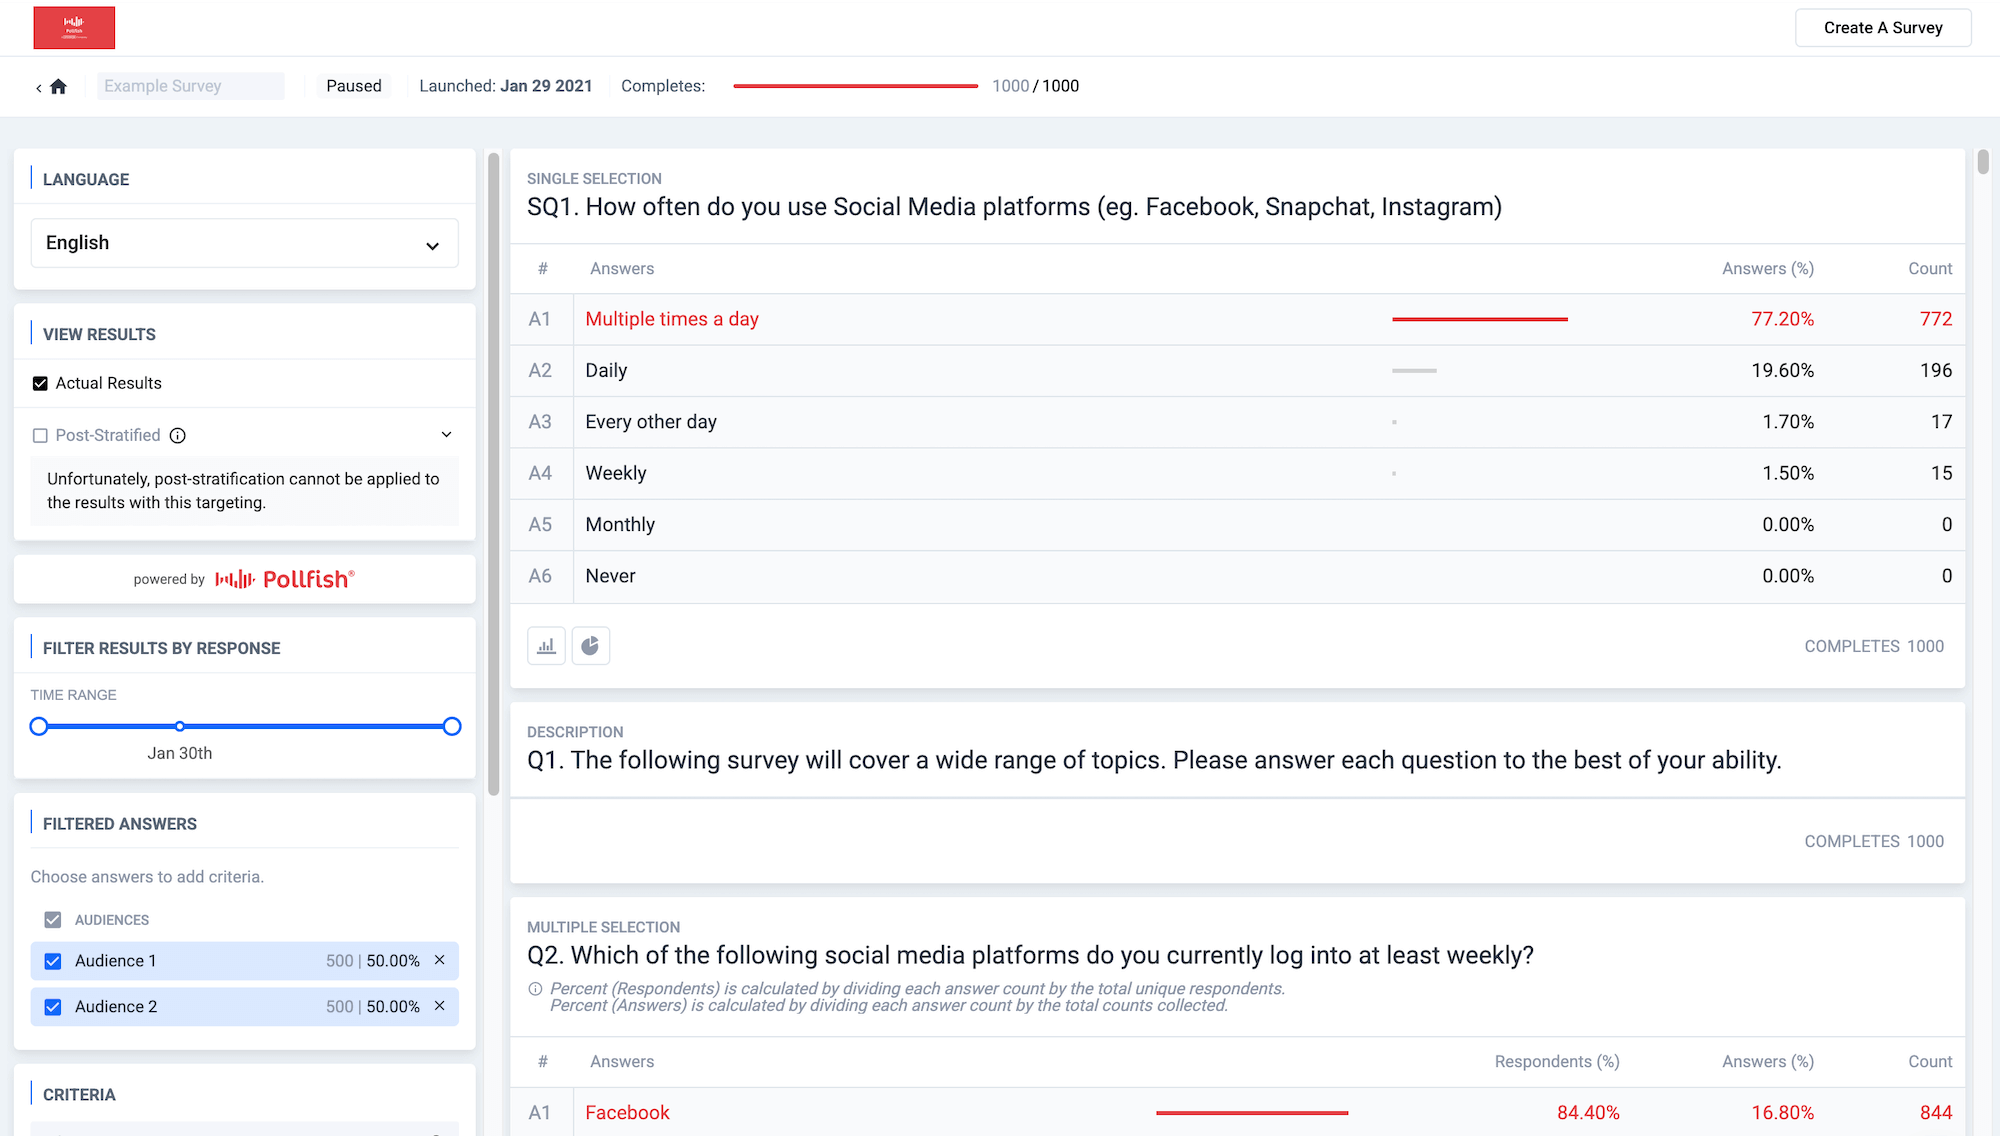
Now that we've explored the versatility and customization options available when crafting your survey questions and setting your target audience, let's dive into the next critical phase: analyzing your survey results and extracting meaningful insights once your survey is launched.
Note: One of Pollfish's standout benefits is its quick turnaround time — most surveys are completed within two days, with some finalized in just a matter of hours, allowing you to start analyzing your results promptly.
Interact with Our Survey Results Dashboard: A Hands-On Experience
In the upcoming section, we'll explain how our Survey Results Dashboard works. However, words alone can’t fully convey the experience, so we encourage you to explore the dashboard firsthand and see Pollfish in action.
Follow this link to access a live demo of our Survey Results Dashboard. This interactive experience will let you navigate the features, explore the intuitive interface, and see how your survey results can be beautifully visualized and analyzed.
Multiple Options to View Your Survey Results
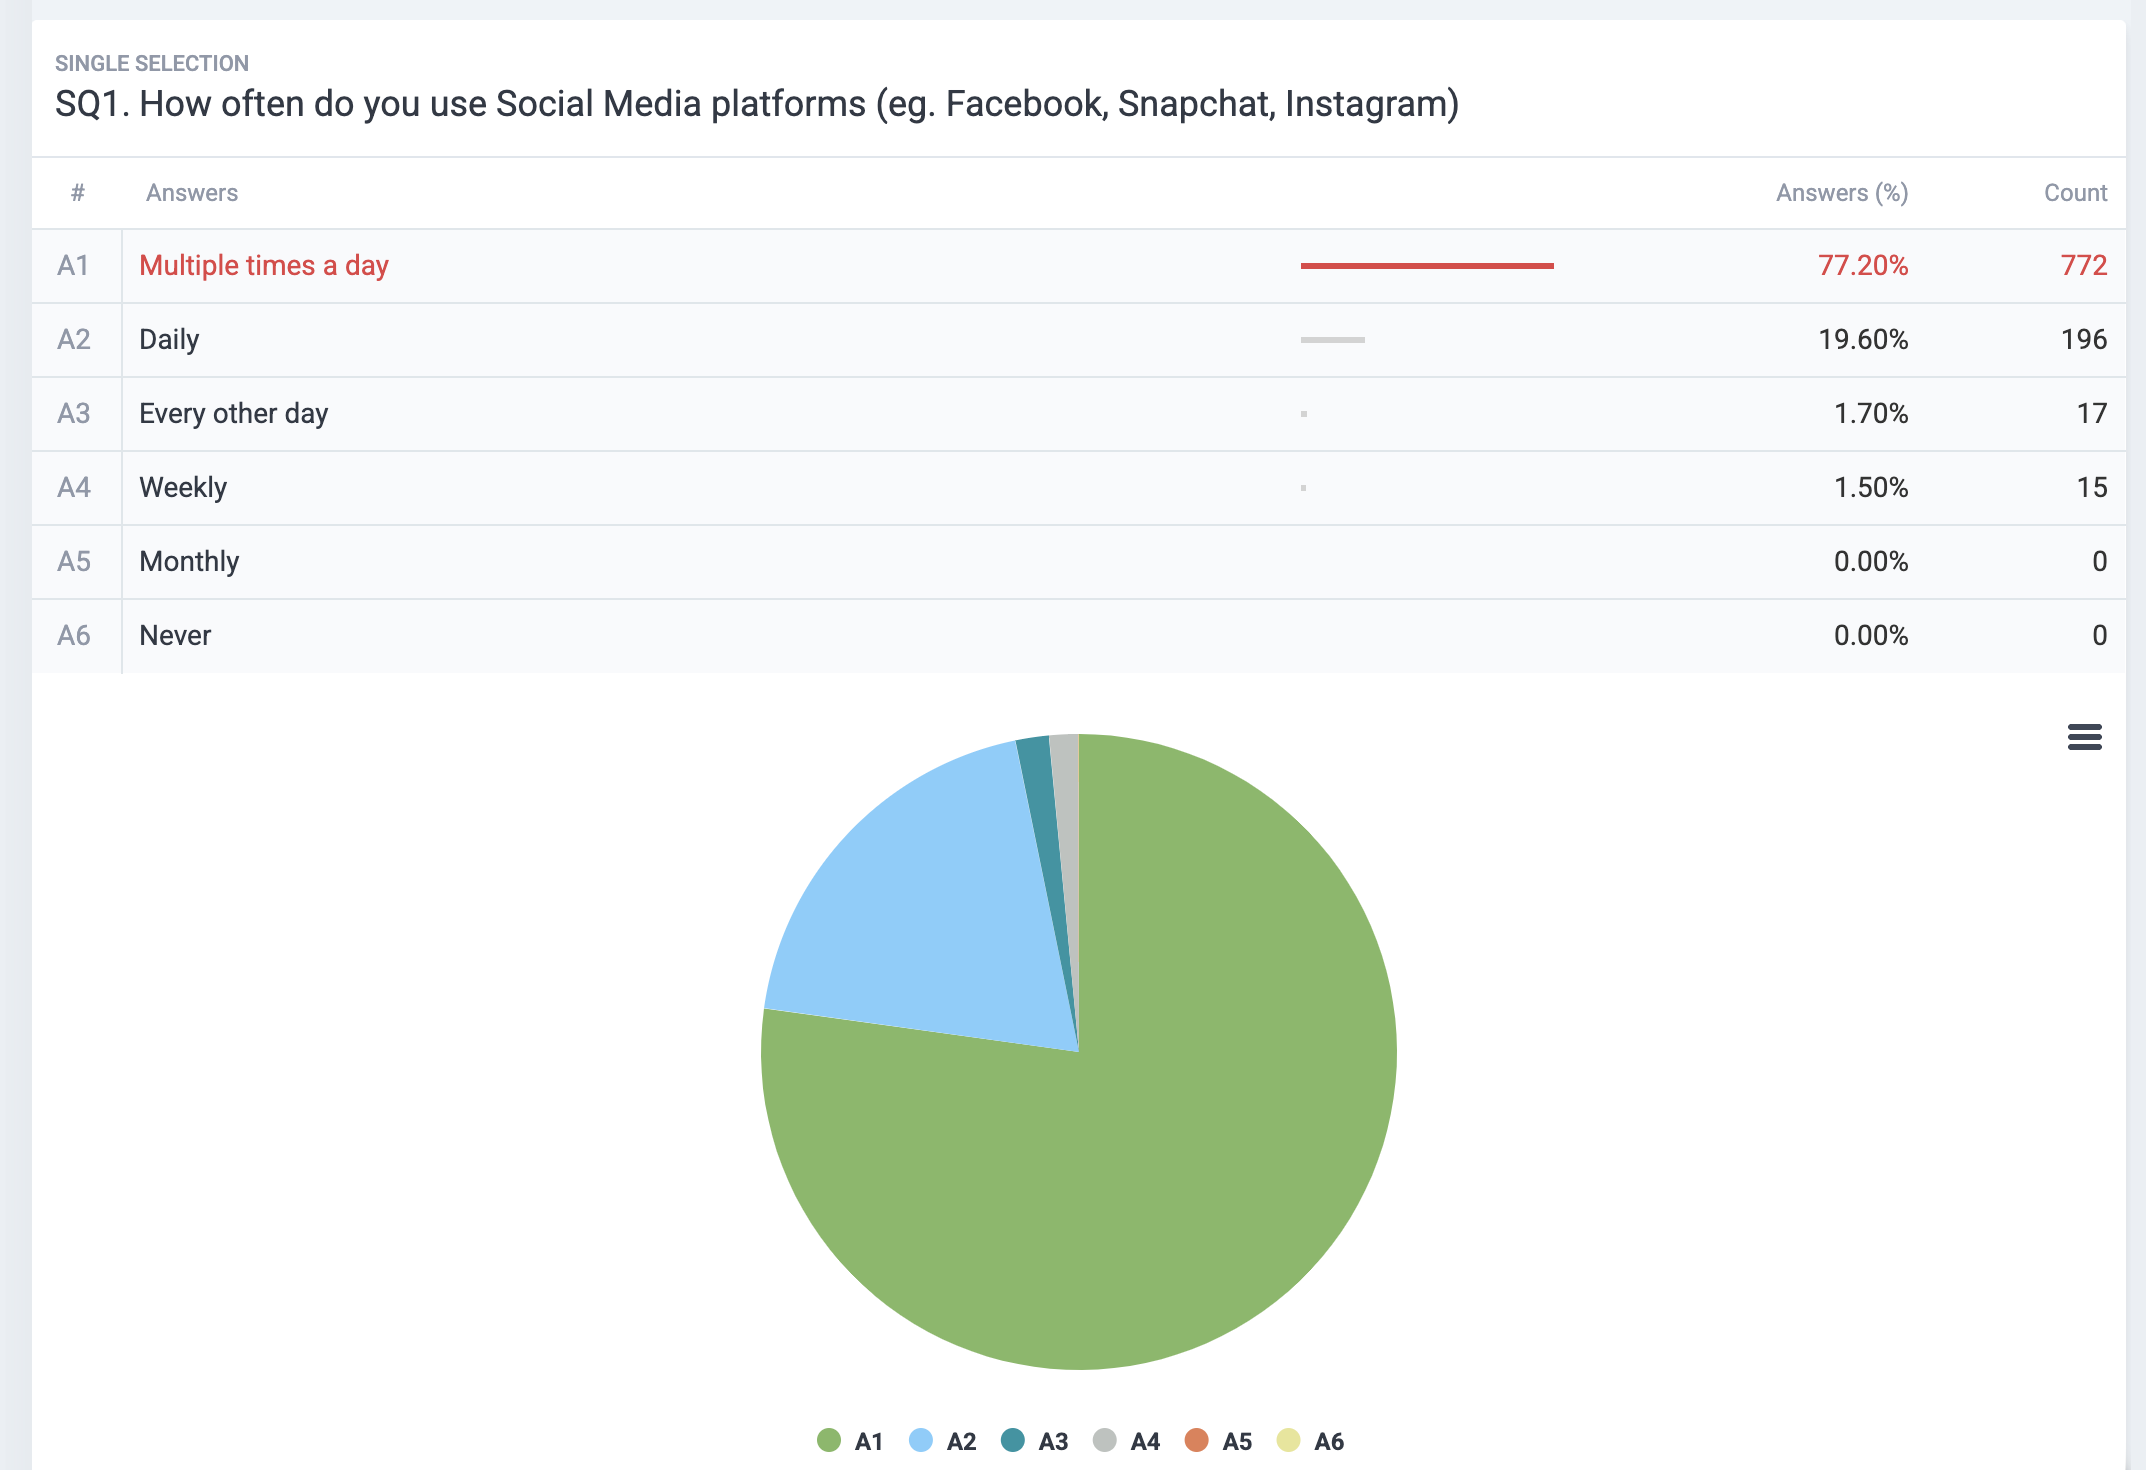
There are several ways to visualize and analyze your survey results.
One option is viewing the data in a simple table format, showing questions, corresponding answers, and the count and percentage of respondents for each answer.
For a more visual representation, you can use color-coded column charts or pie charts, making it easy to quickly understand the proportional distribution of answers.
Targeting Filters: Focus on Specific Subgroups
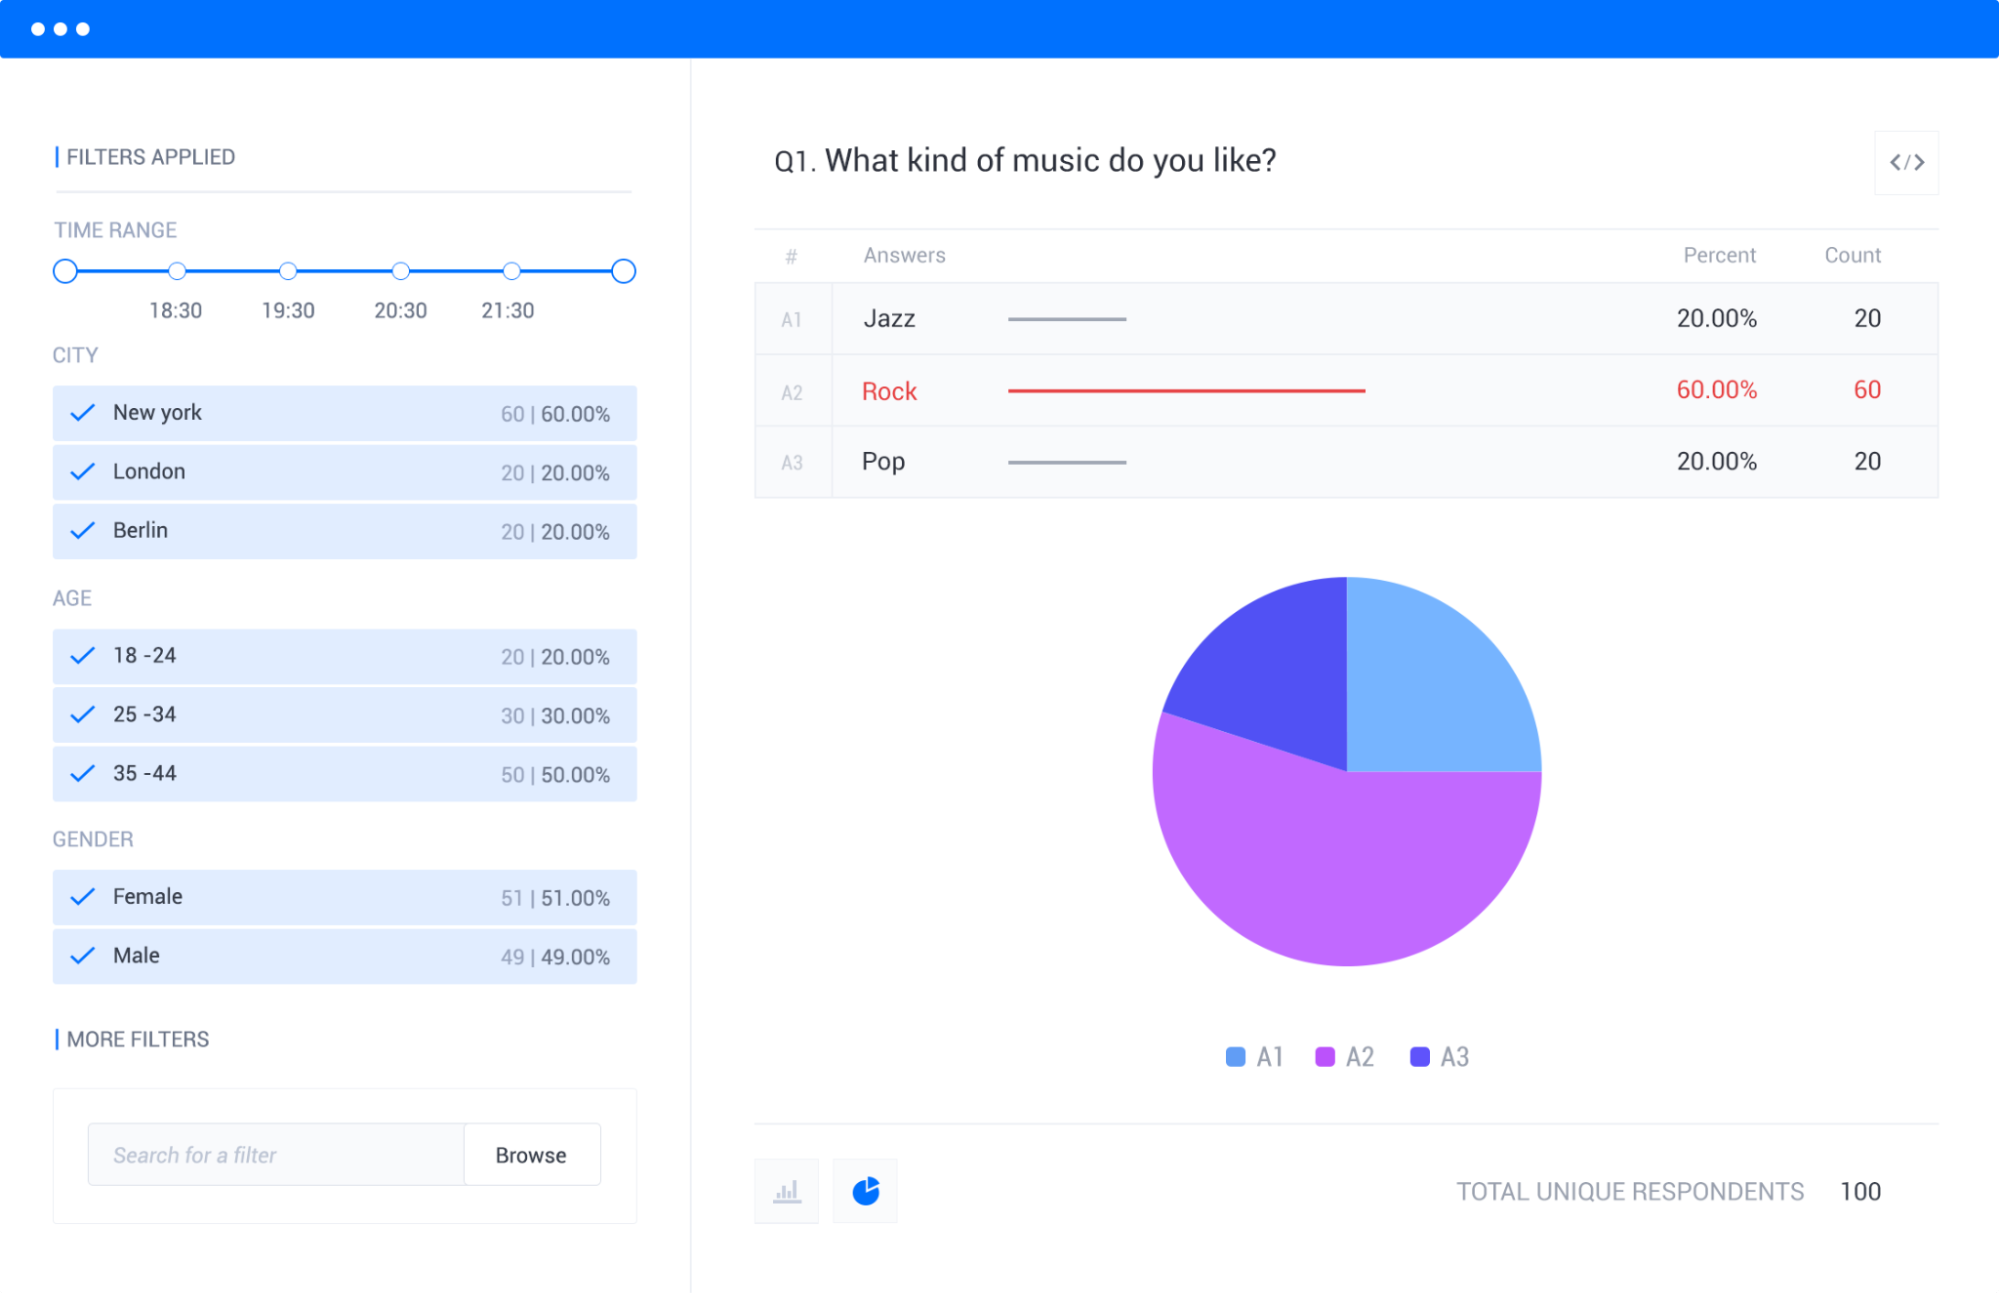
On the left side of the dashboard, you'll see the targeting criteria you've selected.
Simply choose the filters that correspond to the specific subgroups or demographics you want to focus on, and your results will automatically adjust to reflect those criteria.
For instance, say you created an audience that includes four age groups:
- Gen Z (18–28 years old)
- Millennials (29–44 years old)
- Gen X (45–60 years old)
- Baby Boomers (61–79 years old)
If you wanted to dive deeper into the survey data for a specific group, such as Millennials (29–44 years old), you’d simply select that filter on the left-hand side. The results would then dynamically update to showcase only the data relevant to that particular age group.
You could also combine multiple filters, such as “Age” (Millennials), “Gender” (Female), and “City” (New York), and view results tailored to those highly precise demographics.
Response-Based Filtering
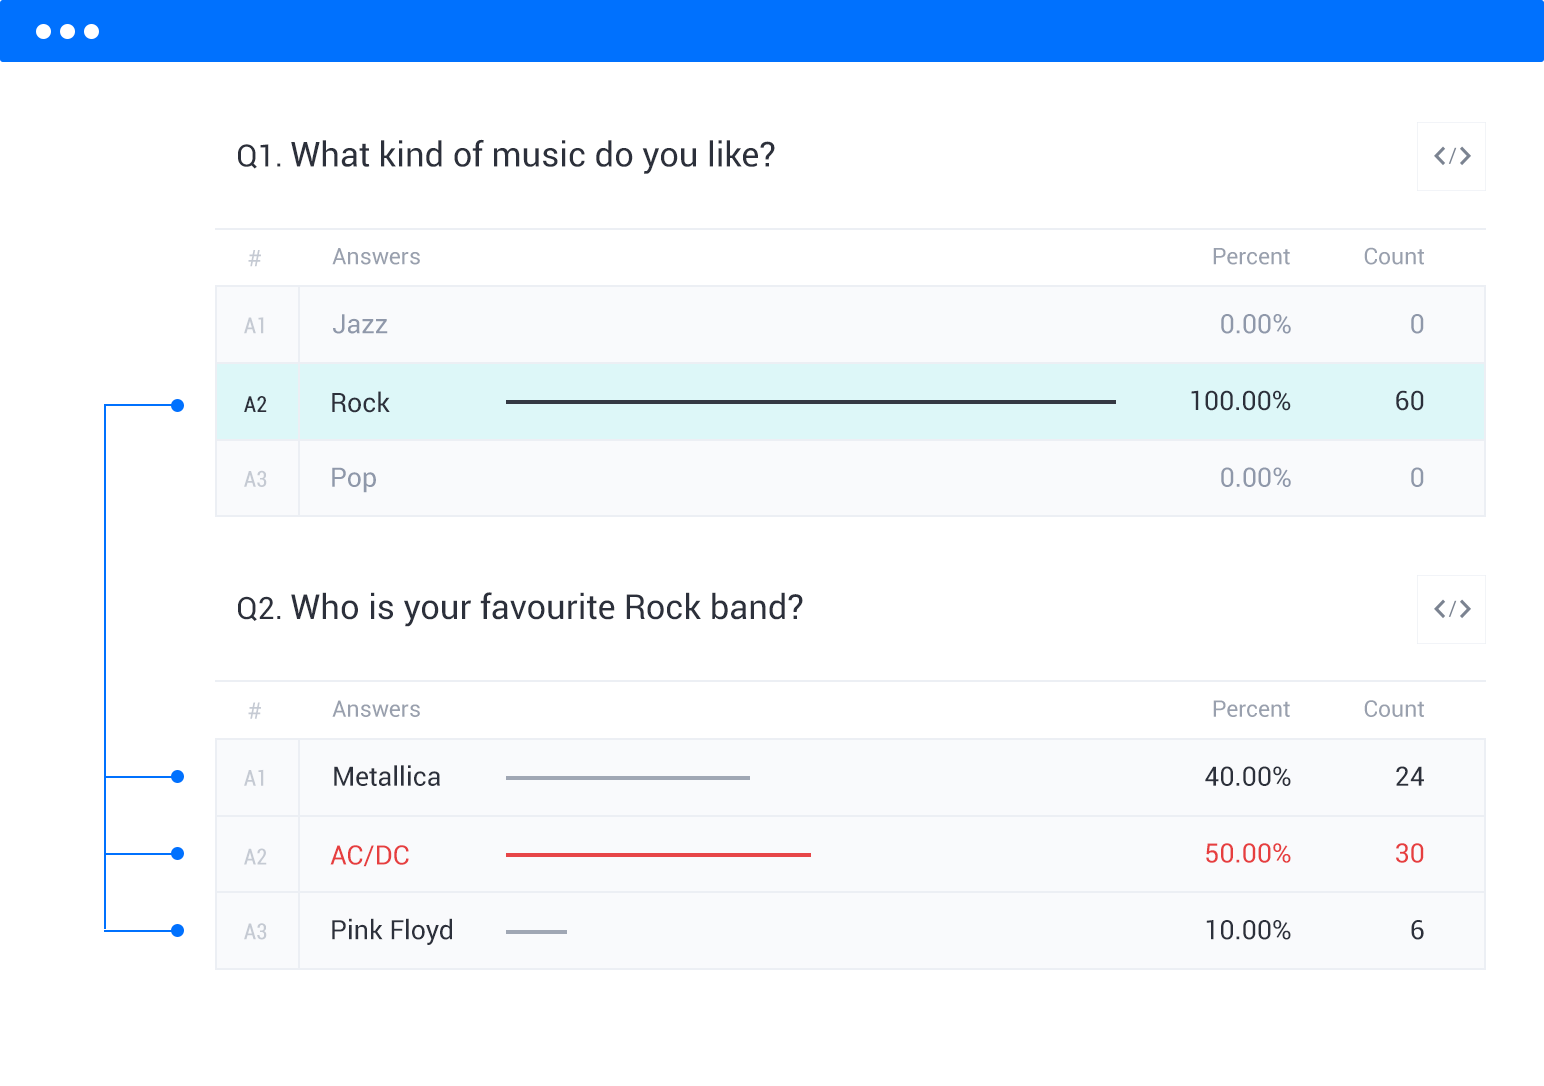
In addition to audience filters, you can also refine your data by specific survey responses.
For example, if your survey asked, "What kind of music do you like?" and you only wanted to analyze responses from those who chose "Rock," you can filter the data to only include those respondents.
Insights Builder: Advanced Data Manipulation & Analysis

Market researchers often spend a significant portion of their day sorting, filtering, and manipulating Excel data to create complex graphs. It's a tedious and time-consuming process.
But what if there was a tool that made this task a breeze? Enter Insights Builder, available on the Elite plan. This powerful tool allows you to effortlessly manipulate, sort, and graph data directly within our platform, saving you time and effort compared to working in Excel.
To show you just how easy it is to work with graphs in Insights Builder, let's look at the survey question, "Which of the following social media platforms do you log into at least once a week?" (see screenshot below).
With Insights Builder, you can quickly manipulate the graph variables to suit your needs. For example, if you want to focus on the responses from males and females, but exclude the "Not Specified" gender category (which only had 3 respondents), simply deselect the "Not Specified" option on the left-hand side, and voila! The graph instantly updates to reflect your changes.
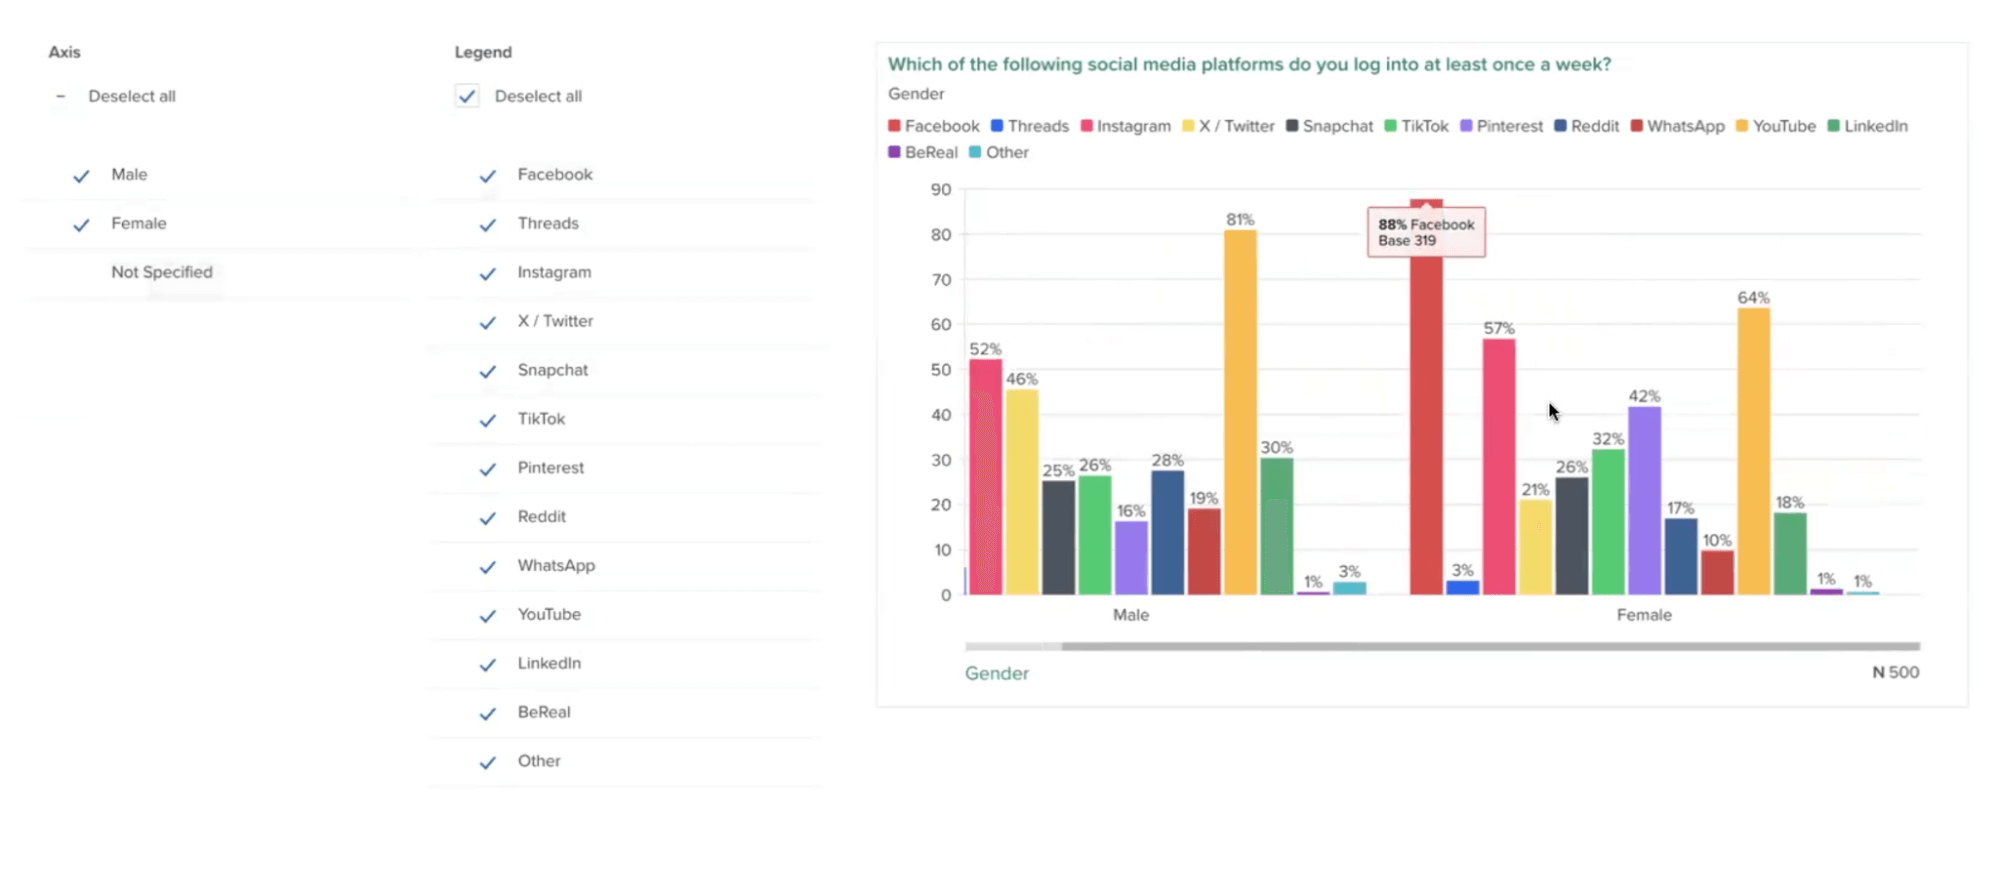
Insights Builder also offers more easily digestible charts (see screenshot below).
For example, let's say you want to analyze the social media usage question by gender. With just a couple of clicks, you can apply the gender filter and see a beautifully clear chart that breaks down the responses by male and female:
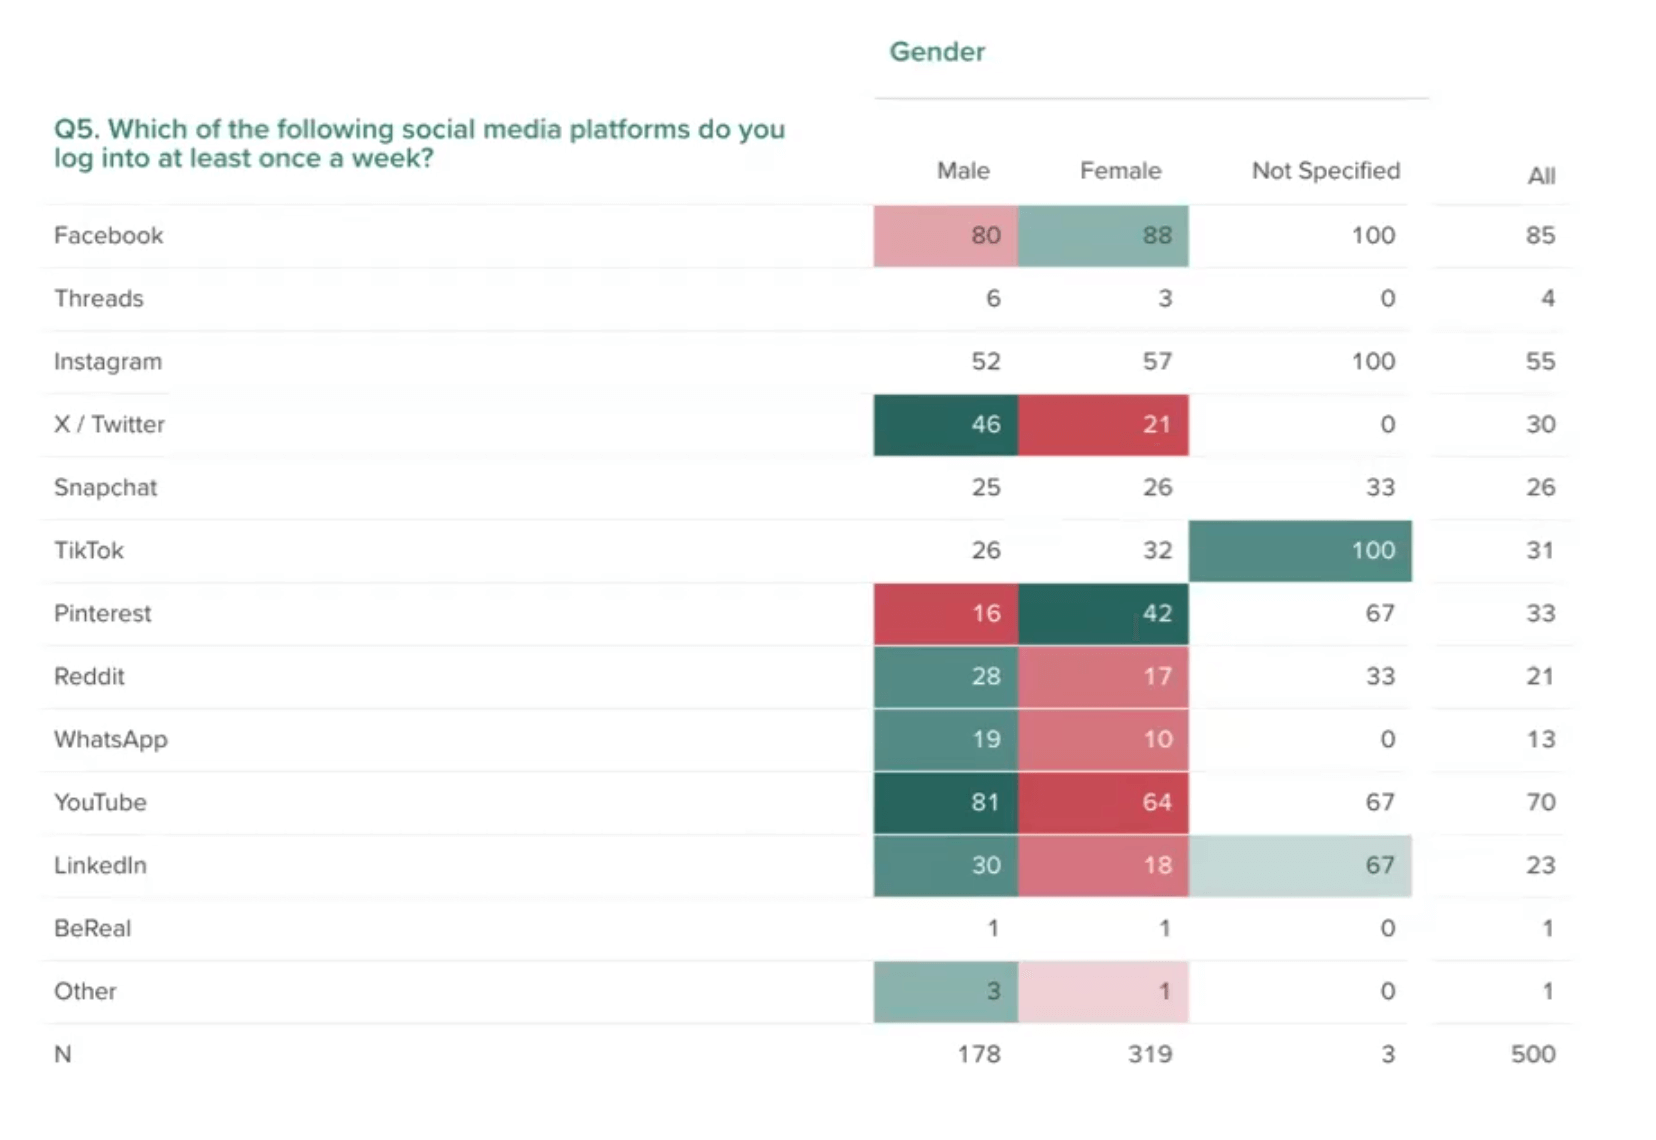
From this chart, you can easily identify that Pinterest, for example, heavily skews towards female users (along with other valuable insights).
If you want to dive deeper into the data, you can turn on stat testing to see which results are statistically significant. The darker the green, the higher the significance.
Plus, if you need to export the image, you can choose to display the results with traditional stat testing, using capital and lowercase letters to indicate significance.
But the customization doesn't stop there. With Insights Builder, you can effortlessly apply your brand's unique color palette to each graph, ensuring consistency and cohesion across all your visualizations. You can even upload your own PowerPoint presentation, and all your graphs will automatically adopt the design elements from your slides.
We’ve just scratched the surface of what’s possible — our dedicated Insights Builder team is here to walk you through the survey results and show you how to leverage the platform to meet your specific needs.
Export the Results (PDF, Excel, Crosstabs, SPSS)
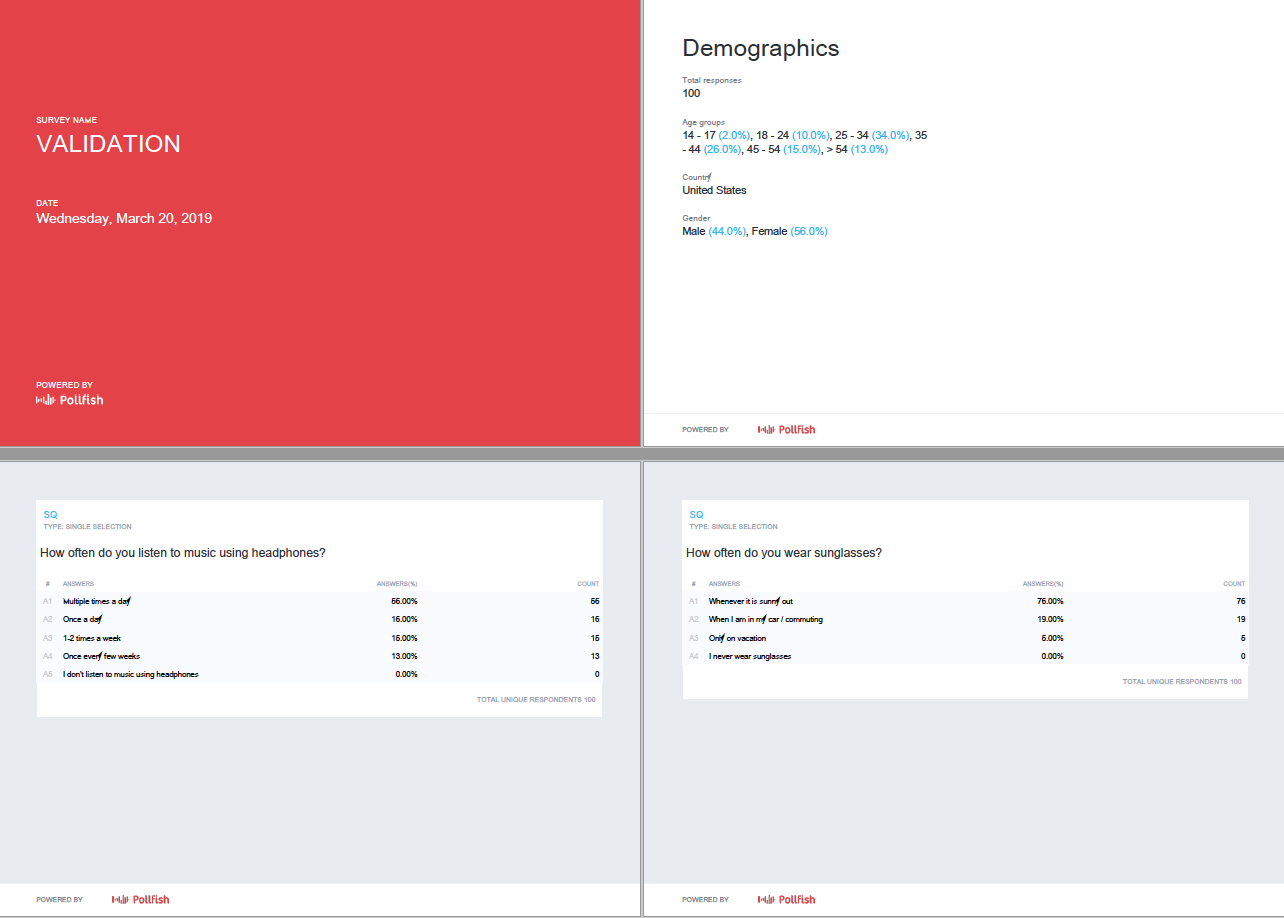
Pollfish offers 4 versatile export options for your survey results, allowing you to analyze and present your data in the format that best suits your needs:
- Excel
- Crosstabs
- SPSS
Visit this comprehensive article to learn more about these four export options and how to make the most of them.
Beyond DIY: Pollfish's Full-Service Solution
As we’ve mentioned, Pollfish offers a user-friendly, DIY platform that lets you easily launch surveys on your own. However, we understand that some projects may require advanced customization or functionality beyond our standard offerings. If you're new to conducting surveys or need guidance on best practices, our full-service option is the perfect solution for you.
With our full-service option, you'll work directly with our Insights team, who will take the time to understand your unique needs, identify the best type of research methods, and guide you through the entire process from start to finish. We act as an extension of your market research team, allowing you to focus on other essential aspects of your work while we manage the survey programming and execution.
Additional Benefits to Using Pollfish
Not only does Pollfish provide a powerful set of features and functionality, but there are also several additional benefits to choosing our platform:
Fast Survey Turnaround Time (Typically From a Few Hours to a Few Days)
A common issue raised by users of other survey platforms is the lengthy wait time for responses.
However, at Pollfish, we have cultivated consumer communities that enable us to deliver results within a few hours to a few days in most cases, setting us apart from our competitors.
The turnaround time for receiving responses varies depending on the target audience. For instance, we recently assisted a client in conducting a survey about Super Bowl commercials and gathered 500 responses within a matter of hours. However, if you’re targeting a niche group (e.g., aerospace engineers with advanced degrees in research facilities), it will take more time to gather responses than a broader audience.
If a quick turnaround is a crucial factor for your project, we encourage you to reach out to us via live chat. Our team will be happy to provide you with an estimated timeline tailored to your specific audience and requirements.
Usage-Based & Transparent Pricing (What You See Is What You Pay)
Before switching to Pollfish, users often encounter three pricing issues with competitors:
- Subscription-based pricing models, which require you to pay a significant amount each month or year, regardless of your actual usage.
- The subscription-based pricing structure also means that adding additional licenses can be costly.
- Lack of transparency, with unexpected extra charges for additional work.
Pollfish addresses these issues with a usage-based pricing model. You only pay for what you actually use, rather than being locked into a subscription. If you expect to conduct a large number of surveys, you can pay in advance and receive a discount. Additionally, you can add an unlimited number of licenses for each account.
Pollfish also provides complete transparency. Before designing your questionnaire, the platform shows the final cost per interview (CPI) for your selected audience.
For example, if the CPI is $1.50 and you need 1,000 respondents, your total cost will be $1,500 (CPI x respondents). There are no hidden fees — what you see is what you pay.
Stellar Customer Support (From Basic Inquiries to Advanced Research Guidance)
When designing surveys to align with your market research objectives, it's natural to have questions along the way. Exceptional customer support is crucial, even more so than with other types of software.
At Pollfish, customer support is one of our greatest strengths. In fact, when people switch to us from competitors, they often cite our superior support as a key reason for their decision.
We offer live 24/7 chat support directly within the Pollfish platform, staffed by real people who understand research, not just chatbots. Whether you're seeking help with simple feature inquiries or need guidance on research best practices and survey design to ensure data reliability, we're here to assist.
Interested in Learning More?
For more information, we invite you to visit our site and create a free account.
We also encourage you to book a demo call with our team, where we can discuss your specific needs and provide personalized recommendations on how to get the most out of Pollfish.
2. Qualtrics
Qualtrics is a market research platform that provides an extensive array of features. Surveys are one of its core strengths, providing users with:
- Ability to reach respondents through various channels like email, social media, websites, and SMS.
- Drag-and-drop interface for creating advanced surveys.
- Different question types and logic.
Beyond surveys, some of Qualtrics' popular use cases include Brand Tracking, Website & App Feedback, Customer Analytics, NPS Software, Pulse Surveys, and more.
For a more detailed comparison between Pollfish and Qualtrics, see our post on the best Qualtrics competitors.
3. Suzy
Suzy is one of the best market research tools on the market, and they offer a range of powerful features and benefits. Here are some of the key advantages of using Suzy for your market research needs:
- Conduct AI-powered surveys quickly and cost-effectively.
- Access a panel of consumers to gather insights, test concepts, and make data-driven decisions.
- Pay per question, rather than per response.
- Receive help from experienced researchers.
For a more detailed comparison between Pollfish and Suzy, see our post on the best Suzy competitors.
4. SurveyMonkey
SurveyMonkey is a widely-used market research tool, with surveys being one of its core features. Consider these main benefits when choosing SurveyMonkey for your market research needs:
- Choose from over 400+ survey templates or create your own survey.
- Use AI to quickly build your survey.
- Employ advanced skip logic and branching.
- Reach respondents both online and offline via email, web links, social media, SMS, website embeds, QR code, and kiosks.
- Schedule recurring surveys.
- Visualize insights via custom dashboard, charts, word clouds, and more.
Focus Groups & Interview Tools (Qualitative Market Research)
So far, we've discussed widely used market research survey tools. In the following segment, we'll explore software that can help your qualitative research efforts, such as facilitating focus groups and conducting interviews.
5. itracks
itracks is one of the best qualitative market research tools on the market. Here are some of the key advantages of using itracks for your market research needs:
- Easily conduct interviews, video focus groups, text groups, and more.
- Participants, Observers, and Moderators each have their own easy to use interface.
- You can easily create subgroups and segmented reporting.
- It integrates with the majority of survey platforms and research panels.
6. FOCUS by MarketResponse
FOCUS by MarketResponse is another great market research tool that makes it easier to run qualitative research via focus groups and interviews. Here are some of its key advantages:
- When conducting panel discussions or interviews, you can highlight notable responses, download them as individual segments, and create a video compilation.
- You can utilize whiteboard, polls, visuals, videos and chats, backroom chat, automated transcription and analysis.
- You can integrate this software with several other survey solutions.
Data Aggregator Tools for Market Research
In the next segment, we'll explore data aggregator tools that offer extensive statistics across various topics. Although the audience targeting might not be as precise as your requirements, when assembling research reports, you may find useful data within these tools that can be incorporated into your presentation (and bolster your arguments).
7. Statista
Statista is one of the most popular data aggregator tools in the market, and can be an excellent addition to your market research efforts.
Here are some of the key advantages of using Statista:
- There are statistics spanning 170 industries and 150+ countries.
- Among the most popular industries for which they offer statistics on include Consumer Goods & FMCG, e-Commerce, Economy & Politics, Energy & Environment, Internet, Technology & Communications, Transportation & Logistics, Tourism & Hospitality, and more.
- Gain insight on revenue metrics, key performance indicators, and much more.
- You can also take advantage of their full-service market research and analytics services.
8. U.S. Census Bureau
The U.S. Census Bureau can be a great tool for conducting market research, and it’s great for large and small businesses. Here are some of its key advantages:
- You get access to a wide array of filters, including geographic, topical, and more. You can choose the appropriate filters to generate tables and maps that align with your research goals
- Certain datasets can be accessed through an API.
- Some of the more popular topics the U.S. Census Bureau covers are Age, Sex, Business, Economy, Education, Emergency Management, Disasters, Employment, Families, Living Arrangements, Housing, Income, and the list goes on.
Social Media Sentiment Tools for Market Research
In the next segment, we'll explore social media sentiment tools that can help you track mentions related to your brand, a competitor, or a specific topic. Anonymity on social media can often lead to more candid and unfiltered feedback compared to traditional qualitative research methods like focus groups or interviews.
9. BrandMentions
BrandMentions is a great platform that can help with market research. You can monitor everything that’s said about your brand (e.g., via mentions, hashtags, etc.) on the social media channels that matter, and easily identify overall sentiment. Also, besides brand monitoring, some of its key features and use cases include:
- Reputation Management
- Competitor Spying
- Media Monitoring
- Business Intelligence
10. Forsta
For this section, we will focus solely on the social listening capabilities of Forsta.
However, note that Forsta is an all-around market and consumer insights software that offers a wide array of other features beneficial to market researchers (including surveys, online focus groups, and more).
Here are some of Forsta’s key social listening advantages:
- Examine reviews from various platforms (e.g., Google, Facebook, and Yelp)
- Input your own social data for comprehensive text analysis.
- Easily track posts that refer to your brand (or any other topic) on social networks, blogs, forums, video platforms, and news outlets.
- Make sense of the data via powerful analytics tools.
Data Visualization Tools for Market Research
In the next segment, we’ll explore data visualization tools that can help you take raw, complex market research data, and turn it into more easily understandable visuals (e.g., graphs, charts, etc.), so it’s easier to identify the answers you need.
11. Tableau
Tableau is a widely used data visualization platform that simplifies the process of creating advanced graphs and other visualizations from your market research data. Here are some of its key advantages:
- You can easily create visualizations (e.g., charts, graphs, maps, etc.) via drag and drop functionality, and you don’t need to be a coder.
- You can perform advanced data analysis via forecasting, correlation detection, and much more.
- Tableau easily integrates with spreadsheets and a wide array of software.
12. Google Charts
While Google Charts may not be as feature-rich as Tableau, it is a free market research tool that can still provide sufficient functionality to meet your data visualization needs. Here are some of its key advantages:
- You can create various types of charts, from simple scatter plots to advanced hierarchical treemaps, and more.
- You can customize the charts to match your brand’s design, and there’s a great user experience.
- You can integrate Google Charts with a wide range of tools, so it integrates with your workflow.
- It’s completely free to use.
Note that Google also offers other free tools that can help with market research, such as Google Trends (which lets you analyze various market trends in real-time).
Competitor Research Tools for Market Research
In the next segment, we’ll explore software that can help you analyze competitors’ marketing campaigns (e.g., what are their best performing social media posts, blog posts, and so on).
13. BuzzSumo
BuzzSumo is a great competitor research tool that offers several advantages:
- Determine which of your competitors' content pieces have received the highest number of shares on social media platforms (e.g., most shares on Facebook, Reddit, X/Twitter, etc.), providing valuable insights into what type of content resonates with your target market.
- Create alerts for each time your competitors publish on social media or publish a blog post (e.g., this can be useful to see which features they are releasing, how they’re positioning their product, etc.), which may spark new ideas for you to test.
14. Ubersuggest
While Ubersuggest offers various features (which we’ll cover below), one of its primary applications is conducting organic keyword research for market analysis. For instance, if you are contemplating the launch of a new product line (e.g., such as red running shoes), you can input that phrase into Ubersuggest.
The tool will then provide you with valuable insights, including the average monthly search volume for that keyword on Google, and an assessment of the competitors that are ranking for that phrase (e.g., how strong is their site profile, how does your website compare, etc.)
Some of Ubersuggest’s other features include:
- Competitive analysis of similar websites (e.g., enter your competitor’s domains, and explore which SEO keywords they are ranking for on Google).
- Keyword visualization (e.g., enter a seed keyword and receive suggestions for related phrases, which you can explore via visually appealing graphics).
Interested in Learning More About Pollfish?
For more information, we invite you to visit our site and create a free account.
We also encourage you to book a demo call with our team, where we can discuss your specific needs and provide personalized recommendations on how to get the most out of Pollfish.
Launching surveys across multiple countries? We just made it a whole lot easier!
Global insights are now within easier reach!
Gone are the days of creating separate surveys for each country you want to target. Our new multi-country targeting feature is now available!
With this update, you can:
- Reach multiple countries with a single survey
- Set different demographic filters per country
- Manage everything in a single, streamlined workflow
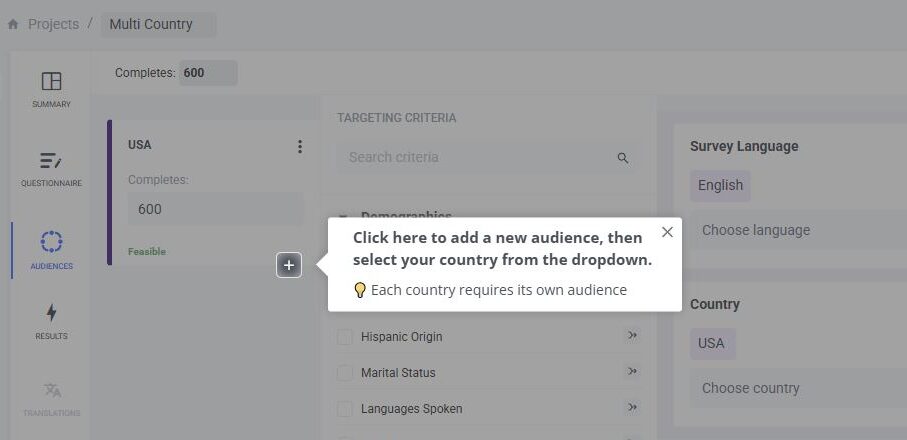
How It Works
Whilst building your survey, click on the audience menu sidebar.
1️⃣ Select your first country in the audience panel
2️⃣ Click “+” to add another audience for each new country you want to include in your study
3️⃣ Customize each audience with the number of completes and country-specific demographics you need.
(Or if your demographics are the same for each country, you can just use the "duplicate audience" button to add new countries to your study)
Global Results, Local Insights
Running a multi-country survey gives you a broad view of global trends - but sometimes, the real value is in the differences between regions. With Pollfish, you don't need a data degree to discover deep insights.
Want to see how UK consumers compare to those in the US? Or how brand perceptions differ between Germany and France? Simply filter your survey results by country, as well as other demographics, to get the insights you need.
Are you ready to explore global insights?
👉 Start running multi-country surveys today! 👈