
How to Conduct Retail Market Research Like a Pro
How to Conduct Retail Market Research Like a Pro
 Whether you operate a brick-and-mortar, a click-and-mortar, or a pure-play brand, you need to conduct retail market research, that is, market research specific to the retail sector.
That is because, in today’s age of mass information circulating at speed, we exist in a market jungle, as market trends oscillate and customer expectations sway, while your competitors are becoming more adaptable.
To stay ahead and survive this market jungle, you need to get acclimated to performing the correct form of market research.
Let’s learn how to conduct market research for the retail sector.
The Makeup of Market Research
Market research, as we’ve covered aplenty, is a wide umbrella term that pertains to studying several facets of a particular market to gauge the profitability and success of your product or service.
This includes gathering information on the following:
- Trends in the sector, vertical and niche
- Your target market
- Segmentation within your target market
- Your competitors (tactics, launches, performance, etc.)
- The sector at large

It is made up of two sets of research: primary and secondary. The former deals with gathering research that you, as a business, conduct yourself. The latter involves consulting with information that has already been researched and is publicly available (not always for free).
Primary research requires using the following methods to collect information:
- Surveys on your target market and closely situated markets
- Interviews (in-person or over the phone)
- Consumer reviews
- Focus groups
- Sales records
- Employee feedback
Secondary research has a more encompassing set of documents and sources:
- Trends sites (Google Trends, Google Alerts)
- Keyword searching and SEO platforms
- Research agencies
- Statistics sites
- Market research sites
- Competitor sites
- Case studies
Techniques Particular to Retail Research

The above provides fundamental information about performing market research — in a general, all-purpose sense.
Since you would need to turn to both primary and secondary data throughout the market research process, you should be able to detect and distinguish these resource types, whenever you come upon them.
Above all, you need to know which exact platforms, websites and tools to use for collating information on the sector of retail. In market research, you move from the general to the specific fairly quickly, and you’ll need information specific to your vertical.
This is especially important if you serve a niche market.
Primary research techniques speak for themselves, as you would need to gather original insights and data from those mentioned above. Secondary sources particular to the retail sector, on the other hand, need to be laid out.
Secondary Research Sources for Retail
Here are a few secondary sources for market research on the retail vertical. Note that many of these platforms aren’t free, but their intel is indispensable.
- For understanding the retail industry: MarketResearch.com, specifically the Retailing Market Research Reports & Industry Analysis page, which links to a wide variety of internal research reports. These reports cover the many sub-sectors of the sweeping retail vertical, such as the clothing market, department stores and other related topics such as market analytics.
- For understanding customer personas: MakeMyPersona You should constantly be up to date on your buyer personas. This free tool from HubSpot generates personas; all you have to do is answer some questions about your ideal customers. The tool then creates a detailed document on your target market.
- For economic data in the retail sector: Business Dynamics Statistics (BDS) A division of the US Census Bureau, this program provides economic data on employment, job expansions/ contractions, number of establishments, number of startups and more. This platform supplies annual measures on different business subsectors.
- For competitor analysis: County Business Patterns (CBP) Another division of the US Census Bureau, this program presents subnational economic data based on various retail industries. This includes the number of establishments, employment, annual payroll and more to analyze economic changes over time.
- For understanding your customer base: Facebook Audience Insights If your business has a Facebook business page, this tool will provide demographic information, along with some behavioral insights into your followers. It shows you their age, location, income, employment type, spending behaviors and even lifestyle (Facebook’s category).
- For multipurpose research: Think with Google An all-in-one market research platform providing guides, data reports, infographics and content to reap insights on the retail industry and your target market. You can use specific tools to grow your store, find your audience and stay up to date with the latest research within your particular retail subsector.
- For keyword research, SEO and competitor analysis: SEMrush This platform offers over 30 tools to analyze 3.7 billion keywords and 4 trillion backlinks. It allows retailers to find new organic competitors, as well as those in Google AdWords and Bing ads, to analyze their competitors’ budgets, strategies, ad copy, display ads and keywords.
Wrapping Things Up
Retail is one of the most expansive verticals, as it can include virtually any business that sells products to consumers. It requires both primary and secondary research methods for a thorough analysis and interpretation.
Secondary research for the retail sector involves a distinct set of secondary sources for quality research campaigns. A successful research endeavor will allow you to provide meaningful products and experiences for your customers, communicate with them more productively and improve your standing within your submarket.
Although the above examples of secondary research are invaluable, there are many other online tools for your disposal. Social media, for example, is excellent for market research, as it can connect you with your customers to get their perspectives firsthand, along with their data.
Frequently asked questions
What is retail market research?
Retail market research is the process of gathering information about target customers and markets to determine or improve upon the success of a retail venture.
What types of primary research are useful in retail market research?
The most relevant types of primary research for the retail sector are surveys, consumer reviews, focus groups, feedback from employees, and sales reports.
How is secondary research performed?
Secondary research is performed by gathering and reviewing previously published information in order to gain insights to support a market research project.
How are buyer personas used in retail market research?
Buyer personas are a good way to define and understand the various customer segments that are likely to purchase from your retail store.
What information can Facebook Audience Insights provide about your retail business?
A shop’s Facebook business page can provide a wealth of information about its followers, including age, location, employment, income, spending behaviors, and lifestyle preferences.

Market Research for Branding: How Insights Help Your Brand-Building
Market Research for Branding: How Insights Help Your Brand-Building
For most consumer products it’s easy to think of a big-name brand: from smartphones, to ice cream, to sneakers. But such brands didn’t become well-known and successful overnight. Each one has put countless hours and dollars into identifying the right message for their audience.
And how did they work out what their audience wanted to see and hear? Through market research.
Market research and brand-building go hand in hand. Together, they allow you to tap into the mindset of your target audience and shape your product messaging to fit its needs and desires. So let’s take a closer look at how your brand can be strengthened by effective market research.
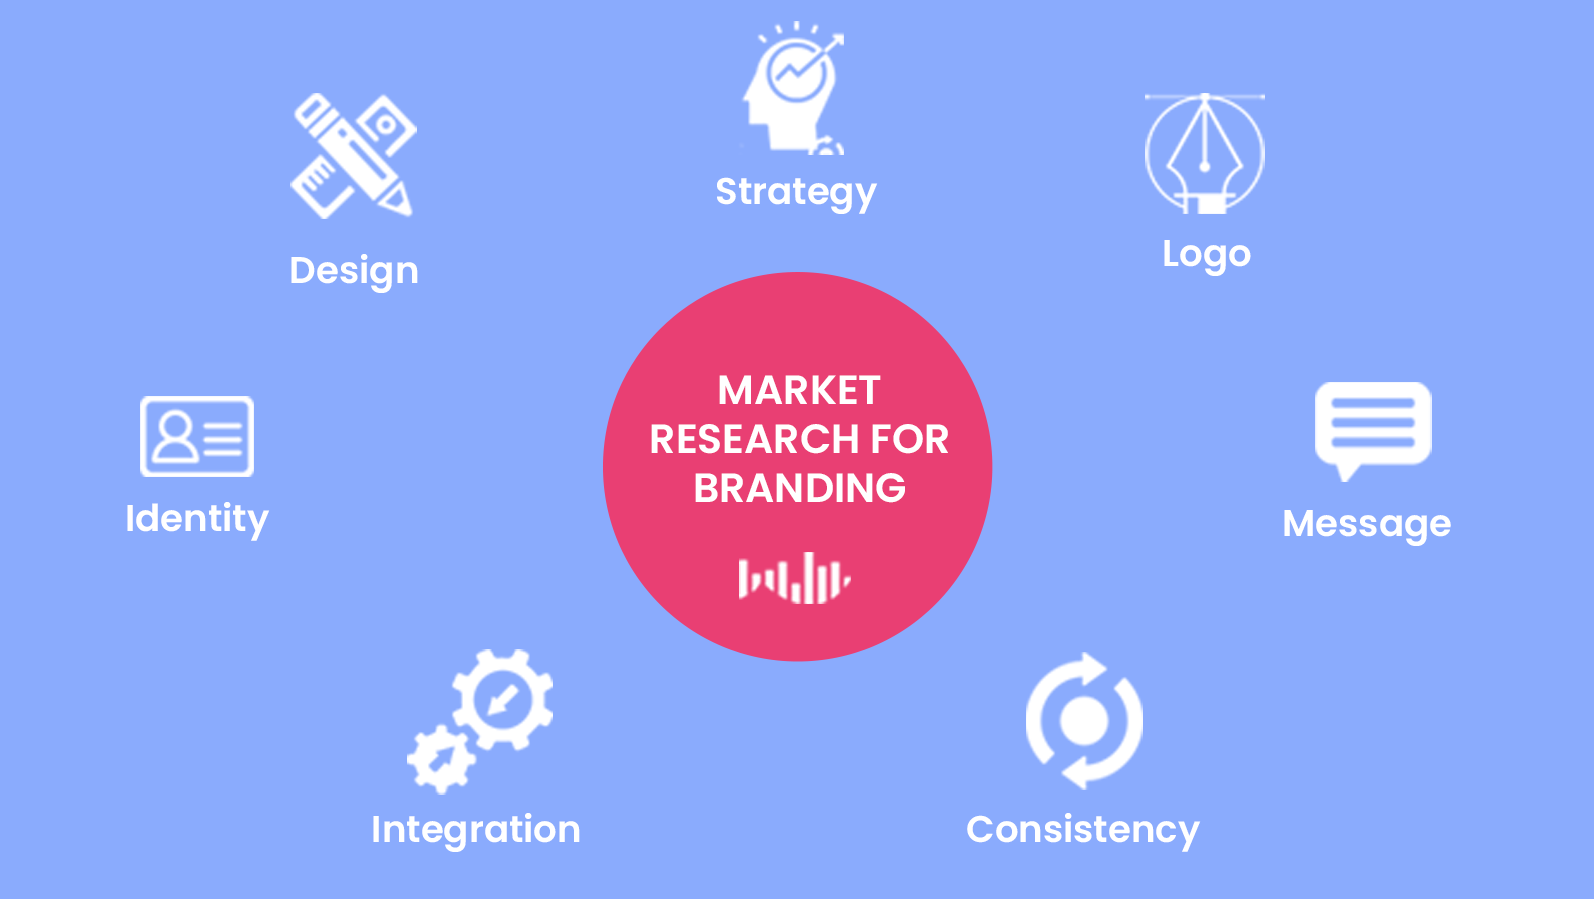
Firstly, What is Branding?
Building a brand is about building a reputation and increasing recognition for your company, establishing a set of values and unique identifiers. Many people hear the word “brand” and they think of global conglomerates like Nike, Apple, or Coca-Cola – but smaller businesses can (and should) also develop a strong identity that resonates with their prospects and customers.
Overall, branding goes beyond what you do and pushes you into the realms of why you do it. A brand won’t rely on their features and benefits, but they’ll tap into the purpose behind what they do and connect this purpose with the aspirations of their target audience.
Before You Start Branding: Establish a Product Market Fit
So you’ve just created a new product, you’ve put all your energy and enthusiasm into it, and you’re convinced of its merits – you may be thinking that now is the time to start building your brand. We need an awesome logo, the perfect design for a website, evocative ads, etc.
But hold your horses: you’ve missed out a step.
Before you start pouring money into a branding operation, you need to check if there’s a product-market fit. What do we mean by this? Well, it means making sure that there is an auspicious market for your product or service, that there is a gap it will fill and that consumers will be willing to buy it.
Branding market research is crucial to establishing a product-market fit, so let’s take a look at how you would go about this.
- Secondary research: Start your market research with an overview of secondary sources. For example, if you’re launching a family budgeting app – check out industry publications like Fintech Magazine, personal finance blogs like MoneyCrashers, and competitor websites. Get a general feel for the market landscape and existing tools.
- Primary research: The next stage is to carry out your own primary research, through channels such as focus groups, interviews, and online surveys. This will allow you to dig deeper into the minds of your potential customers and determine whether they would be open to trying your product.
Once you’ve conducted your research, you should have enough data to guide your next move; if you’ve identified a market for your product, you can proceed to generate sales (and then building a brand) with confidence. On the other hand, you may need to go back to the drawing board to tweak your offer because you can’t validate that consumers are looking for it.
Why me? Identifying Your Unique Value Proposition
As the logo is the most obvious visual aspect of a brand, you might think that this is the best place to start your brand-building. Crack the logo and everything else will fall into place, right?
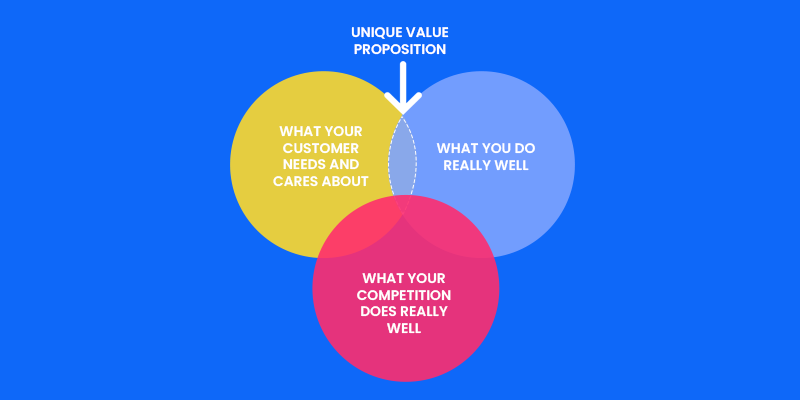
But there’s another component of branding that should underpin all the rest of your branding efforts and help you create a strong, consistent message. That’s your unique value proposition (UVP). This is more than a simple phrase or catchy statement. It usually consists of a headline, a longer subheadline or paragraph, 2-3 benefits/features, and a key visual.
The UPV captures what makes your brand uniquely desirable, and explains why an audience would choose to spend their hard-earned money on what you have to offer. Once again, market research comes into play here. For example, by using an online survey, you can test different elements of your UPV, seeing which parts resonate with your audience and which don’t.
With Pollfish, you can design an effective mobile survey to find out just what your target audience thinks of your UVP as you develop it. We provide access to millions of participants in over 160 countries globally, so you can aim your survey at a very specific demographic.
Branding Market Research and Your Strategy
Whether you’re building a brand from the ground up or trying to rejuvenate an existing brand, market research is your best friend. By regularly checking your audience’s perception of your brand, you’ll be saving money on misguided marketing efforts, while also discovering segments that you never thought would be interested in your product.
Here are three ways that market research can help you achieve a strong, healthy brand:
- Test your logo and messaging: Find out what potential customers really think of your design from the logo, to visual website content, to email fonts. No element is too small to run by your audience. Even a slight adjustment to the color of your logo could create a different emotional impact.
- Discover brand awareness levels: One measure of your brand’s success is how readily it is recognized by consumers and correctly associated with your product or service. Carrying out regular brand awareness surveys can help you quantify how familiar consumers are with your brand compared with your competitors’.
- Uncover weaknesses in your branding: Even the strongest brand has room for improvement, and conducting ongoing market research can help you identify any cracks before they grow bigger and more difficult to fix. For example, a Net Promoter Score survey can give you a heads-up about the satisfaction levels of your all-important existing customers.


Discover New Opportunities
Are you sure you know who your audience is? Your brand might be a favorite with female gamer college-students or vegan male gym-enthusiasts, but there could be a whole new segment out there waiting to discover you.
Effective market research makes it possible for you to identify these growth areas and take your brand to more consumers who will love you.
Frequently asked questions
How is market research used to support brand-building?
A company’s brand can be strengthened through market research by gaining a better understanding of the target audience’s needs and preferences, thus leading to the creation of more effective product messaging.
What is branding?
Branding is a marketing technique used by companies to create a name or design concept that identifies that company. A strong brand identity helps distinguish a company from its competitors and helps create a lasting impression of the company.
What is product-market fit?
A product-market fit is a process of determining whether there is a viable market for a company’s product or service.
What is primary research?
In a market research project, primary research is the process of collecting information about your target market from first-hand sources, such as surveys, focus groups, and research panels.
What is a unique value proposition?
A brand’s unique value proposition (UPV) describes the value that a brand has to its target audience. It explains why an audience should purchase a product or service and differentiates the brand from its competitors.

How to Conduct Ecommerce Market Research Like a Pro
How to Conduct Ecommerce Market Research Like a Pro
Whether you’re setting up an ecommerce business from scratch or planning to launch a new line of products in your online store, market research is a crucial starting point.
In this article, we review key ecommerce market research methods that will help you build an in-depth understanding of your target audience and secure success in the competitive world of online shopping.
Discover Key Industry Players and Trends
When you’ve got what seems like a winning idea for an ecommerce business, it’s important to test the viability of the idea by reviewing the market landscape in your vertical or niche.
Your first step should be to use secondary market research methods to check there’s a need your business can fulfill. Accessing public databases, journals, and industry reports will help you understand more about the current state of the market you hope to enter. You’ll also want to research your main competitors and collect data you can analyze to determine what makes them so successful.
Another option is to examine the market trends surrounding your business idea, either manually or using a tool such as Google Trends. By uncovering changes in search demand for relevant keywords, you’ll be able to see whether your niche is a passing fad or a steadily rising trend.
So, let’s say you want to start a business selling artisan chocolate online – you might find that “organic chocolate” and “ethical chocolate” are trending up in your market. Not only is this a good sign that your carefully crafted treats have a future online, but you can also use that data to adjust your business proposition and focus on its sustainable credentials.
Conduct Keyword Research to Get the Full Picture
Keyword research is a good place to begin getting a basic understanding of your audience. Although later, you’ll want to move on to explore your target market and ideal customer in more depth, possibly using an online survey.
Well-known and widely-used keyword planner tools include the Google Keyword Planner, SEMrush and a slew of others. Another simple method for keyword research is to run a query on a search engine like Google, then peruse the SERP (search engine results page).

For example, let’s say you sell artisan chocolates; a relevant term would be “artisan chocolate.” When you run the query, scroll to the bottom of the SERP and take a look at the list of related keywords that consumers have searched. This in itself will help you generate new keyword ideas.
For our “artisan chocolate” keyword we might find: “artisan chocolate gift box”, “artisan chocolate near me” and the names of some well-known artisan chocolatiers. The artisan chocolatiers you find are important in this example, as they represent the other purveyors of this product in the market. As such, it allows you to understand your competitors.
You can also use these to begin developing a very broad outline of your target audience.
For example, “artisan chocolate near me” may suggest that consumers are looking for a local shop to find luxury chocolates. What are some ways you could create that local feel despite being a pure player (an ecommerce- only business).
Establish Your Ideal Customer Profile

Once you’ve carried out your secondary research and you’re confident there’s a market for your ecommerce products, you can move on to develop a detailed profile of your ideal customer. This stage is focused on primary market research methods, such as research panels, focus groups, interviews, and online surveys. But which method should you choose for ecommerce market research?
Research panels have become significantly more time and cost-effective since you can conduct them online. However, they still have their share of setbacks. Using the same panelists’ time and again can result in “panel fatigue”, where participants become bored and don’t put the same care into their answers. In addition, professional panelists – attracted by the financial incentives – can try to provide the “right” answers so they’ll be asked to participate again, a recipe for skewed results.
Online surveys, on the other hand, can provide much more authentic, reliable insights into your target audience. Pollfish uses an innovative organic sampling method, where in-app surveys collect data from respondents in their natural environment. Participants opt in to take the surveys and are rewarded by bonus points or privileges within the app itself.
With “m-commerce” ( mobile device shopping) predicted to reach 45% of the U.S. ecommerce market by the end of 2020, market research focused on active app users has a major advantage for ecommerce businesses. You can find out more about your audience in the very environment where they may be ordering your goods, for example. This can be done by A/B testing mobile content and interfaces, along with choosing a survey platform that is distributed across publisher apps.
Review and Monitor Social Media Conversations
Social media listening is another important part of ecommerce market research, and it can combine secondary and primary research techniques. Using social media, you can “visit” the places where your potential customers are meeting online and discover more about their wants, needs, and pain points.
An automated social listening tool will allow you to gather quantitative data on key trends and topics related to your business idea from the major social media platforms. However, it’s also worth manually reviewing groups, pages, and threads involving your target audience to gain qualitative insights. One advantage of this is that you can learn the “language” of your audience and then reflect this in your messaging.
To return to our artisan chocolate example, you might review groups related to chocolate enthusiasts, home-bakers, or sustainable living. You could then record common concerns you find there and run a survey to identify what would entice your audience the most when buying chocolate online.
Before you let these insights direct your go-to-market strategy, you can test them for their broader applicability. For instance, Pollfish allows you to design surveys with different types of questions, so you could take the following statements…
- “I know where the chocolate is made.”
- “The cocoa is Fair Trade and organic.”
- “The chocolates are hand-made in small batches.”
- “The chocolate includes the highest quality ingredients.”
…and ask respondents to rank them in order of importance, select one or more answers, or select “Other” and type their own statement.
Run Analytics on Your Ecommerce Site
Now that you’ve completed your first stage of market research, determined that there is a market for your business idea, gained insight into your target audience – and now your ecommerce site is up-and-running. Time to sit back, relax, and watch the profits come in? Not yet. This is a crucial moment to continue your market research, augmented by the real data on sales, site traffic, product feedback, and more that should now be flooding in.
You should have analytics tools (e.g. Google Analytics) set up on your ecommerce site so that you can build up a thorough picture of how site visitors and customers are behaving. You can then analyze this data in order to keep improving your business.
For example, if you recognize a high level of cart abandonment, perhaps you need to optimize your checkout flow and reduce the number of steps. Or you might notice a pattern in reviews where the customer complains they weren’t expecting their chocolates to contain alcohol; that points to the need for greater clarity in your product descriptions.
An ongoing cycle of research, testing, and action will make your ecommerce site an effective base for your business and ensure it’s a pleasant shopping experience for your customers.
Beating the Giants of Ecommerce With Deep Research
Ecommerce is a landscape dominated by giants (we all know who we’re talking about), but that doesn’t mean you’re going to get stepped on. Once you have the expertise in your niche, you can provide intrigue around your product and thus, high demand for it. So find your target audience, convince them of your unique value, and they’ll keep coming back for more.
Frequently asked questions
What is ecommerce market research?
Ecommerce market research is the process of collecting information about the target customers and markets of an ecommerce business or the ecommerce sector in general.
How can secondary research help improve an ecommerce business?
Secondary market research can help a business understand the current state of the market help the business understand whether or not they can compete. This information can also help the business understand what makes other ecommerce businesses successful in similar verticals.
How can keyword research help guide ecommerce market research?
Keyword research can give an ecommerce business a better idea of the demand for their products or service. A higher search volume is likely to indicate an increased demand for a particular product or service.
What is a customer profile?
Customer profiles are detailed descriptions of the various market segments that may purchase a company’s products or services. Customer profiles are created using information from primary research, such as surveys, research panels, focus groups, and interviews.
How can website analytics help improve an ecommerce business?
Monitoring a website using an analytics tool such as Google Analytics, can help a business understand how users behave as they move through a website. By identifying and fixing potential problems, the company can continually improve their ecommerce business.

Mastering the Different Types of Consumer Surveys
Mastering the Different Types of Consumer Surveys

Consumer surveys are critical tools for sharpening your market research efforts, but they go far beyond that. They also help inform your advertising, marketing, product and sales strategies — they’re that powerful.
However, choosing the right survey for your needs may prove to be difficult, as there aren’t merely many different insights your brand may target, but there are also so many survey types to choose from.
We’ve covered the three main types of survey research methods. These methods are mainly centered on the frequency of survey distribution, while some of them include thematically-oriented sub-types.
Luckily for researchers, marketers and business owners, there is a multitude of survey types and subtypes. Some of these survey types fall within the aforesaid three main survey research methods, while others can be categorized as methods of quantitative or qualitative research.
Let’s get familiar with the various types of surveys for consumer research and other avenues of research.
Brand Awareness Surveys
This type of survey is generally the first you should consider conducting before you undertake any other survey types about your customers.
It is most ideal to run a brand awareness survey when you’re well-acquainted with your target market. However, you can conduct this survey even before you’re fully aware of who makes up your target market.
That is because you want to ascertain who knows about your brand; sometimes this can be consumers who narrowly fit within your target audience and sometimes this can be those who are not potential customers.
The latter is important in that although those consumers may not be interested in your brand, they may pass it along to someone who is, since they know about it.
Band awareness, nonetheless, is so much more than whether customers know about your brand. It includes:
- Awareness of what your brand stands for
- What the company is trying to achieve (beyond just selling something)
- The meaning behind your company name or logo
- How you differ from your competitors
As such, this survey type doesn’t merely measure, as it largely seeks to market your brand and everything it has to offer (including style and experiences).
Here are a few considerations to concentrate on for your brand awareness survey:
- Understanding whether your consumers acknowledge your company when they see it.
- Gauging how well your target market can recall your business by way of memory.
- Discovering how loyal your customers are loyal to your brand, especially in times of crisis.
- Ascertaining what customers associate with your brand.
- Bringing to light opinions on your logo and branding components.
When you’re in the midst of a marketing campaign and would like to work out how consumers are reacting to it, you can do so with this kind of survey. Here’s precisely what it can help you:
- Identify which strategies and investments are most effective and which are under-performing.
- Confirm if the opinions of your business are in accordance with how you intend on positioning your brand.
- Pinpoint sentiments and associations about your brand that can help uncover more business opportunities.
- See how your offering or experiences can improve.
Here are some useful questions to ask in brand awareness surveys:
- When you think of this product, what brand comes to mind?
- Which of the following have you tried? (Multiple selections)
- When was the last time you used this product category?
- How many of the brands have you heard of? (Select all that apply)
- When you think of this product, what brand comes to mind?
Customer Satisfaction Surveys
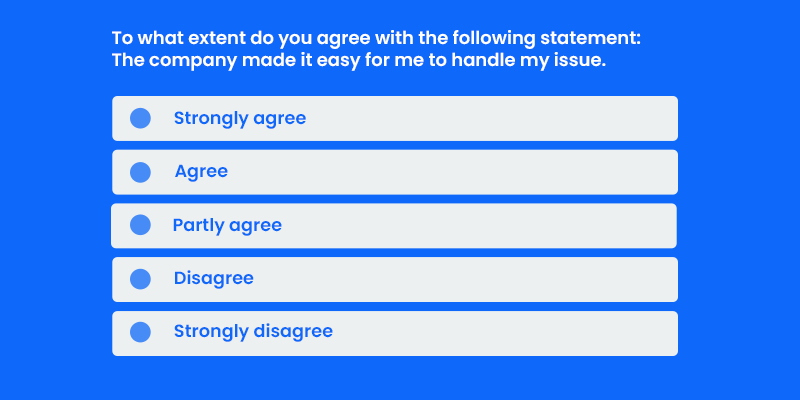
The most commonly used types of surveys, customer satisfaction surveys, like their name implies, gauge customer satisfaction.
Businesses can use these surveys to measure how content their customers are about a number of their experiences. These experiences include a business’s:
- Product
- Service
- Online shopping
- UX
- Events
Since the participants’ responses are direct ratings of a range of offerings, businesses can make educated decisions on how to change their offerings or their overall CX. The responses can also show businesses which aspects of their business are profitable, so the businesses can, in turn, double down on those.
Customer satisfaction surveys are generally short and rely on several visual measurement tools as ratings. These include:
- Stars and other shapes to determine how good or bad an experience was
- Numbered scales
- Color-coded scales
Like other surveys, customer satisfaction surveys rely on questionnaires (if the above units weren’t adequate for research).
Understanding how pleased your customers are is crucial for innovating your product, service and customer experience (CX). It can also determine the following:
- Whether or not a consumer intends to buy from you and is loyal to your business.
- Negative feelings towards your product, service, employees or experience.
- Knowing and making sure that customers are satisfied will reduce churn and increase customer lifetime value.
- Efforts to retain happy customers.
- Who to ask for (ex on social media) for good public reviews or testimonials.
Here are some examples of customer satisfaction questions to use in the questionnaire portion of your consumer survey:
- How would you rate your shopping/web/service experience?
- How likely are you to buy from this brand or this type of brand again?
- Was your issue resolved today?
- Did you find what you were looking for?
- How do you generally feel about the service of [insert industry or specific brand]?
- How would you rate the quality of [product, service, customer service representative experience]?
- Did you have an overall positive or negative experience with [the service, company, etc]?
Event Evaluation Surveys
This type of survey relies on gaining a more specific understanding of a customer experience, which, in this case, is an event. This survey type is essential to use if your business hosts events, whether they’re grand-openings, marketing events, webinars, etc.
These surveys are also crucial to understanding your target market, even if you don’t host or take part in any events. This is because your customers’ opinions towards certain events can help you tweak your offering or your messaging more to their liking.
It can also allow you to see how your customer base spends their time and money, which is critical to market research.
Here are a few pointers on how to improve your event and business in general via event evaluation surveys:
- Ensure your survey captures honest and in-the-moment perceptions from the attendees.
- Keep these surveys short, as many people won’t want to answer a survey after participating in an event.
- Find a way to tie the event with your product or service.
- Put your customers’ needs in the questions.
- Allow customers to discover your brand if you didn’t host/take part in the event.
As for the specific questions to ask in an event evaluation survey, we’re narrowed down a few effective ones:
- What motivated you to come to this event?
- What were your favorite aspects of the event?
- What were your least favorite aspects of the event?
- How likely are you to recommend this event to a friend or colleague?
- Did the event answer your questions and concerns? (can be open-ended)
- What did you think of the [products/services] in the event?
- Will you consider checking out [brands in the event or a similar brand not in the event]?
Lead Generation Surveys
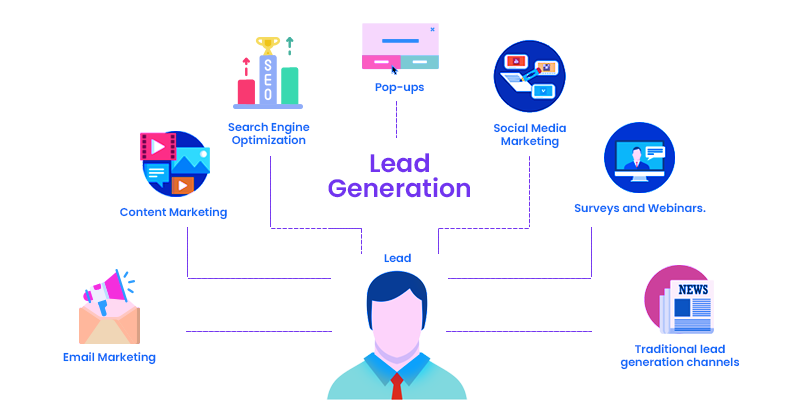
The purpose of these surveys falls more within the confines of gathering contact information from your target market. They can also help reveal the types of people who make up your target market, as they deal with questions about your consumers’ job roles and preferences.
This survey method is a great way to both learn and reel in potential customers. As such, this type of survey should be used early on in your research. But it is not meant to be rigidly conducted at this point.
You can use it throughout your marketing and market research campaigns to build up a list of quality prospects.
Since the object behind lead generation surveys is to gain leads via their contact info, there are a few things to take into consideration.
- Use only a few form fields, as too many tend to be unfavorable among users, especially if they are C-level executives who deal with their company’s finances.
- The most important fields are names, job roles and email addresses, especially in the case of B2B businesses.
- An opt-in button to get their permission to be contacted through their email address.
- Questions that ask for their preferences within your industry about your offering
- Interactive content (GIFs, quizzes, etc.) to set your brand apart.
As for the questions, remember to ask questions that will help your brand determine whether the prospect is an MQL. The following lists a few question examples for lead generation surveys:
- What is your role in the company?
- Are you in charge of your team’s budget?
- How do you intend on growing your business?[or gaining customers, questions that deal with growth/scaling]
- Would you consider buying this [ex: software] to improve your revenue and overall business goals?
- How do you stay up-to-date on industry trends?
Job Satisfaction Survey
This type is an example of a survey delving into a specific topic or theme to better understand your personas and user base. Since employment is a major factor in the quality of life, it is wise to pick your consumers’ brains on this topic.
In fact, 51% of American workers have reported that they get a sense of identity from their jobs. Since jobs define who the public is, or at least a large percentage of it, your business can stand to create surveys centered on job satisfaction.
After all, participants more satisfied with their line of work and income are more likely to spend.
A job satisfaction survey is similar to an employee satisfaction survey, but offers a much more intimate view. That is because the latter deals with all members of an organization, whereas the former deals with the personal outlook of an employee to measure their satisfaction.
Here are a few questions designed for this survey type:
- What does your job represent to you personally? (Answers can include: just a way to earn money, a way to be involved in something important, a way to better myself, etc.)
- How would you rate your satisfaction with the work you do? (Can use a scale)
- How meaningful is your job to you? (Can include a scale)
- Do you feel empowered to make purchases?
- If yes, on what kinds of items? (Answers can include media, travel tickets, products in your niche)
Choosing the Proper Type of Survey
While the above lists several fundamental survey types for your market research campaigns, these are just a drop in the bucket, in terms of quantity. There are various other survey methods, both based on survey research methods and on specific topics.
The true value in surveys comes from their ability to give you full control of the questions, thereby the topics for your consumers to answer. That’s why, before you settle on the types of surveys to use, you should first find a practical and user-friendly survey tool.
This way, you can be sure that you’re gaining the maximum satisfaction in your survey process. Once you find an exceptional survey solution, you can comb through the different survey types and choose the best one for your business.
Frequently asked questions
What is a consumer survey?
A consumer survey is a research method used to understand how satisfied consumers are with products, features, or services. It can also be used to understand how consumers feel about potential or new products and services. There are several different types of consumer surveys, including brand awareness surveys, customer satisfaction surveys, and job satisfaction surveys.
What is a brand awareness survey?
A brand awareness survey is used to understand how familiar your target market is with your brand. It can be conducted with existing customers or with a larger population to understand how you compare to other brands.
What is a customer satisfaction survey?
A customer satisfaction survey measures how satisfied existing customers are with your products or services. They tend to be short surveys that are deployed at a certain point in time, such as after making a purchase.
What type of events can benefit from an event satisfaction survey?
Any type of event that people attend, whether in-person or virtually, can benefit from the use of an event satisfaction survey. They are often used to understand satisfaction with conferences, marketing events, and webinars.
What is a job satisfaction survey?
A job satisfaction survey seeks to measure how satisfied employees are with their job. It can help a company improve many operational aspects, including retention rates, hiring processes, profitability, and management style.

The 3 Major Types of Survey Research Methods
The 3 Major Types of Survey Research Methods

Within the ever-evolving and accelerating market research space, there is a litany of surveys making the rounds. Businesses are scrapping to get all the necessary consumer insights into their hands, and this is a fitting approach to satisfy any target market.
That’s because surveys allow you to gain an edge within your niche and outperform your competitors. While nothing is guaranteed, researchers and marketers have long been turning to surveys to observe the minds of their customers and potential customers.
Before perusing through the aforementioned litany of surveys, you ought to know about the different types of survey methods. That’s because there’s no “one size fits all” approach when it comes to survey research.
Business needs vary, as do their industries, customers and campaigns. Let’s navigate the three most salient types of survey methods.
Survey Research — Beyond Distribution Type
In survey research, there are four types of distribution methods — but we won’t be covering those too much in depth. That is because they are widely known and seen. It’s virtually impossible for you or your business to not have heard of them in a limited capacity at the very least.
However, for the purpose of organizing the in-depth survey methods we discuss later into the deployment types, we’ll briefly mention them here. The four different types of survey deployment methods are:
- Paper surveys
- Written questionnaires
- Mail-in surveys
- Newspaper surveys
- Online surveys
- Online forms
- Proprietary surveys (on brand sites)
- Email surveys
- In-app surveys
- Third-party surveys
- Telephonic surveys
- Cold calling
- Anonymous respondents
- One-on-one interviews
- In-person and onsite interviews
- Less anonymity
All of these survey deployment types can serve both qualitative and quantitative research needs. The ones you choose to incorporate into your market research campaigns is ultimately up to the needs of your business. Some businesses prioritize ease, some prefer quick insights while others prefer cost-savings.
Now that you know survey distribution types, less delve further into specific survey methods.
Cross-Sectional Survey Studies
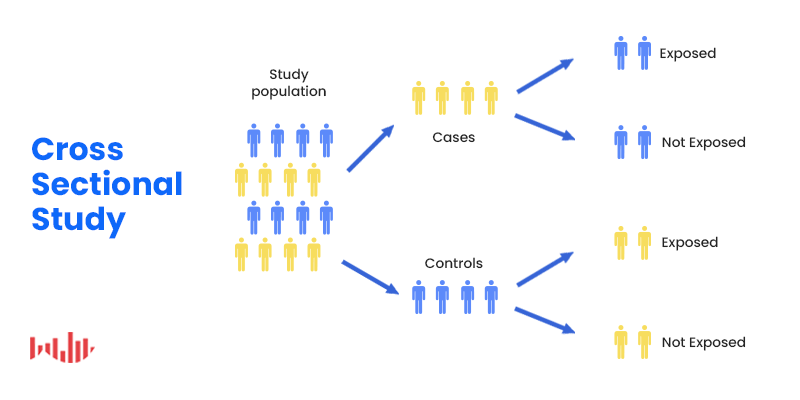
Cross-sectional surveys concentrate on a very specific point in time and exist as a quick overview of a small population sample. This method is ideal for situations wherein quick answers are needed to gain knowledge on standalone, or single situations.
This survey method is based on three conditions:
- the distribution of surveys to small samples
- within large populations and
- conducted over a small period of time.
The sample pool is drawn from specific variables, usually, only a few to narrow down a unique and usually small population. The findings are recorded within a short period of time and are studied and archived within that one specific point.
The variables are not manipulated as this type of research method is for observations only. This approach cannot measure causation between certain occurrences (ex. Inactivity and weight); rather, it measures the correlation between occurrences.
Longitudinal Surveys
The antithesis of cross-sectional surveys, longitudinal surveys study variables over a longer period of time. This can be anywhere between weeks and on the far end of the spectrum, decades.
As such, they require more input in terms of several aspects, including participants, time and money. In this regard, a larger pool of participants is used and studied for much longer.
Similar to cross-sectional research, this method is also observational and studies the exact sample pool for the duration of the study.
Longitudinal surveys come in three main sorts:
Trend surveys:
- Study trends
- Observe how participants’ tendencies change over time
- Ask the same questions at different points in time
- Don’t necessarily study the exact same participants throughout, since the focus is on trends
Panel surveys:
- Focus more on people than trends
- The same participants are studied throughout the duration of the study
- Tend to be more expensive and difficult (tracking & keeping up with the same people for years on end)
Cohort surveys:
- Regularly study a group of participants that fall under a specific category
- Don’t require the same participants to take part every year
- Examples include those born within the same decade, workers of the same industry at the same time, other common life experiences
All three of these kinds of surveys help researchers study how people change and, as longitudinal research, they are also part of correlational research. Longitudinal surveys help businesses and researchers scrutinize developments and changes.
They allow researchers to assess whether the changes are due to age, life factors or trends.
Retrospective Surveys
This survey method is yet another type based on frequency. It combines aspects of both cross-sectional and longitudinal survey methods.
Retrospective surveys observe changes that occur over a longer period of time, much like longitudinal surveys. However, like cross-sectional surveys, they are facilitated just once. As such, responders discuss happenings from the past. These include feelings, attitudes, experiences and beliefs.
The findings are thereby longitudinal in nature, but performed in a cross-sectional fashion, ie, without requiring the long amounts of time to collect the data, like in traditionally longitudinal studies.
This scaling back on timing and monetary savings are the major advantages of this type of survey method. However, it does have its fair share of drawbacks, mainly those of memory distortion. For example, memories from the recent past may be vivid or clear enough to provide researchers with accuracy.
But memories of the more remote past, or even those of both the recent and distant past, when compared against one another, may lead to inaccurate answers.
Settling on the Correct Survey Method

Before you conduct any survey research, there are several questions you can stand to ask yourself or your own business. These should help you narrow down the proper survey method and distribution channel for your survey research.
Here are some questions to consider which method is most suitable for you:
- Do you need to gather long-term, continuous research or are you looking to gain insights on the current timeframe?
- This will help you decide between choosing a cross-sectional or longitudinal survey study.
- If you prefer a long-term study, are you willing to persist in obtaining responses from your sample pool, or do you want to pursue different respondents each time?
- Would you prefer to survey the same group of respondents in the long term?
- How often do you need survey responders to take part in your survey research campaign?
- Are you looking to understand the development of people’s behaviors or trends within your industry?
- If you don’t need to conduct a survey across a large span of time, do you need to question respondents about the past?
- Do you need to study a specific category of participants, or can they fall within a more broad category?
As a business, you should cross-reference your responses to these questions with the information above. That way, you can make an educated decision about which survey method and (survey types) are best for your business.
Frequently asked questions
What are the four methods of survey distribution?
The four survey deployment methods are paper surveys, online surveys, telephonic surveys, and surveys conducted via in-person interviews.
Why are cross-sectional surveys conducted?
Cross-sectional surveys are used to quickly get answers about a specific scenario at a certain point in time. They focus on a small sample size to provide a general overview of a specific scenario or situation.
What is a longitudinal survey?
A longitudinal survey studies a pool of participants over a set period of time. The period of time can range from weeks to many years. It is performed to understand how the respondents change or develop over time.
What are the three types of longitudinal surveys?
The three types of longitudinal surveys are trend surveys, panel surveys, and cohort surveys.
How is a retrospective survey different from a longitudinal survey?
Retrospective surveys are performed to observe changes that occur over time, but they are conducted only one time. The survey is performed to understand how the respondents feel or react to something that happened in the past.

Market Research Trends Dominating 2020 — and Beyond
Market Research Trends Dominating 2020 — and Beyond
 2020 has seen its fair share of downsides, to put it mildly. But the year has also seen advancements on the market research front. Indeed, there have been several trends coming out of the woodwork or making headway in innovations on existing trends.
These trends have steadily become forces to reckon with when it comes to collecting research on the markets.
In this article, we’re going to give a rundown on some of the biggest market research trends dominating 2020. These have held a sturdy weight in the space and we foresee them to carry onto the next year(s) due to their magnitude.
The Use of Blockchain for Security, Elimination of Data Silos & More

The advent of the blockchain has powered the cryptocurrency industry — but it hasn’t stopped there. A decentralized ledger system, the blockchain’s first line of storage was cryptocurrency transactions, but it is capable of storing virtually any kind of data.
Due to its immutable nature, all recorded transactions cannot be corrupted or modified in any way. The blockchain also operates in a members-only capacity. It extends security with features such as proof of member identity and verifiable transactions.
Aside from stronger security, blockchain technology provides the following to the market research industry:
Less oversight required, with approved members only using a particular blockchain
No need to deal with additional intermediaries.
Much less prone to hacking due to encryption, peer-to-peer oversight and decentralization.
Better protection for data, as it is stored into blocks and broken down from large databases.
Elimination of duplicate responders, since nodes can identify consumers with their data
Reduction in data silos, since data is decentralized across a network of users
Ease of interoperability between blockchain participants to share data.
The Rise of Machine Learning and Artificial Intelligence
Machine learning has risen over the years in implementations across industries. To put things into perspective, machine learning uses artificial intelligence for gathering patterns to peruse current happenings and predict future behavior.
Using a breadth of algorithms, machine learning stores data to glean customer activities and behaviors, which it uses to predict future customer activities. AI also assists in market research through a number of ways.
Firstly, it has been setting trends in the process of deep learning segmentation. Market segmentation has long been used for developing customer personas in the ad tech, marketing and market research verticals. Deep learning segmentation is a segmentation framework that has been improved by AI, as AI identifies patterns too intricate for humans to understand or make use of without biases.
This way, businesses can both make sense and make use of big data, rather than have it go to waste or not understand it to its maximum potential.
AI has also provided the market research industry with:
Processing large sets of data
Identifying trends within a complex system
Cutting costs by reducing the time to conduct market research
Building up layers of insight for a more precise customer understanding
Performing repetitive and manual tasks faster than humans
Understanding qualitative and quantitative data via Natural Language Processing (NLP)
Eliminating human bias by processing information only
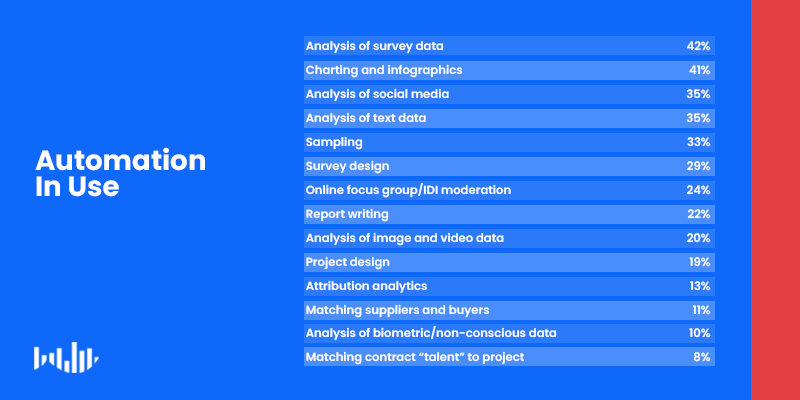
Automation Continues Aiding with New Innovations
Automation is on the rise across multiple industries, to the point where roughly 60% of all occupations contain at least 30% of automatable activity. It is thus no surprise that automation has made its way to the market research industry.
Much like artificial intelligence, automation procedures reduce manual intervention so that more windows of time open up for humans to work on other matters.
For research purposes, automation has revolutionized many researching tasks, with the innovations of social listening, sampling, quota collection, survey distribution and more. These reduce the need for interviewing and searching for survey participants, among other changes.
Here are some of the ways automation serves the MR industry:
DIY survey platforms allow for streamlined aggregation of primary research.
Application of more tech-based, automatable solutions (ex: in-app solutions)
The elimination of the need for sourcing and requesting samples
Survey re-routing so participants only get relevant questions (Ex: if they answered X, they are taken to question Z, skipping a few other questions)
Allowing researchers to more easily handle larger sets of data.
Storage and quick access to a variety of customer data
Sending reminder notifications to participants so that they finish their surveys
The Simplification & Prevalence of Mobile Surveys
The mobile space is growing, both in terms of traffic and app development. As such, the market research industry has pushed surveys to take part in the mobile experience.
Mobile surveys have been significantly making strides, as 30-40% of surveys are completed on a mobile device. With mobile the growing number of mobile users and mobile traffic, this device has lent itself to be a key battleground for rounding up the thoughts of consumers.
Mobile surveys are trending in the MR space, along with some of their own, unique features. Here are a few:
Unique templates to match brands’ style
The capability of granting a white-label feel
Adaptation to a multitude of mobile websites and apps
Short surveys zeroing in sub-niches and subtopics
Seamless integrations within various mobile formats
In-app data analysis
Adoption of a low code platform
Remaining on the Lookout for More Trends
Market research is an expansive practice, neither fixed on one type of research method (primary or secondary). Rather, much like customer expectations themselves, it is constantly evolving and accelerating in some respects.
In order to keep a leg up on your vertical and target market, your business must stay on top of trends in the MR space. This includes emerging trends, along with established ones that are still carrying weight and innovating new sub-trends.
All the aforementioned trends in this article have seen steady popularity in that these tend to be cost-effective, time-saving and quashing of one or several inconveniences. Your business can therefore stand to adapt some of their innovations or practices.
Stay on the lookout for more market research trends. We’re always watchful to provide the latest trends. That way researchers and general business owners can become more competitive and relevant to their target market.
Frequently asked questions
How has blockchain technology improved survey market research?
Blockchain allows for complete control over how surveys are distributed and responded to. When using blockchain technology, a company controls exactly who takes the survey and can prevent any gaming of the system.
What applications does the use of AI have in market research?
AI and machine learning have made it much faster for researchers to process huge amounts of data and identify trends within those data sets. This results in cost and time savings for the research team. It is also used to understand qualitative and quantitative data.
How does automation benefit market researchers?
Automation reduces the amount of work that needs to be done by researchers, freeing up their time to be used for more valuable operations. Additionally, automation can be used to dynamically deliver survey questions to respondents based on their previous answers.
How popular are mobile surveys?
Approximately 30 - 40% of all online surveys are completed on a mobile device.
What are some of the recent trends in mobile surveys?
Mobile survey technology is always evolving. Some of the latest trends include the ability to deploy very short surveys to a sub-niche, in-app data analysis dashboards, and deployment of surveys across a variety of websites and apps.

The Advantages of Conducting Mobile Surveys
The Advantages of Conducting Mobile Surveys

Mobile surveys have revolutionized the market research space. These useful tools for understanding a target market help uncover revenue and scaling opportunities for all kinds of businesses.
As one of the most tried and true methods for unlocking your target customers’ desires and needs, surveys not only allow you to understand your customer base but also inform you on the overall landscape of your industry.
This is because you can formulate questions that are not necessarily about your own product/service, but rather a similar one, an innovation to an existing offering or an entirely new one.
The tactic of surveying a pool of consumers is not new, although it has undergone a revolution, from the snail mail surveys of the ‘90s, to the phone surveys of the ‘00s and today’s internet surveys.
Nowadays, mobile surveys have been making headway — and for good reason. There are several notable reasons as to why it’s advantageous to conduct mobile surveys.
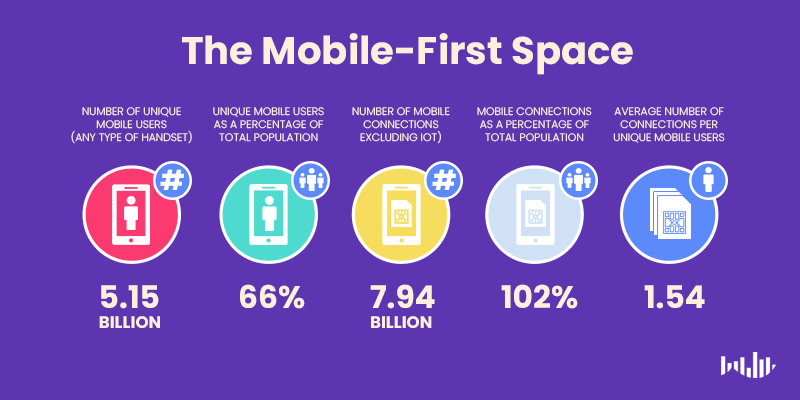
A Mobile-First World
We are no longer living in a digital world, that is, in a digital-only world. We are living in a mobile-first world, and this is not a generalization. It is true by a number of objective measures.
First off, over half of all web traffic is on mobile. This is no meager chunk of internet traffic, so it is safe to assume that many of your site visitors are there by way of mobile apps or mobile websites.
Secondly, this strong presence will soon break away from the halfway point of internet traffic. That is because mobile traffic is predicted to grow by 25% by 2025. Clearly, mobile traffic, although weighty, is not stagnant and will continue to increase, perhaps significantly dominating desktop and tablet traffic combined.
But there are more ways in which mobile is taking a large share of the internet traffic pie. 91% of internet users access the internet through a mobile device. Here are a few other ways in which mobile use is surging on the internet.
Mobile Use Yields Mobile Convenience
Although desktops, laptops and tablets are all getting thinner as technology evolves, the go-to device for on-the-go usage is still the mobile phone. It’s the smallest and most portable device out of all four device types.
And since people use mobile for making calls more so than landlines, they are frequently within reach of their phone.
However, it would be unwise to assume all commuters and walkers travel with their laptops or tablets in tow. Despite this, it is far safer to infer that most people on the go carry their phones with them.
This does not merely apply to travelers. Internet users partake in the mobile internet experience in the following scenarios:
- Between sending text messages (especially if they are working remotely)
- While reclining and/or resting
- Between meetings
- While waiting in line for any service
- While talking on the phone (especially if it’s via speakerphone)
While all of these appear to be ordinary occurrences, they are apt opportunities to send surveys. That is because many of these situations paint a picture of the users being inactive, unoccupied or simply idle.
In this case, a well-put-together survey may assuage their boredom. This would expose your survey to millions and allow it to capture real-time users.
An Innate Simplicity
Since phones are smaller and allot far less real estate than desktops or tablets, businesses and content providers are forced to simplify their interface so that only the most important online elements fit.
In short, they would take a mobile-first approach to design. This is positive news for your business — at least for your UX/ digital department, in that they would need to apply fewer elements and effects per page.
When users are sent on a survey via your mobile website or app, the page they open should be as bare as possible, ideally with just the survey questions and media files. (The menu should exist as a hamburger in this instance).
This is a breath of fresh air for users as well. It is because of the hectic nature of many internet pages, which bombard users with distracting content (think ads, unsolicited videos/music playing, too many links, photos, etc.).
The minimalist nature of mobile thus makes for a much more convenient environment for survey respondents.
Speed to Insights

With so many internet users surfing the web on their phone, your survey is bound to get responses exceptionally fast. This is especially true if your survey targets high-traffic apps. To truly reap this benefit, your survey provider should deploy surveys over a vast network of popular apps.
Luckily, at Pollfish, it does. We partner with 140,000 app providers so that active users on high-traffic apps are exposed to your survey instantaneously upon opening the apps.
Additionally, the mobile experience, when produced correctly, is known for speed. Think about it; it is much easier to see all of your tabs when browsing on desktop. But on mobile, you can’t see them laid out all at once; usually, it requires doing some swiping, otherwise, only one tab is shown.
That’s why on mobile, users are prompted to answer quickly so that they can return to their customer journeys on the apps/mobile sites they’ve been using.
Mobile Surveys: All Rainbows and Sunshine?
Closing off, we want to conclude that while conducting surveys on mobile has ample advantages, it also carries some disadvantages. But these shortcomings are not necessarily insurmountable.
That’s why we’re sharing them, so that you can optimize your mobile experience to obtain the most out of your surveys.
Here are a few:
- Mobile apps have to be made for a variety of operating systems and phones. As such, researchers should make sure their app can support several mobile devices.
- Some file sizes of surveys along with the apps themselves may be too large for users’ phones, as phone space is limited. This is primarily the app providers’ issue, but it will affect researchers’ survey usage as a result.
- Not all mobile users have access to a sturdy data plan, so they may be wary of using up their data to take a survey.
There are surely going to be other forks in the road with the mobile survey experience, but mobile is king. That being the case, the shortcomings aren’t outweighed by the benefits.
The key is to ask the right survey questions to gather the most relevant insights about your industry and the minds of your target market.
Frequently asked questions
What is a mobile survey?
Mobile surveys are surveys that are completed by respondents on a phone or a tablet.
How can the use of mobile surveys improve response rates?
Respondents can complete mobile surveys at a time and place convenient to them, which may increase the response rate of the survey.
How do mobile surveys allow businesses to reach a wide audience?
Mobile surveys can be deployed in a variety of ways. The use of traditional methods, such as email, allows businesses to reach existing customers. But they can also reach a wider audience by deploying the survey with app partners, who display the survey on high traffic apps to reach a new audience.
How does mobile design affect the response rate?
Mobile users expect a fast experience without interruptions. The response rate may be low if the survey takes too long to load or is interrupted by pop-ups and other distractions.
Can I deploy the same survey on mobile and desktop?
Yes. By using a professional app platform, you will be able to easily create a survey that can be used on a variety of devices, including phones and computers.

Online Survey Panels: How to Access Deep Insights Efficiently
Online Survey Panels: How to Access Deep Insights Efficiently

When it comes to gathering data on consumer attitudes and opinions, there are a number of options available to businesses. You can go out into the world with a pencil and paper and ask questions directly to the public. You can organize a focus group for detailed, highly targeted responses.
Or you can try online survey panels.
Online survey panels can offer deep and efficient access to what your potential audiences are thinking. Yet, they have been known to sometimes be tarnished by poor data. Panelists get over-surveyed, for example, and stop providing authentic responses. Or they’re just in it for the compensation – and so speed through questions without giving them enough attention.
Yet, this isn’t always the case. In fact, new methods of conducting consumer research are taking steps beyond traditional online survey panels.
In this article, we’ll share what we at Pollfish are doing to ensure that you can gain deep, authentic insights from your consumers – in ways that are truly efficient in terms of cost and time. But first, what exactly is an online survey panel? And why would you use one in the first place?
What is an Online Survey Panel?
Survey panels are a research method in which data is collected from a group of pre-recruited and pre-screened respondents who have agreed to complete your survey. In a nutshell, that’s it.
That said, survey panels are often used for a more specific purpose – namely, to collect data repeatedly from the same set of people. In this way, a group of panelists responds to surveys in a number of research sessions over a given period stretching from weeks up to a year. This gives panel surveys some specific advantages over ad-hoc, one-off questionnaires, for example.
Meanwhile, while a focus group has only a handful of participants, from whom researchers can take very detailed data, survey panels use a much larger sample size – well into the hundreds and thousands. This way, they can give businesses access to a much broader section of the population, or provide deep insight into highly targeted demographics.
And whether you want to test a product, or see how audiences respond to an ad campaign, this knowledge of your consumers is indispensable.
What Insights Can You Gain from an Online Consumer Research Panel?
There are a number of reasons why you choose to conduct an online survey panel over other forms of data collection. Fundamentally, though, businesses tend to opt for panels for the specific kinds of insights that they provide.
In-Depth Data from Targeted Audiences
What survey panels offer better than most other methods of research is a targeted audience at scale. Participants in online research panels are profiled and screened – meaning that you can be sure that the panelists to whom you are asking the questions truly reflect your desired audience.
We don’t just mean this in terms of demographics, age, or gender. Pre-screening questions allow for targeted research in very narrow consumer segments. You may not just want to see how a product or ad will go down with the general population. You might be interested in how it will go down with men in the north of England who like jazz music and drink craft beer. Obviously, this is a little more specific.
Opinion Analysis over Time
By returning to the same group of respondents, online survey panels can provide data on changing opinion through time, within your identified audience. This lets you analyze trends within your target demographic, or within those with a certain behavior, to understand how your audience develops.
This continuous approach can offer powerful insights – and it can set up a great baseline to which you can compare one-off survey data too.
A Broader Selection of Data
Ad-hoc surveys provide limited snapshots of consumer opinion. Online panel surveys rather provide a much richer field of data. Alongside the simple responses to the surveys themselves, the initial screening questions, demographic information, and longitudinal data promise a much more comprehensive profile of your audience. And this can better inform key business decisions.
How Online Panel Surveys Can Boost Business Efficiency
Consumer panel surveys offer businesses with authentic, in-depth insights into their audiences. Yet, importantly, they do this at a relatively low cost – while offering quick, efficient results. It’s the combination of these factors that make them one of the most popular research methods.
Here are some of the efficiencies you can expect from online panels.
Repeat Participants Reduce Processing and Costs

With online survey panels, respondents opt-in and provide information about themselves in the process. This keeps start-up costs and time expenditure low. If you had to prepare screening questions and find your specific target audience for every survey you wanted to ask, your work would be never-ending.
The good thing about panels is that once set up, the panel remains there, pre-recruited and pre-profiled. This means that you can move fast whenever you have a question to ask. Changes to your brand can be tested quickly – allowing you to move forward on them in a more favorable timescale.
Quality Respondents Available at an Instant
Similarly, as participants sign up for the panel, you can be much more sure that they are willing to participate in your research. This gives you more data faster – as it tends to boost response rates, while keeping participants free from bots.
All that needs to be ensured is that the quality of the panel remains high. Yet, this saves serious energy and money in comparison is starting from scratch every time.
Efficient, Automated Data Collection and Analysis
Traditional panels are one thing; online survey panels are quite another. Modern technologies have powered efficiencies not only in the ways that you ask questions but in the ways that you understand the answers too.
This inevitably makes the analysis of patterns in data easier and more sophisticated. And it cuts down on the costs associated with labor time. In some cases, insights can be delivered in real-time as they come in.
Yet, There’s a Problem with Online Survey Panels
Consumer research always has its imperfections. And this is also true for online survey panels. No matter how efficient they may be, there are issues that have plagued this research method since its inception – and are no less significant since the move online.
Panel fatigue. A common issue, panel fatigue happens when respondents are over-surveyed. While they may sign up in good faith, participants can simply become bored. As a result, they rush through or skip questions, or lean heavily on the ‘don’t know’ option – which is not very helpful for your data.
Professional panelists. Panel participation has often been encouraged through cash-based incentives. But “professional panelists” – respondents who complete as many surveys as possible, to maximize their compensation – have proliferated as a result. These favour speed over quality answers – and are known to manipulate screening questions to ensure access to as many surveys as possible. Again, this affects the data.
Non-organic environment. A fundamental challenge for the accuracy of survey panels is that data collection does not occur within a consumer’s natural setting. Survey environments tend to be artificial, and this affects participants’ thought processes – meaning that quality, authentic data is not guaranteed.
What Pollfish Does Better with Online Surveys
At Pollfish, we’ve moved away from simple online research panels due to exactly these problems. And our consumer research methodology tackles these issues head-on – while assuring cost-effective and efficient insights for your business.
Our access to over half a billion engaged consumers makes this possible. These come through our network of 120,000+ app providers, which deliver surveys to their users in-app in exchange for specific, in-app incentives. This draws a line under professional panelists, who cannot accumulate rewards while assuring that surveys are completed by engaged participants in their organic environment.
Part of our method means that we also remove 30% of our responses. Why? With so many reasons why poor data accumulates – from professionals to fatigued panelists, to bots and fraudsters – we’ve implemented radical measures to ensure that quality remains high. This means that you get more authentic consumer insights and that every data point you receive is more reliable – and better value for your money, too.
Finally, our platform does all the screening. We have pre-collected data on participant demographics, and even mobile usage – so that you don’t have to spend the time doing this yourself. As a result, all you have to do is ask the questions.
How You Can Access Consumer Insights Efficiently with Pollfish
We make it easier to gain deep consumer insights. With the largest audience in the world, living in over 160 countries, we use a rolling profiling model to ensure that the data we hold is always up to date. This keeps your work to a minimum.
- Define your audience demographics. Tell us who your audience is based on age, gender, education, and more. Then focus the specific consumer segment using our predefined criteria – on behavioral attributes, psychographics, and other biographic information.
- Refine your target with screening questions. These get you even closer to the audience you want. For example, you may want to include only those who are aware of certain events or who hold certain opinions.
- Select from question types and research objectives. We have collected common research objectives and pre-crafted question types so that all you have to do is select.
- Analyze data with ease. Our advanced data tools allow you to filter your findings even further, by location or employment status. Survey results are available to you in real-time too, so you don’t need to wait for all the data to come in.
At Pollfish, we’ve gone beyond simple online survey panels, to make accessing customers insights even more efficient – and less prone to bad data. We do the heavy lifting so that you can dedicate your energies to putting your consumer insights to work.
Frequently asked questions
What is a survey panel?
A type of research method, survey panels are used to collect data from a sample of individuals who have agreed to complete the panel survey. In most cases, survey panels are performed over a period of time to collect data from participants several times.
What type of insights are survey panels used for?
Survey panels are particularly useful for providing insightful data from a targeted audience, understanding how opinions change over time, and providing a more comprehensive view of the target audience.
What are the benefits of survey panels?
A main benefit of survey panels is that you already have an established, pre-qualified group of respondents available to answer your questions. This results in a more cost-effective process and allows business owners to collect information quickly when needed.
What are the disadvantages of survey panels?
Survey panels are subject to some flaws, including panel fatigue and panel conditioning. Both of these occur when the respondents alter their survey responses or change their behavior as a result of their participation in the panel.
How can “professional panelists” affect the results of a survey?
Professional panelists are motivated to join the survey panel to gain the reward that is offered. These individuals may participate in as many surveys as possible, resulting in much lower quality responses.

What is a Consumer Research Panel, and How Can it Help?
What is a Consumer Research Panel, and How Can it Help?
A consumer research panel is defined as a group of individuals brought together with the express purpose of providing opinions, insight and feedback on products and services. In simple terms, a consumer research panel is the participating audience in market research campaigns.
These panels are used in a wide variety of campaigns, including those on advertisement research, product testing, and other initiatives that require the input and insight of a target audience.
Panel members are selected to represent either a particular group or the general public, with panels made up of tens (and sometimes hundreds) of thousands of people. Businesses can then segment the panels based on certain criteria and demographics to ensure they’re reaching the right audience with their questions.
Consumer Research Panels: Why Do They Matter?

Thanks to the internet and social media, sales channels are becoming increasingly saturated, with consumers bombarded by messages and offers morning, noon and night. With this in mind, businesses are now, more than ever, searching for marginal gains in order to outmaneuver the competition.
And while products and services can share price points and features, consumer research panels can help business owners understand a key intangible when it comes to standing out from the crowd: customer experience (CX).
For example, if your competitor is operating under the (false) assumption that their product or service is meeting their customers’ needs, quality consumer research can help you set your business apart and establish it as a market leader.
The goal of these panels is to actively listen to — and act upon — meaningful insights from your target audience. When you understand how your product or services makes them feel (good or bad), you can make the necessary adjustments to position your offering more effectively.
How is a Consumer Research Panel Put Together?
Consumer research panel participants are often recruited via online channels. Participants are then organized based on certain factors, such as gender, age, location, profession, and personal interests. The more information gleaned at the recruitment stage, the better, as it allows you to target an incredibly specific and targeted audience.
Usually, participation is incentivized – with panel members receiving rewards in exchange for their time and insight. Rewards can range from cash and gift cards to money-off vouchers and points, which can be redeemed against products or services.
Once a panel has been formed, research can be conducted. Questionnaires are sent to a select group of respondents designed for a particular target audience.
How Does it Differ From Other Types of Customer Research?
A consumer research panel gives you the opportunity to evolve your ideas, involving the same target group throughout for feedback on your iterations. This helps you ensure that you’re moving in the right direction as you make changes to your product, service, brand or message.
Using a panel is, therefore, in stark contrast to focus groups or other one-off surveys. These tend to be “once-and-done” endeavors, where you receive feedback in isolation, based solely on what’s put in front of the group or survey recipients at the time.
This can make actionable insights harder to come by, especially if you’re unable to reconvene the focus group or reach the same survey respondents to gauge their opinions on the changes you’ve made.
What Are the Benefits of Using an Online Consumer Research Panel?
Online consumer research panels allow you to efficiently connect with target market segments, collecting valuable feedback in the process. This method of research has the following benefits:
- Higher response rates from motivated respondents: Panel members are often highly motivated to respond as they’ve opted-in to take part in the research. This can result in a higher quality of feedback.
- Current insights from a representative audience: When maintained properly, a consumer research panel offers an up-to-date picture of your audience’s thoughts and behaviors.
- Quicker and lower cost: Consumer panels can deliver faster insights at a lower cost when compared with other research methods – especially with focus groups, which require time and expenses to run, thus taking longer to coordinate and screen respondents.
- Feedback can be implemented faster, too: The data received from online consumer panels can be analyzed quicker, with trends and patterns spotted and sorted with just a few clicks. This means that if there’s an overriding consensus that something isn’t working, you can change it quickly before it’s too late.
- Anonymity means nothing’s off-limits: The online nature of a consumer research panel means you can freely ask questions regarding sensitive information, including sexual health and activity, alcohol and drug use, relationship status, and other questions on private matters.

What Are the Drawbacks of Consumer Research Panels?
Unfortunately, online consumer panels aren’t all sunshine and rainbows. They do, in fact, have some clear and obvious drawbacks, which include:
- Small sample sizes and limited availability: Depending on your industry and target market, you may experience difficulty in finding respondents due to age, location, or lack of internet access, all of which could skew your data.
- “Bad eggs” can derail your research: There are certain types of consumer panelists who can throw your research into disarray. From bots and fake accounts to professional survey takers – who are more interested in completing your questionnaire in record time than delivering accurate insights – consumer research panels can suffer from a lack of transparency and data quality if managed poorly.
- Online survey fatigue: Chances are you won’t be the only one trying to reach your target audience with a questionnaire. Online surveys have never been more popular, but this level of popularity can lead to jaded recipients simply ignoring or deleting your invitations.
- Risk of panel dropouts: Using the same panel for months on end won’t guarantee that it’ll stay intact. Participants may drop out over time, meaning the quality and accuracy of the feedback could be affected.
- Lack of clarification or follow-ups: Other, more qualitative methods of consumer research will often involve a trained interviewer, there to prod and probe a respondent into expanding on an interesting point or observation. This is lacking from online consumer panels, making it difficult to clarify what someone meant if their feedback is vague
Examples of Consumer Research Panels in Action
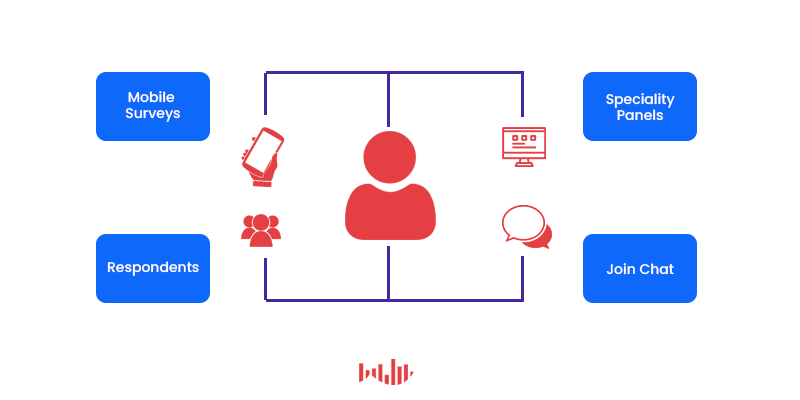
As we touched on earlier, there are a number of ways in which a research panel can be used in pursuit of valuable insights and game-changing feedback. Here are a few examples:
- Product testing: Some research panels can be incentivized to provide feedback in exchange for an early look at a new product – so long as they provide an in-depth response based on their first impressions and overall experience. This is particularly useful pre-launch, allowing you to gather feedback and make improvements.
- App onboarding: Similar to product testing, you can use a research panel to test the onboarding process for an app or piece of software. This will put your interface at the fingertips of the very people you hope will use it post-launch, giving you a vital glimpse into their experience and enjoyment.
- Ad testing: Marketing companies and digital agencies can use consumer research panels to test the impact of a particular advertisement or campaign, ensuring that it makes a connection with the target audience and encourages them to take action.
An Alternative to Conventional Consumer Research Panels
Used properly — and with a reliable and vetted panel of respondents — consumer research panels can help your business gain a competitive advantage. At least, that’s the idea. Because, as more and more companies are discovering, consumer panels are on the downswing. Those drawbacks we mentioned above are becoming more prevalent, making quality feedback harder to find.
Here at Pollfish, we don’t use panels of professional survey takers. Instead, you benefit from our market research methodology by sourcing real people who are online right now. We let you survey people who are going in and out of applications, through our partnerships with publishers. It’s a randomized yet targeted survey distribution method, and you reach verified respondents who have real insights.
With over half a billion people in our network, we never have to worry about data quality. We can simply remove those bad eggs and retain only the best, most authentic, and most useful information.
Frequently asked questions
What is a consumer research panel?
A consumer research panel is a marketing term that describes bringing a group of people together with the goal of understanding their thoughts, ideas, and opinions on a product or service.
How are the members of a consumer research panel chosen?
Researchers select members of a research panel based on key characteristics of their target audience. This can include certain demographics, interests, lifestyle choices, etc.
Why are consumer research panels conducted?
Consumer research panels are conducted to help business owners gain deeper insights about their target audience. The insights revealed in a panel are different from those that can be obtained by doing research or reviewing hard data.
What is an online consumer research panel?
An online consumer research panel differs from a traditional research panel because it is conducted entirely online, rather than in-person.
What are the benefits of online consumer research panels?
Online consumer research panels can be deployed faster, can reach a larger sample size more easily, are cost-effective, and provide anonymity for respondents, which may result in more honest, in-depth feedback.

How To Run Market Research For Your Startup
How To Run Market Research For Your Startup

Market research is a vital component of any business; it is especially indispensable for startups, which are notorious for carrying many risks. For instance, startups have a dismal rate of failure in 2020: a heaping 90% of new startups fail. Unfortunately, this is but one of the many other grim statistics these companies face.
Luckily, startup companies that conduct market research have a major leg up in their field. That’s because market research is a wide-spanning strategy that allows businesses to glean an array of insights. This includes findings on their competitors, customers, potential customers and the sector/niche at large.
In this article, you’re going to learn how to run startup market research for your company to stay ahead of the game and preempt failure.
Where to Begin on Market Research for Startups
Given that market research is an umbrella term, it’s common to be uncertain as to where to begin. It may seem that with market research websites, tech platforms and the mighty Internet itself, market research is information overload. It’s just another headache-inducing task that will produce few results.
That’s where you’re wrong.
Knowing where to start conducting a viable market research plan is key to garnering essential business knowledge, and the results can make or break your startup.
The first undertaking of doing market research is, well, discovering if there’s a market for your product or service. Many entrepreneurs evade this critical first step, as it may seem too obvious.
Or, you may feel a tad too complacent with your offering, deeming it abundantly innovative or useful, so much so that it doesn’t need to identify a market to which it belongs.
That’s a major misstep. You must always first identify the market you belong to. Only thereafter, can you determine your precise target market and continue with your market research. Most importantly, the market you identify can help you learn if your product or service is in demand. If you have too niche of a market, you will want to amplify your marketing efforts to bring more awareness to your niche and increase its profit-reaping potential.
Understanding Your Market
Once you’ve identified which market your product or service falls under and whether it’s worthy to branch into, you’re going to need to have a solid grasp on your market. This is not a “one and done” task, as market trends and marketing strategies across markets evolve with the times. Sometimes these changes occur in a matter of days.
Understanding your market, or more specifically, your niche, will help catapult you towards success. This is the bulk of market research and it involves relying on a swath of different sources.
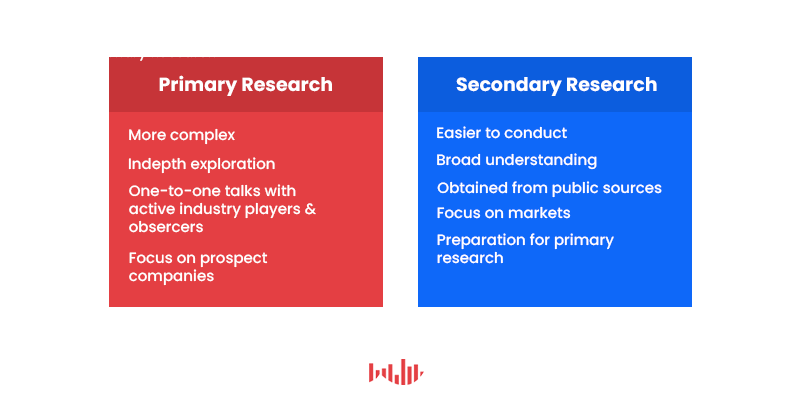
There are two types of sources to observe in your market and niche, and in market research as a whole: primary and secondary sources.
Primary research
is research that you generate yourself, usually directly from the customers. This type of firsthand information is crucial for understanding your buyer personas and segmenting your target market. We’ll analyze primary research later in the article.
Secondary research
is the research that’s already been generated from a variety of sources and made available on the internet, trade magazines and other literature.
For the purpose of understanding your market, niche and competitors, we’re going to focus on secondary research.
You ought to accumulate as much secondary information as possible if you want a clear picture of your market. Here are the secondary sources you should turn to when running your market research on your market itself:
- For the latest trends within your market/niche, obtain trend reports from credible sources such as Google Alerts, Google Trends and Keyhole. These are keyword-based tools that can help you identify trends via:
- Finding the latest blogs, news, videos and search terms for free (Google Alerts)
- Monitoring search terms and drawing data on users searching for the terms for free (Google Trends).
- Overlooking keywords, topics, social media handles, URLs and mentions for a fixed price.
- Next, gather all the necessary statistics on typical personas within the market, buying habits, conversion rates and more.
- US Census Bureau and the US Bureau of Labor Statistics (public market data)
- Research agencies: Pew, Forrester and Gartner for a wide span of market reports
- Industry content sites (news and blog sites particular to a niche. Ex: Ars Technica for tech and IT; Mashable for tech, culture, science; Product Hunt for sharing and discovering new products; etc.)
- Then, study your competitors closely.
- Identify direct and indirect competitors:
- Direct competitors: Businesses with products/services that closely resemble your own and can substitute yours.
- Indirect competitors: Businesses with relatively similar products/services, but cannot fully substitute one another.
- Find the potential weaknesses in your competitors’ offerings, or learn how to use their strengths to improve your own.
- Parse through their websites to understand their pricing, customers and content.
- Research their sales channels and social media.
- Use specific tools for competitor analysis (SEMRush, Nielsen, Klue.com, etc.)
- Finally, store all the findings on your market (the specific niche, and competitors) into an organized and comprehensive document such as a presentation for current and ongoing reference. This is going to be your market knowledge base.
Understanding Your Customers and Potential Customers

Now that you have aggregated a slew of research within your industry and competitors, it’s time to do a deeper delve into your market research. This latter stage is all about your customers: current customs, those in a nurturing stage and all other potential customers.
That’s where primary sources come largely into play. We’ve covered secondary sources and how they can help you research your overall market, but now, it’s time to understand your target market.
A target market is a group of people that a company targets as the primary buyers of their product/service. This is the group on whom a company focuses all of its marketing initiatives. This is the main group of a market, as it is the one most likely to make purchases and become loyal customers.
There are two types of primary sources: exploratory primary sources and specific primary sources. Both of these are necessary to render a clear understanding of your target market.
Here is how to continue your market research by investigating your target market:
- Preface the makeup of your target market via the secondary research you’ve conducted in the first half of the article. This will give you a general sense of who your target market is.
- To fully understand your target market, switch to primary sources to understand the full scope of your target market and cater to them the right way.
- Run exploratory primary research on your target market. This involves conducting:
- open-ended interviews over the phone or in-person
- surveys with a small amount of respondents
- surveys that cover the entirety of your target market
- Run exploratory primary research on your target market. This involves conducting:
3. Identify issues and potential opportunities to study within your target market.
4. Use these topics to narrow into the specifics of your target market with specific primary sources.
- Create surveys that focus on specific segments of your target market.
- Focus on questions aimed at solving points of friction or problems
Closing Up on Setting Market Research in Motion
Aside from understanding your customers’ preferences, needs and problems, it is of utmost importance to first understand them from a demographics perspective. As highlighted in Step 1, you can gather some qualities about your target market from secondary sources. But it’s only a primer and far from giving you the full picture.
Surveys, on the other hand, give startups a major advantage over secondary data and even other primary sources such as focus groups. This is because you control all the questions you collect on your subjects. This includes demographics data such as age, location, gender, education and income level, ethnic background, marital status and more.
A twofold market research tool, surveys also grant you access into the minds of your target audience. Again, this is because you are in control of conceiving all the questions about your target market.
Understanding what in particular your customers’ desire and how they generally think will empower your market research efforts and business in general to stay ahead of the curve. It will assure that you know how to properly market to your customers.
Frequently asked questions
Why is market research important for startups?
Market research can help a startup avoid failure by providing an in-depth view of the market, including potential customers, competitors, and their sector in general. Market research can help prevent failure and ensure that startup funds are used wisely.
What is the first step in market research for startups?
The first step is to identify the precise market that the startup wants to target. By understanding the target market, the company can determine if there is sufficient demand for their product or service.
What is a target market?
The group of consumers who are most likely to buy a company’s products or services is referred to as the target market. While there may be customers outside of this group, the target market contains those people who are most likely to become loyal customers.
What are the two methods of research used in market research?
Primary research and secondary research are the two components of market research. Primary research focuses on gathering first-hand information via research panels, surveys, focus groups, etc. Secondary research makes use of existing, published information such as white papers, industry journals, and government statistics sites.
What advantages do surveys have for startups?
Not only do surveys provide the responses to the specific questions that a business needs answers to, but they can also be used to gather a wealth of demographic data. Since startups are often operating in areas where there is less secondary research available, the collection of demographic data can provide information that would otherwise be difficult to obtain.