
Multiple Open-Ended Question Type
Ask richer questions. Get deeper answers.
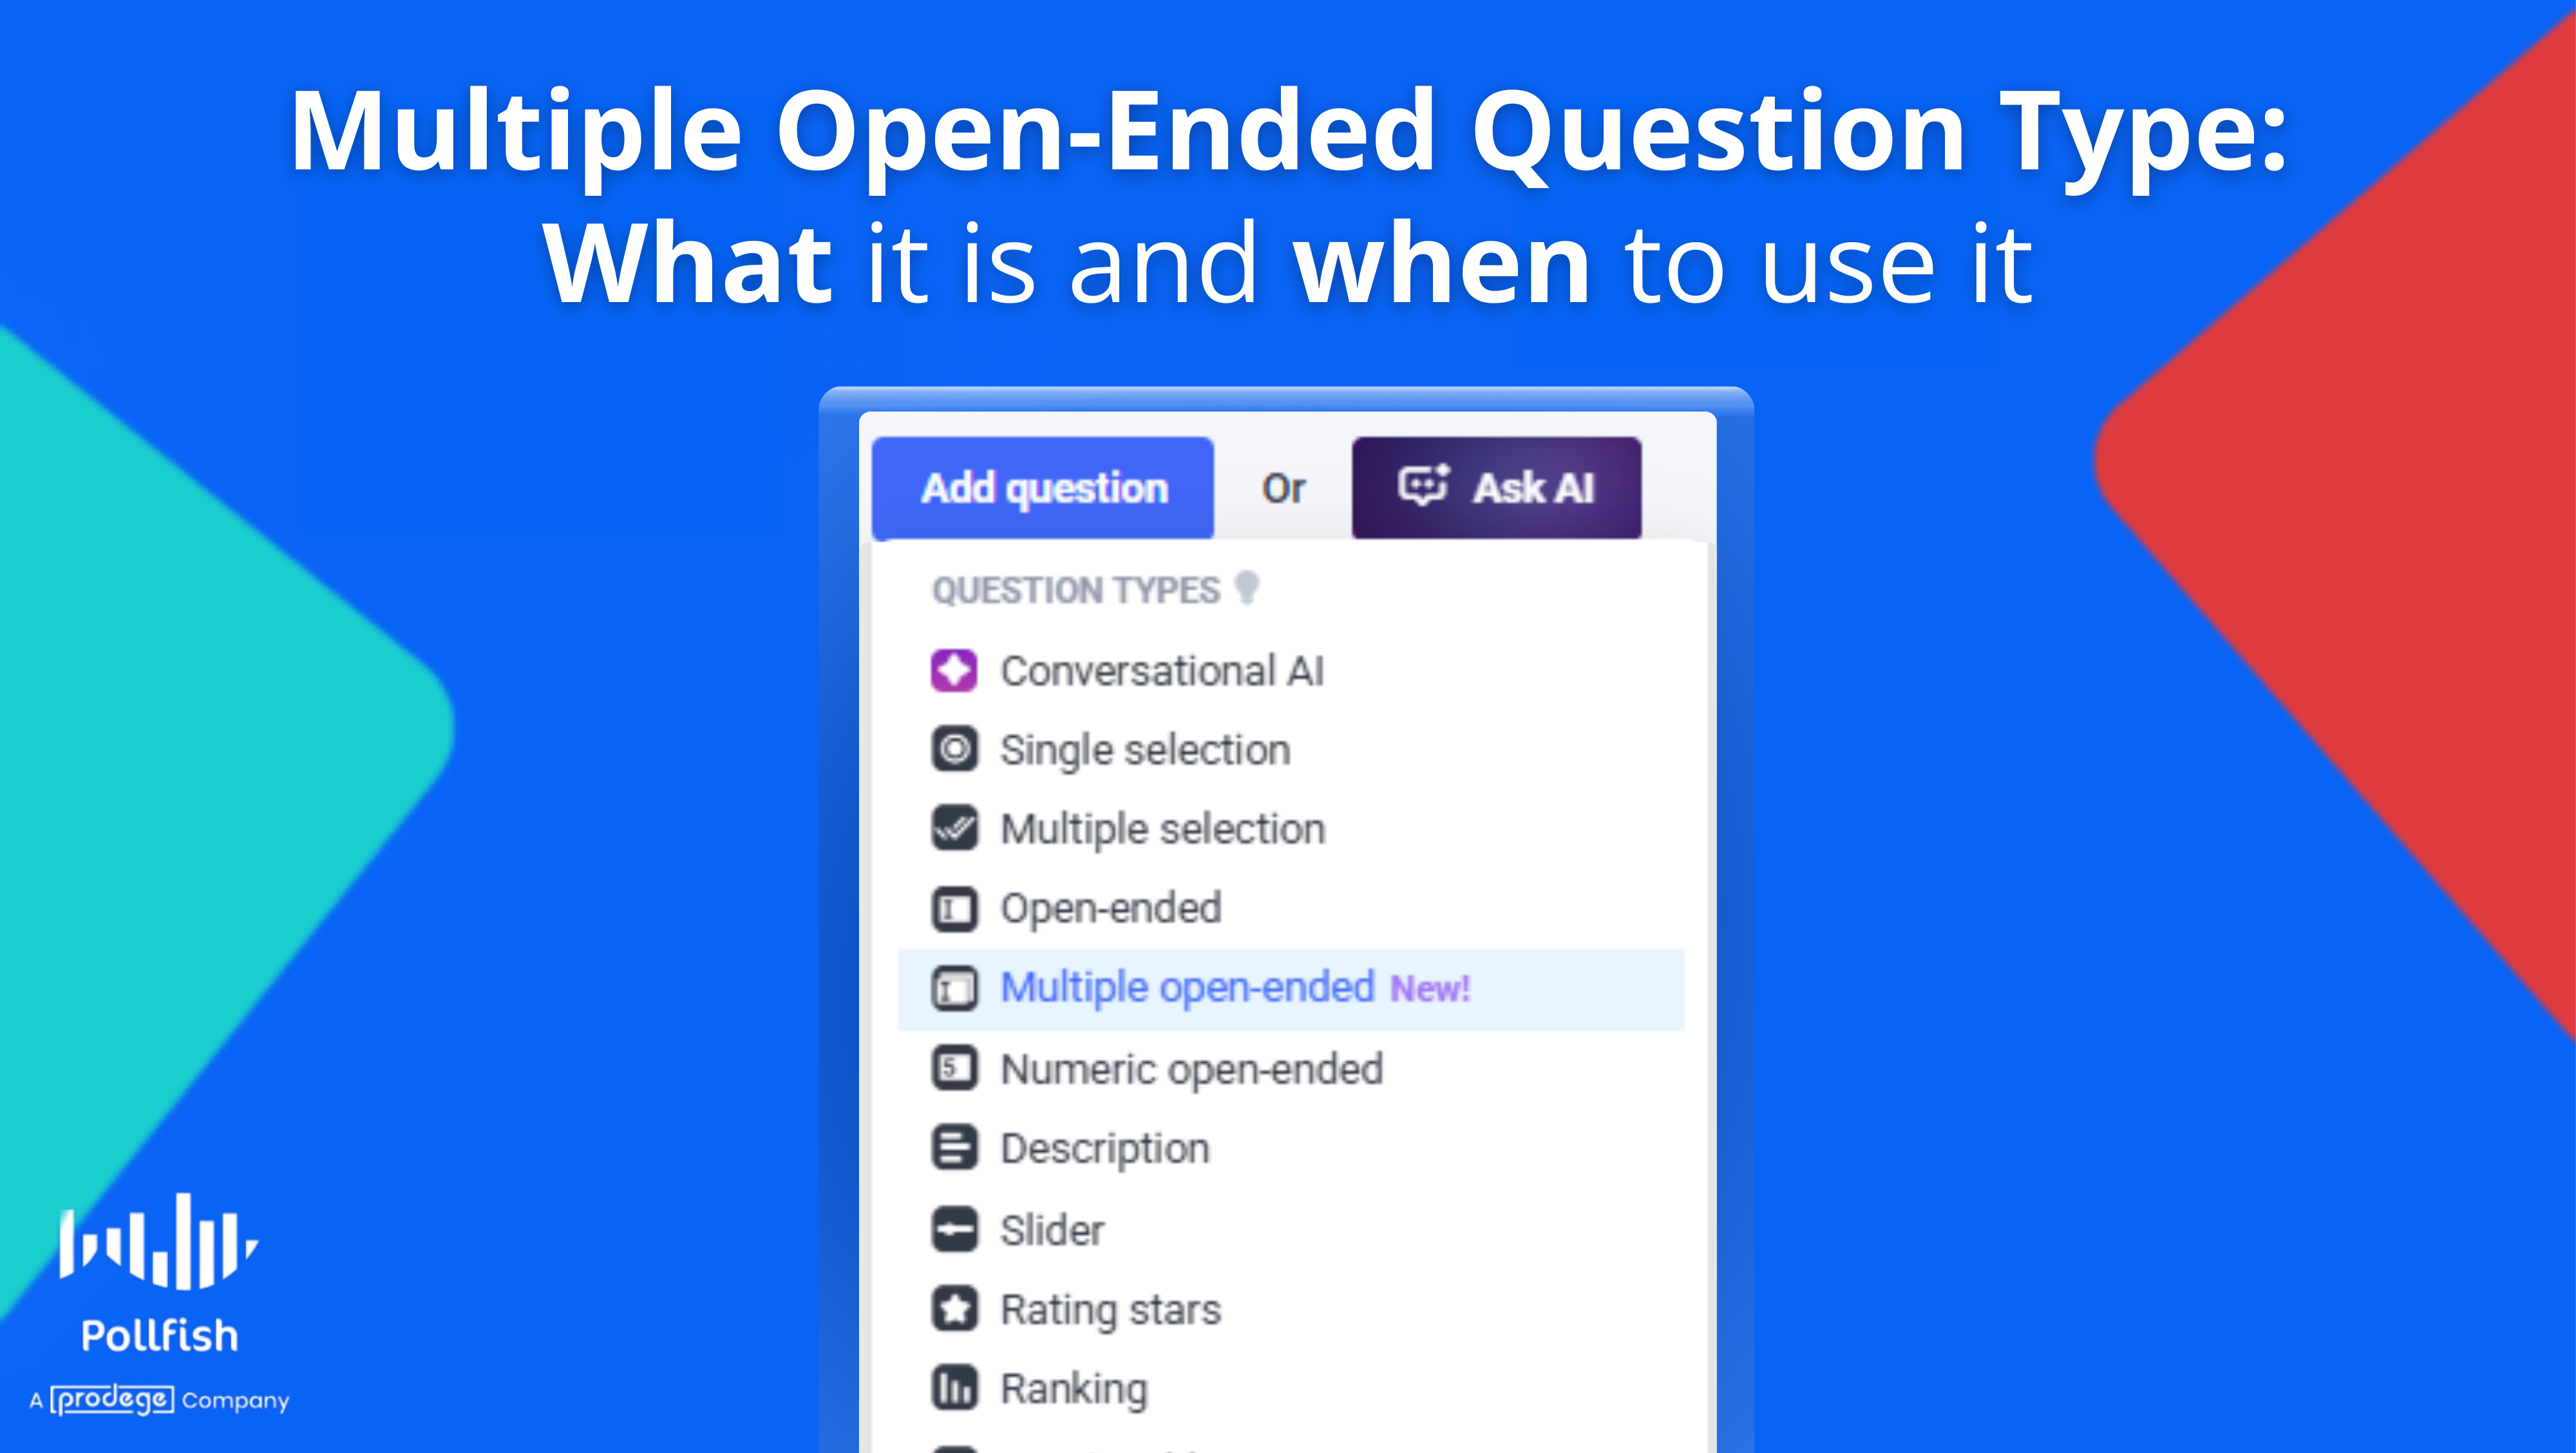
We’ve just launched the brand new Multiple Open-Ended question type on Pollfish - giving you more power to collect unstructured insights in a structured way.
Think of it as a matrix-style question, but instead of asking for ratings or numbers, you’re giving respondents the space to write out their thoughts. This makes it perfect for branding questions, concept feedback, and anything that benefits from qualitative input - all while keeping responses neatly organized.
What is a Multiple Open-Ended question?
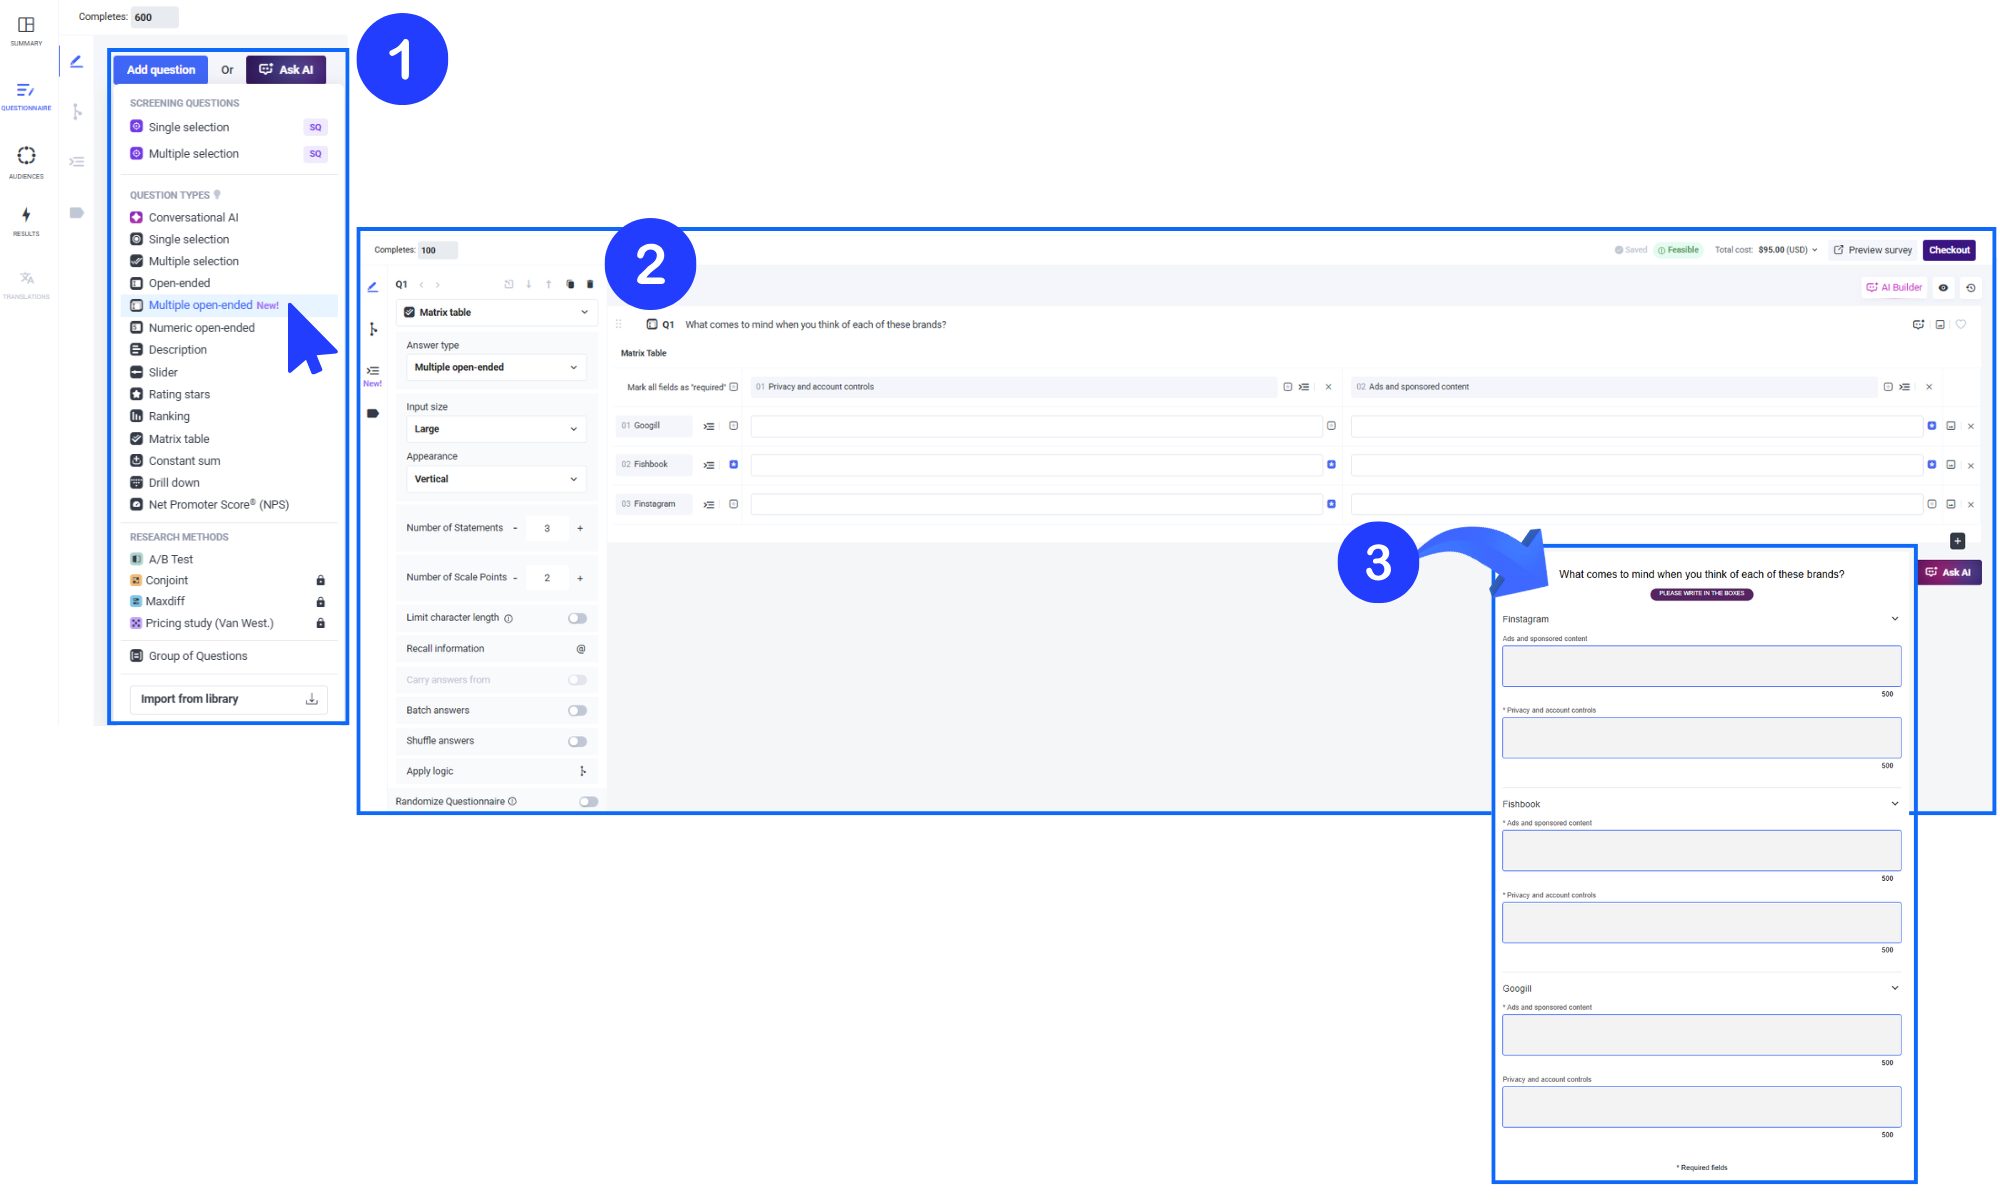
It’s a flexible matrix question where each cell is an open text field, not a number or scale. You set a main question, define statements (rows), and optionally scale points (columns) - and your respondents can type a response for each cell.
Why use it?
Let’s say you're a brand marketer and want to ask:
“What are your favorite cereal brands?”
Rather than just one long open-end field, you can break it down into 3 or more shorter fields. Or go deeper:
“Where do you like to shop?”
For Shoes: (3x open ends)
For clothing: (3x open ends)
etc
It’s structured and open. So you get specific feedback that’s easier to compare, without losing the nuance of free-text responses.
Key Features
Scale point labels are optional – Use them if you want column headers, skip them if not.
Statement labels required only when there’s more than one – Keep it clean and simple when needed.
Input field sizes – Choose from Small, Medium, or Large to match your question intent.
Orientation control – Display fields vertically or horizontally depending on layout preference.
Character limits – Set a min/max (2–500 characters) for each input field independently.
Matrix logic compatibility – Use carry forward, batch input, and answer shuffling just like with other matrix types.
When to use Multiple Open-Ends
We had clients ask us to develop this feature for use cases such as...
Brand recall: “What brands come to mind for each of these categories?”
Product feedback: “Tell us what you liked or disliked about each feature.”
Shopping habits: “List your go-to stores for each item below.”
Creative testing: “How would you describe each concept in one sentence?”
Ready to try it?
You’ll find Multiple Open-Ended questions under the question types button when you add a question to your next survey. Customize it to match your research needs and start gathering richer, more insightful feedback today.
Got questions? Drop us a line on the live chat or explore more how-tos at Pollfish School.
A New Data Visualization Tool for Surveys
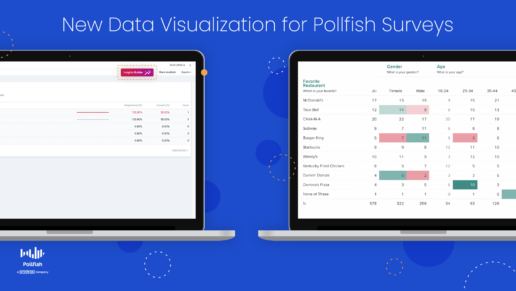
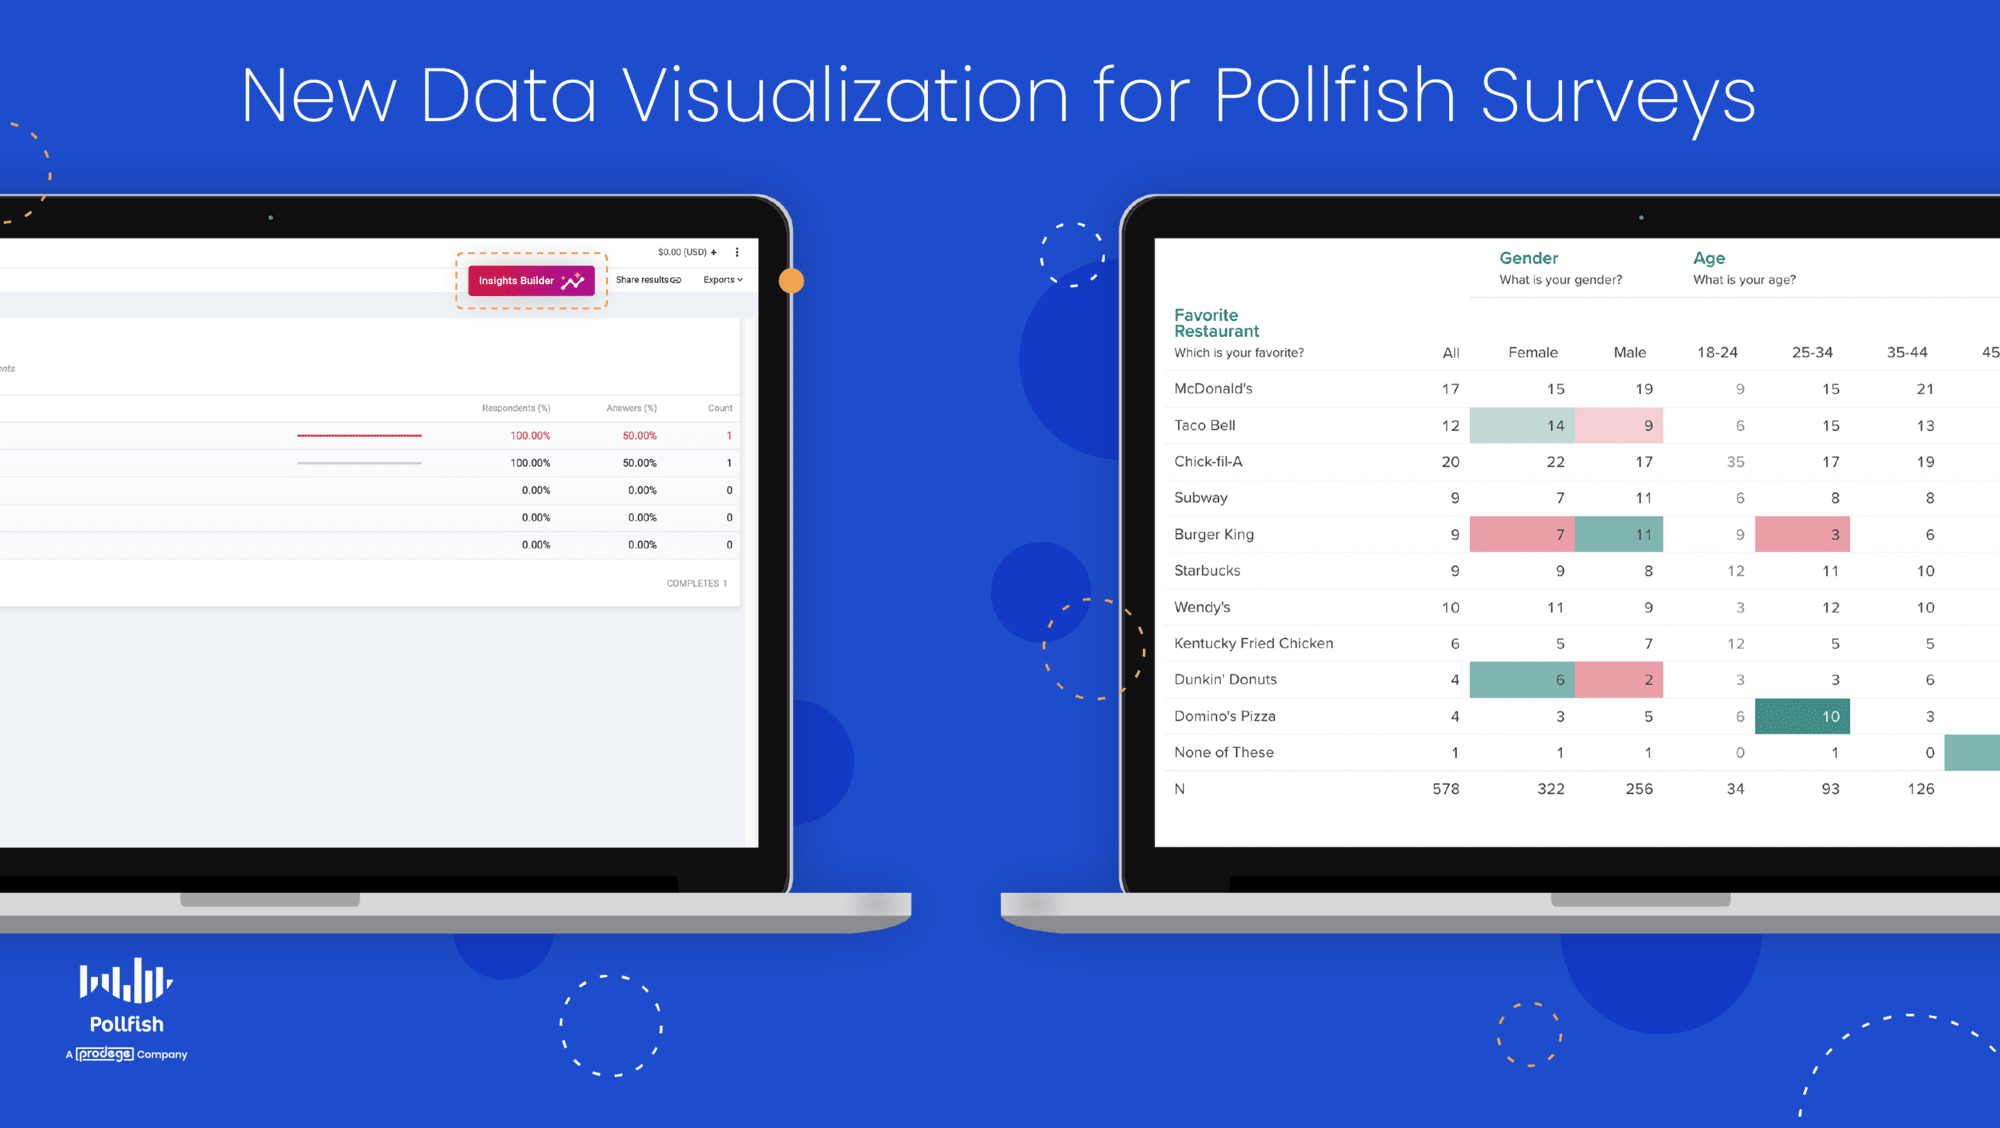
Meet Insights Builder, the New Data Visualization Tool for Pollfish Surveys
Want an easier, more colorful way to analyze and present your Pollfish survey data?
Look no further! With our new integration to the Prodege Insights Builder, you can enhance your survey analysis by adding valuable data visualization to your survey data.
Add Data Visualization with a Single Click.
Easily add data visualization to your next survey.
- Open a survey in your Pollfish dashboard.
- Click the “Insights Builder” button.
It really is that simple.
Analyze, Visualize, & Share Results.
With this new data visualization tool, you can:
- Analyze:
- Use a custom interactive online database to display key insights.
- Cross-tabulate, add filter logic, create new variables, apply stat testing.
- Visualize:
- Illustrate your business objectives clearly with visualization techniques.
- Craft rich and easily edited slide visuals in your organization's branding.
- Share:
- Collaborate with your team internally through Pollfish by sharing directly.
- Control access and broadly share with internal and external stakeholders.
How "Insights Builder" Works
Only researchers in the Elite plan can access the Insights Builder tool via the Pollfish interface.
The export to Insights Builder can be initiated per survey by the researchers, but not all surveys are automatically synced. Once initiated, all survey updates (new responses received, new revisions added, survey renames, etc.) are synced in real-time.
First-time survey export
For a survey that has not been synced to the data viz tool, the researcher can view the “Insights Builder” option on the survey menu and the results page. A new window will ask you to continue, which will then redirect you to a new tab, once you click it.
This action will:
- Place the survey data into the data visualization tool.
- Open a new tab in your browser; this will contain the data visualization folder created for a specific survey.
- This means you can return to Pollfish whenever you wish.
- It will authenticate you to the data visualization tool via your Pollfish account, seamlessly.
- You won’t be asked to log in with your credentials to Data Viz.
- The “Insights Builder” is an option available throughout the lifecycle of the survey (from the status of running to paused/ completed/ finished).
Viewing an exported survey:
- When a survey has been synced to the tool, you can view the “Insights Builder” option in the survey menu and on the results page.
- A loader screen will appear to redirect you to a new tab.
Get Started With Data Visualization Now
Ready to get started?
Log into your account and try it out!
Your support doesn't stop here. Prodege can provide additional support around leveraging data visualization with your Pollfish surveys and for all sorts of additional insights needs.
How to Leverage Data from Conjoint Analysis Exports
How to Leverage Data from Conjoint Analysis Exports

Let’s take another critical dive into conjoint analysis, a super informative market research feature that we released last year.
As you know, a Conjoint Analysis is a kind of tool and research technique that enables you to measure the value that consumers place on the individual features of a product or service.
This kind of analysis is particularly beneficial for product and pricing research, as it unveils a plethora of consumer preferences. You can then use this information to optimize your products and services.
In this article, we specifically focus on Conjoint Analysis exports on the Pollfish platform.
The Polfish market research platform generates optimized Excel, CSV and SPSS files that contain raw data, which you can use to form your own analyses and import the data from the tool to other software.
If you want to run your own Conjoint Analysis to compute and understand part-worth importance, you’ll need to use its export, as it contains raw data from your Conjoint Analysis.
This article teaches you how to do so.
1. How does Pollfish generate the Conjoint Analysis design?
The conceptual model of a conjoint analysis is pretty straightforward; it suggests that the utility of a multi-attributed product can be broken down into specific contributions of each attribute and their interactions.
The approach is easy to implement if the number of attributes is small. However, problems arise because of the large number of possible hypothetical alternatives for a given product.
For practical reasons, only a subset of possible alternatives is chosen for the study. To that end, experimental design methods exist for selecting good subsets of product configurations for performing the analysis.
Respondents will see a subset of possible options to choose from, which depends on the number of attributes and levels defined.
In order to do this, the Pollfish Conjoint algorithm first creates an orthogonal design of the alternatives (product bundles) that are formed by combining the levels of the attributes.
In the case that all possible combinations are more than 20, the total number of alternatives gets reduced using d and g optimality criteria.
Then choice sets are created, containing an upper limit of 5 alternatives each. The algorithms that we are using ensure the d-optimality of the choice-set design.
Finally, choice sets are assigned to blocks. One block cannot contain more than 30 choice sets.
The goal for our Pollfish Conjoint algorithm is to ensure that each level in each attribute appears the same number of times and that each alternative appears the same number of times in the design, so that the results have 0 bias and variance.
Each respondent gets assigned to only one block randomly. Blocks are distributed evenly to the audience, so that every choice set in the design is seen by the same number of respondents.
2. How is the Conjoint Analysis design distributed? Via the Pollfish algorithm based on Block Designs
A problem that usually arises when the choice-set design is ready to be administered to a target population is that the number of choice sets in the design may be too large for an individual to assess.
In these cases, a common technique is to partition the choice sets into blocks of equal size, in principle much smaller than the size of the original design, and then administer the blocks to the population.
That way, each individual would have to assess only the choice sets of one block, while collectively the population would assess all the choice sets of interest. However, in order for this partitioning to make sense, some constraints must be satisfied.
Each choice set should be evaluated by the same number of users. That means that each choice set should appear the same number of times into the blocks. Note that it is not necessary for a choice set to appear in all blocks. To that end, we may need to replicate the choice sets in order to always be able to divide them into blocks.
Formally speaking, the following equation should be satisfied: vr=bk
where v is the number of choice sets, and r is the replication factor of each choice set, is the number of blocks and is the size of each block, that is, how many choice sets each individual should see. Thus, given a choice-set design of size, we have to find the three smallest numbers () satisfying the above equality. Given these numbers, we can safely partition choice sets into blocks.
3. Understanding the Excel structure
The Excel (CSV and SPSS) file is a complementary feature of the visualized results at the Pollfish dashboard. It contains all responses given by each respondent of the survey. Graphs on the results page are based on these individuals' responses.
To take advantage of the Excel for a Conjoint Analysis or MaxDiff Analysis survey, visit the results page of a completed one, select “Export results” and choose “Excel” as your export option. You will be sent an email that notifies you when your export is complete. Open the document in Excel or Google Sheets to get started.
The Excel sheet will include the following two (among the other tabs):
- Experimental design tab: This tab contains the Conjoint or MaxDiff’s design, as generated by the Pollfish Conjoint algorithm.
- Individuals tab: This tab contains the selections given to the questions of the survey by each respondent.
For the case of the CSV and the SPSS, the experimental design comes in a separate file.

A. The Εxperimental Design Tab
Let’s assume that we have a Conjoint Analysis survey with the following attributes and levels, describing alternatives of detergents:

In the Excel tab, each component is listed in a column and has a unique ID. Blocks, their containing choice sets and alternatives(or “Concepts”) have their own IDs, as the following screen depicts.

For the specific example, the Pollfish algorithm will generate a design of 4 blocks of 5 choice sets each.


Each choice set contains 5 alternatives (or “Concepts”). Each row represents a generated alternative (or “Concept”), whose containing attribute levels’ columns are located after the “Concept” column (in our example of detergents Conjoint test, the attributes were 4: Type, Perfume, Quantity and Price).

The settings for the number of choice sets and the number of alternatives, are also displayed in the questionnaire while preparing the Conjoint survey:

B. Conjoint selections at the Individuals tab
Each respondent gets only one of the generated blocks. The blocks are evenly distributed across the sample, hence, a block may be received from many respondents.
In our example, from the 120 total sample, each group of 30 respondents will get one of the 4 blocks:
- 30 respondents receive the block with ID 257
- 30 respondents receive the block with ID 258
- 30 respondents receive the block with ID 259
- And 30 respondents receive the block with ID 260
At the Individuals tab, each row represents the responses given to the questions by a single respondent. Data related to the Conjoint Analysis are placed among the other questions contained in the survey and start with the column named “Block” which holds the block ID the respondent received.
Then the choice-set ID columns follow along with the selected alternative (or Concept) ID columns. The choice-set columns are ordered according to the order the respondent received them.
So, ChoiceSet0 ID holds the first choice-set ID the respondent got. Selected Concept 0 ID holds the respondent’s selected alternative ID(or Concept) in the first choice set and so forth until selections for all choice sets are provided in the tab.

C. Correlate the data at both tabs for further analysis
You do so by combining the following:
- the data from the Experimental design tab, which holds the content for each block and their included choice-sets
- the data from the Individuals tab, which hold the selections per respondent
You can then proceed by then analyzing the data in a different system.

How Pollfish Provides Quality Data and Prevents Survey Fraud (2023 Update)
How Pollfish Provides Quality Data and Prevents Survey Fraud (2023 Update)

Pollfish implements a variety of procedures to ensure the highest quality of data. Using a combination of proprietary techniques and machine learning technology, our platform, along with our team of technical experts prevent survey fraud at every turn.
When combined with our rigorous quality checks, our participant pool of over 800M+ enables us to discard responses that don’t meet our quality standards — without sacrificing the sample size. As such, no question is subject to survey fraud, as the Pollfish platform stamps out inaccurate or poor quality responses.
As a result, we deliver higher quality data than our less-selective, panel-based counterparts.
What is Survey Fraud?
Survey fraud, or market research fraud is the adverse phenomenon that occurs when survey respondents submit fraudulent or bogus responses. This can occur accidentally, such as when responders undergo survey fatigue, or purposefully.
What would prompt a responder to partake in the latter? They can be your competitors (especially if the survey mentions your brand or makes it apparent that it is conducted by your brand), bots, click farms, or respondents eager to finish the survey to receive an incentive.
Thus, there are a number of ways respondents can contribute to survey fraud, such:
- Providing nonsensical, i.e., gibberish answers
- Breaking rules
- Answering suspiciously quickly
- Hiding their IP address via the use of a VPN
- Leaving one-word responses in open-ended questions that ask for an in-depth answer
- Flatlining
In regards to the latter, remember the old advice to “just choose B” all the way through if you didn’t study for a test? That would result in an “F” from us. Participants that choose the same answer repeatedly, try to take the same survey again, or attempt to submit multiple surveys in quick succession don’t pass our test.
Natural Language Processing for Open-Ended Answers (New Feature 2023)
Respondent Verification
We further verify by checking ahead for duplicated IDs via IP or MAC addresses, Google Advertising and mobile device identifiers, and we work with our manually vetted publishers to send unique IDs as an added layer of protection. In-survey questions are designed to add another layer of security against survey fraud, such as requesting an answer to a simple math equation or including identical questions within a survey with the response options re-ordered to verify answer consistency.
Zero Tolerance For Bots
In addition, we have zero tolerance for bot-friendly VPNs, incomplete surveys, or other suspicious activities. We reject responses from any behavior we deem questionable—anything from answering open-ended questions with nonsense to attempting to sign in from multiple countries at once. We’re even alerted if respondents are spending an inappropriate amount of time across questions within the survey.
Rigid Adherence to Targeting
Our data quality is second to none. As such, we’re skeptical of just about everyone, and that’s what makes us the best at what we do. Accuracy is our top priority, which is why we are so critical of our sources and their behavior. In fact, we only include respondents that match 100% of the targeting criteria, even if there was nothing fraudulent about their responses. This includes surveys with multiple audiences, as well as those with stringent respondent qualifications, such as specific answers to screening questions. Our combination of technology and expertise ensures the delivery of the highest quality data to our customers—every survey, every time.
Multiple Layers of Quality Checks
Pollfish supports multiple other layers of quality checks. This is an ongoing process since both the platform and our technical experts continuously work to avoid survey fraud while fetching the preset amount of required survey completions with the correct targeting. There are several layers that we use to improve the data quality. These include:
The Technical layer:
- Includes various checks to ensure first-rate data. Hasty answers check: catches respondents who answer faster than the average time required to read the actual questions.
- Reset ID Check: Occurs when the responder answered the same survey previously, but with a different device to avoid the same respondent from partaking more than once.
- Gibberish Check: When the given answers contain text that is considered gibberish, ex: “dsfjkn dfnksj ifjodf”.
- Same IP Participation: Checks if a survey has been completed before within a certain time from the same IP address of the respondent’s device.
- Carrier Consistency: Assures that the carrier of the respondent is contained in the targeting market.
- VPN: VPN users are automatically disqualified from survey participation.
Quality Questions & Responses
Our platform is designed so that your questionnaire is bound to receive quality responses. In order for it to do so, aside from post-answer quality checks, we provide quality answer triggers. Our quality questions include: trap, red herring and attention questions.
- Trap questions: Checks that respondents are paying attention to a command, usually one that asks to select a negative response. Responders with acquiescence bias, or those who choose positive responses will be caught.
- Ex: Please select "Somewhat Disagree" below
- Strongly Agree
- Somewhat Agree
- Somewhat Disagree
- Strongly Disagree
- Ex: Please select "Somewhat Disagree" below
- Red Herring Questions: These check if the respondent is engaged with the survey, tracking how logically they answer oddball questions.
- Which of the following is not a sport?
- Soccer
- Basketball
- Cookies
- Baseball
- Which of the following is not a sport?
- Quality Questions: Checks if respondents are reading and comprehending the question, much like red herring questions.
- Ex: Which of the following does not have wheels?
- Bike
- Car
- Skateboard
- Elephant
- Cart
- Ex: Which of the following does not have wheels?
These are injected within various components in the survey flow depending on each survey’s type to check if the respondents pay attention. Those quality questions are also used in Demographic surveys. If the respondent fails to answer a quality question, a reverse counter is displayed.
Finally, we also check for response quality by banning respondents who provide insufficient quality data from the network. Additionally, our system uses an audit to validate open-ended data to ensure that respondents do not provide inadequate responses. We also have installed a function that wards off copy-pasted answers in open-ended questions and others.

What Is a Market Research Agency and Do You Need One?
What Is a Market Research Agency and Do You Need One?

When it comes to conducting market research, you may have come upon the term market research agency.
Nowadays, there are agencies for virtually all industries, so it is unsurprising that they exist in the research space. As such, using this kind of agency is one of the many available market research techniques.
The market research industry has more than doubled in revenue since 2008, exceeding $76.4 billion in 2022.
US market research companies have been dominating this space, as they generated over $47 billion dollars in revenue. This means that market research companies in the US yield more than half of the total revenue of the market research industry globally.
But what exactly is this kind of agency in the realm of market research? And how do you know if you may need to utilize its services?
Perhaps, you may need its services, but can make better use of a different method to conduct research on your consumers.
This article expounds on the premise of the market research agency, and its four main types, and compares it with another major method of conducting research to help you determine if you need it.
Defining a Market Research Agency
This is a kind of agency that offers various market research services to its clients. It is made up of a core group of researchers and administrators.
This kind of agency can conduct either quantitative market research and qualitative market research. It may also offer both kinds of research.
These agencies will approach market research in their own manner. Thus, they may offer a specific service, or various services. As such, market research agencies may provide the following services:
- A series of interviews
- Consultancy services
- Workshops
- Focus groups
- A survey campaign
(See the below section to better understand the four main types of these agencies).
A market research agency can exist in the form of a single company, a division of a company, or even an individual who specializes in carrying out market research campaigns.
Such an agency can take different approaches to research, such as a full-service process, fieldwork or only data analysis.
It typically works by gathering and analyzing information about your customers, competitors, vendors and distributors and other people and forces in your industry.
Most of these firms provide services that are commissioned by companies for particular purposes. Many also collect data beforehand and then attempt to sell it to interested parties. Because of this, these firms are part of syndicated research.
The Four Main Types of Market Research Agencies
There are four main types of market research firms. They differ based on the services they focus on and offer to their clients. Understanding these four major forms will allow you to decide whether you need this form of research, along with what specific services are most important for your research endeavors.
Field Service Agency
This kind of agency conducts research with your target market. Focused on data collection, it engages customers at the ground level to gain insights based on a specific question. The methodology it uses involves surveys, interviews, focus groups, observation, and other data collection methods.
The “field” in this agency refers to the act of engaging respondents itself and collecting data.
A field service agency doesn’t design research campaigns or analyze the findings of the research. Their area of focus is specifically on gathering and documenting data.
Also referred to as a fieldwork firm, this agency is typically commissioned by other market researchers that have already begun a research study and use the firm to get data to back up their research.
The field service agency sends the data to the researchers, so that they can then apply it to their studies.
Intercept and Mystery Shopper Agencies
These agencies are specialized field service firms that collect data via real-life interactions with customers. This involves face-to-face interaction with respondents for intercepts along with disguising participants as shoppers who observe customers through mystery shopping.

Mystery shopper firms collect and measure mock customer experience by having participants working as if they were actually paying customers in a transactional environment.
In this way, the firm researches how typical customers of a business experience its brand. The mystery shoppers collect valuable data that can help businesses alter their services and frontline interactions to meet consumer preferences and needs.
This type of market research is useful for brands that seek to observe in-the-moment reactions and engagement of their customers. This is also useful if you’d like to see if the location of business dealings affects the customer experience.
This type of firm may also rely on online intercept tools with mobile availability given the presence of market research tools in the digital world.
Research Report Purveyor
This type of agency aggregates and assembles market research on particular industries, demographics, psychographics and market trends. This tends to include conducting secondary research, or buying data from the other types of agencies aforementioned.
The purveyors put together reports for businesses interested in the data they gathered. A syndicated research approach, the reports from the original study were self-funded using indications that the information will be of interest to different buyers in an industry.
This type of agency is best suited for businesses or other research firms that need broader market data and don’t have the time or resources to invest in custom research.
Full-Service Agency
As its name suggests, this type of agency supplies end-to-end, customized market research services. These services can include the following:
- Identify the research problem to be solved.
- Determine a viable research design.
- Prepare the methods and tools to use in the research study
- These typically involve both online and offline activity such as respondent sampling, survey data collection, various analyses, such as a customer behavior analysis and reporting.
- Implement the insights that were garnered.
- Prepare reports of the findings.
A full-service research firm is often used as a consultant, given that it may also implement the collected data due to the demand for actionable outcomes. In this way, the research is simply a means to other business-related activities they provide.
DIY Survey Research: A Market Research Agency Alternative
When it comes to market research agencies, most businesses and researchers typically use one type of agency or approach, rather than two or more, as this can be expensive and not worth the hassle.
However, some also choose to pair a market research firm with the DIY survey approach. That’s because surveys are invaluable tools of customer insights. Moreover, they can be used to research virtually any audience. That’s why some research firms conduct them.
However, conducting DIY market research is more ideal than relying on a third party to conduct the survey research for you. While surveys offer colossal support, they are only as useful as you make them.

That’s because when you rely on other companies to run your survey campaign, they wield full control over the direction of the survey campaign, including its specific questions and target audience.
It is therefore far more optimal to conduct market research yourself with a DIY survey platform. Such a platform would grant you full control over every aspect of your market research campaign. You can customize it to your liking in various ways, including:
- The targeting criteria
- The screener questions
- Adding multiple audiences
- The questionnaire
- All of the question types
- The wording of the questions
- The order and logic paths of the questions
- The thank you note and introduction
- The dashboard
- This includes the survey results dashboard, which you can filter
- You can choose your own imports and visualizations
We recommend using survey research to accompany any market research agency you use to conduct your research campaigns. Specifically, we recommend using a multi-functional survey platform, one that not only creates and deploys surveys, but enables you to carry out various market research efforts, such as conducting a conjoint analysis, pricing research, A/B testing and more.
With such a survey platform, you will get a holistic market research approach, as it allows you to deploy a multitude of survey types, research different business matters and even perform other market research practices.
Because of this, a strong survey platform allows you to replace or entirely forgo using a market research agency. After all, conducting your own surveys is cheaper, faster and more relevant to your particular research needs.
Getting Market Research Right
As per the verdict of this article, it is useful to rely on both market research firms, along with a DIY survey platform.
You can even abandon using a research agency entirely, as survey research grants you all the relevant information for your survey campaign in a timely manner.
However, the efficacy of your survey campaign is highly dependent on the platform you use. You wouldn’t want to gain slow or subpar data.
You should therefore select your market research platform carefully. A strong market research company will allow you to fulfill all of your online market research activities. This includes all the activities mentioned in this article and beyond.
The Pollfish online survey platform allows you to create a thorough survey data collection, one you can customize to your liking, view however you choose and organize to the max.
We offer an advanced method to distribute your survey to millions of random users online via the organic sampling method.
Random Device Engagement (RDE) is a kind of polling that relies on advertising networks and other digital portals on devices, to engage random people where they are, voluntarily.
This way, they won’t feel pressured to answer in a particular way, as survey panelists would, as they are completely anonymous and randomized.
Researchers can reap a wide breadth of information on their respondents and access a wide pool of insights in their survey results dashboard.
We also offer the advanced skip logic feature, which routes respondents to relevant follow-up questions based on their previous answers.
In addition, you can send your survey to specific respondents and on specific digital spaces, by simply using the Distribution link feature. This allows you to post your survey anywhere you wish, along with emailing it to those you want to research.
With such a multi-functional platform, you’ll be able to conduct any market research campaign and gain high-quality data which you can use to take action.
Enrich Your Branding Research with Brand Awareness Survey Questions
Enrich Your Branding Research with Brand Awareness Survey Questions

You’ll need to have a solid collection of brand awareness survey questions in order to run a successful brand awareness survey.
An ideal survey would include a plethora of insights that allow you to gauge how well your target market is able to recognize your brand, along with the degree to which they know of its existence.
We can’t stress the importance of brand awareness enough. Take, for example, the fact that nearly half of all customers tend to buy from familiar brands, at 46%.
Thus, you surely wouldn’t want your products to fall by the wayside due to their lack of recognizability. Instead, you should strive to gain as much brand awareness as possible for all members of your target market and customer personas.
Brand awareness is also a stepping stone to brand trust. Once again, almost half of customers better patronage a brand they trust. That’s because 46% of customers would pay more for a brand they trust.
The more customers recognize, recall, and believe in your brand, the more they will buy from you, growing your retention rate and pool of loyal customers.
Thus, start by creating a strong brand awareness survey with the right questions.
This article lays out a variety of different types of useful brand awareness survey questions and their examples, which you should include in your survey.
The Main Types of Brand Awareness Survey Questions
There is much more to brand awareness than knowing whether or not a brand exists. As such, there are different types of brand awareness questions you can use in such a survey.
You should know each kind — and not merely categorize them. By understanding each type of brand awareness question, you’ll be able to easily ideate them for all your surveys. You’ll also be able to better understand the kind of awareness campaign you’re running.
Let’s first recap on the basics: what is a brand awareness survey?
This is a type of questionnaire that measures how aware your target audience is of your brand in your industry and how it is perceived. There are four major areas that make up this type of survey, as there are four main aspects of brand awareness.
Because of this, you can probably infer that there are four main types of brand awareness survey questions. The thematic makeup of these four question types will guide the types of questions you create.
Here are the four main types of brand awareness survey questions:
- Brand recognition:
- This is a measurement of how familiar your customers are with your brand.
- Brand recall:
- This is the practice of finding out if your brand spontaneously comes to customers’ minds when they think about your product or service.
- Brand identity:
- This seeks to reveal whether customers know about your mission and vision, how well they understand them, and how well they can recognize them.
- Brand image:
- This involves all the associations and ideas people think of when they think about your brand.
With these question types in tow, you have already devised a major part of your survey questions. Consider these types when coming up with your questions, so that you stay organized and understand what aspect of brand awareness exactly you are researching.
Brand Recognition Questions:
- Have you heard of [your brand]?
- Question Type: Yes or no
- How long have you known about [your brand]?
- Question Type: Multiple choice
- Use only if the respondent said yes to the previous question
- Which of the following products does [your brand] offer?
- Question Type: Multiple choice, multimedia elements
- Answers: Options should be the specific products you sell, as well as general products to determine if customers truly know what you sell.
- Where can I buy products/services from [your brand]?
- Question Type: Multiple choice, multiple selection
- Answers: Provide a list of places (including places online) to determine if customers know where and how to purchase from you.
- What do you know about [your brand]?
- Question Type: Multiple choice, single or multiple selection
- Answers: Provide various key facts about your brand and its offerings to see what customers know about it and where you can improve in having them recognize your brand.
Brand Recall Questions:

- What is the first brand you think of when thinking of [product type]?
- Question Type: Multiple choice or open-ended
- Answers: With a multiple choice set, use your competitors along with your brand.
- An open ended field, however, will allow respondents to enter in a brand unaided (chosen entirely on their own as opposed to seeing it as one of the answers). It will also give you the chance to learn about competitors you didn’t know about.
- Why is this the first brand would you consider using when you have [a particular problem that your products solve]?
- Question Type: Multiple choice, multiple selection and open-ended
- Answers: With a multiple choice set, use your competitors along with your brand.
- Again, an open-ended field will allow respondents to list a brand or brands you may have not known about.
- What companies spring to mind when you think of [your industry]?
- Question Type: Multiple choice, multiple selection
- Answers: Use a variety of well-known brands in your answers, along with yours.
- You may also gradually ask about lesser known brands as well.
- Which of the following products would you think of buying first for [a particular problem]?
- Question Type: Multiple choice, single selection
- Answers: These should be of real products including one of yours and the rest of your competitors.
- Which brands from the following list sell [a product in your industry]?
- Question Type: Multiple choice, single selection
- Answers: These should be of real products including one of yours and the rest of your competitors.
- This is aided brand recall, as it asks if respondents recognize your brand from a list of other naemd brands.
Brand Identity Questions:
- Is your brand committed to fighting for or supporting any cause or mission?
- Question Type: Yes or no
- Which causes/values is [your brand] committed to or strongly upholds?
- Question Type: Multiple choice, single or multiple selection
- Answers: Use only if the respondent chose “yes” in the previous question.
- Use a variety of key values or specific causes that your brand strives to uphold and support.
- What ideas/causes do you associate with [your brand]?
- Question Type: Multiple choice, single or multiple selection
- Answers: Use a variety of associations with your brand, along with several that aren’t part of its identity.
- What areas is [your brand] involved in?
- Question Type: Multiple choice, single or multiple selection
- Answers: This can also be any associations you choose, from social causes, to cultures, to regions, etc.
- How well would you rate [your brand’s] commitment to the [social, environmental, other causes/mission]?
- Question Type: Multiple choice, Likert scale question
- Answers: A Likert scale of “extremely well” to “extremely poorly.” This goes beyond recognizing your mission and values, as it allows respondents to rate your performance in regards to them.
Brand Image Questions:

- What style do you think of, when you think of [your brand]?
- Question Type: Multiple choice, single or multiple selection
- Answers: Use a variety of stylistic references that closely describe you, that somewhat accurately describe you, along with those that don’t.
- What parts of [your brand] do we do particularly well/ that you like?
- Question Type: Multiple choice, multiple selection
- Answers: Use a variety of positive aspects you feel to be true about your brand to see whether they are also felt by your respondents.
- How would you describe the feel of [your brand/ a particular product you sell]?
- Question Type: Multiple choice, multiple selection or open-ended
- Answers: Use a variety of adjectives or adjectival phrases about your brand (not all positive) to see which ones customers associate with your brand.
- An open-ended field gives respondents the opportunity to describe what images and associations your brand evokes.
- Which brand comes to mind when you think of [a particular style or quality]?
- Question Type: Multiple choice, single selection or open-ended
- Answers: Use a style or quality you hope people associate with your brand in the question.
- An open-ended option allows respondents to include brands you may not have known about.
- Which qualities do you believe describe [your brand?}
- Question Type: Multiple choice, multiple selection or open-ended
- Answers: Offer a variety of qualities and portrayals — this includes both positive and negative answer options.
- An open-ended option allows respondents to answer more accurately about what they associate with your brand.
Surpassing All Your Brand Awareness Goals
Whether you want to increase your brand awareness or simply measure it, you should regularly conduct brand awareness surveys. You can customize these surveys to your liking and include even more granular questions than those mentioned above.
The key is to use a strong online survey platform, as not all market research platforms offer the same capabilities and customer support.
Use a survey platform that allows you to easily target your survey audience, create your questionnaire and deploy it to the masses (or to specific people).
Luckily, Pollfish facilitates all three of these critical aspects in the survey creation and distribution process.
That’s because we offer two methods of survey distribution: deploying surveys across a large network of random internet users in their natural digital environments via our Random Device Engagement (RDE) method, as well as allowing you to target specific customers with the Distribution Link feature.
Additionally, Pollfish survey software allows you to create and analyze a thorough survey data collection, one you can customize as you see fit, view however you please and organize to the max.
In addition, with our vast array of question types, you can create virtually any type of online market research survey to support your research campaigns.
Researchers can leverage a wide range of information on their respondents by accessing a wide pool of insights in their survey results dashboard.
With this advanced market research platform, you can measure and increase your brand awareness with ease and at speed.
Why Surveys Are the Best Market Research Tool
Why Surveys Are the Best Market Research Tool

If you’re contemplating how to find the best market research tool, look no further than the survey.
This tool can be deployed to the masses instantly and uncover scores of critical information about your customers.
We’re of course discussing the online market research survey, rather than its non-digital counterparts available in offline market research.
That’s because online surveys offer a wealth of benefits that offline varieties, such as snail mail surveys, simply can’t match.
Surveys are a “nice to have” auxiliary. They reveal a wide breadth of insights about your customers and how they feel about your products and industry at large.
With this insight, you can improve your customer experience. 72% of customers will share a positive experience with 6 or more people, thus granting you free brand awareness and marketing.
Despite the critical insights businesses can access, only 25% of businesses last 15 years or more. Clearly, failing businesses are lacking customer insights and need survey research.
This article addresses why surveys are objectively the best market research tool in online market research and in their entirety.
Surveys Are the Best Market Research Tool: Campaigns They Support
One of the strongest abilities of conducting online research is that it can support a wide variety of business campaigns. This includes aspects of all areas of your business, as your customers affect it beyond the scope of marketing and selling.
While there are too many to list, here are some of the major campaigns and macro-applications this kind of research supports:
- Early business ventures
- Before you found and build any new business, you’ll need to know whether your idea is viable within your industry and niche.
- You will need to create a business plan as a framework for all your new business endeavors. Check out how to do market research for a business plan,
- Concept testing
- This practice is critical to conduct before you introduce new products to your industry.
- Engage in testing a variety of concepts to see which resonates the most with your target market, along with which has the highest demand.
- You can also use it to ask customers themselves to pitch concept ideas for products and services.
- Customer development
- This refers to the mid-portion of the lean startup model, which is designed to tackle the problems in product development.
- It requires to first fully evaluate a product opportunity and then ensure that the solution you propose will meet market demand and customer needs.
- Advertising research
- This is used to gain insights into the effectiveness of past and ongoing advertising campaigns, as well as to help brainstorm new ones.
- You can conduct A/B tests on ads, run surveys, view existing ads in a similar business and more.
- Brand tracking
- Gauge the performance of your brand-building efforts, such as brand reputation, awareness and perception against key metrics.
- The brand tracking survey is one of the simplest and most accurate sources for keeping track of your brand health.
- Consumer analysis
- Create a customer analysis, as understanding your customers is the core of market research.
- There are various online approaches to establish this, including secondary and primary sources, which you can use to build your analysis.
- Purchase frequency
- Use a specialized analysis, such as the RFM analysis, to learn about customer buying behavior, preferences and how frequently they buy.
- Conducting online research can also help you increase your purchase frequency.
- Customer satisfaction
- Satisfy your customers by understanding how they perceive your products, services and overall experience (CX).
- Surveys help you test your customer support and engagement sessions.
- Business relationships
- You can improve your business relationships by learning how your business customers, vendors and partners feel about working with you, and what they seek from the industry at large.
- You can do so via B2B surveys
- Learn how to lower bounce rate
- You’ll ideally want to lower your bounce rate and determine what your site visitors seek and don’t will help do so via survey research.
- This involves managing your site’s UX and user-friendliness.
- Conduct global studies
- The right platform will make it easy to conduct global market research.
- You’ll need to appeal to customers abroad and thus, go beyond the ability to serve them.
- Survey research will help you understand their cultures and norms to better market to them.
- Branding Initiatives
- Surveys allow you to understand how your customers feel about your branding initiatives, whether it is a new slogan, value proposition or overall image.
- You can even conduct logo testing with survey campaigns.
- Market segmentation
- Understand the makeup of your target market by segmenting its various groups via market segmentation.
- Learn about the existence of customer groups in depth, along with your customer personas.
- Product satisfaction
- You can determine how your customers perceive your products before or after a product goes to market.
- Surveys enable you to measure satisfaction through various question types.
Key Benefits that Make Surveys the Best Market Research Tool
Aside from allowing you to conduct research campaigns on a wide spectrum of business applications, topics and undertakings, surveys are the best market research tools because they offer a variety of other benefits.
The following explores some of the foremost benefits that surveys offer to researchers across industries.
1. Representing the views of many with one method
Surveys allow you to accumulate the responses of a large number of people in your target market, or survey target audience. In doing so, surveys enable you to get representative views of a wide swath of people.
Rather than having to find multiple ways to conduct primary research on your audience, surveys empower you to do so through just one means and one tool: the survey itself. What you can do with your survey, however, depends on your survey platform.
With surveys, you can obtain key statistics, as well as the representation of individual views and experiences. In this way, you can conduct both quantitative market research and qualitative market research.
That’s because you can create a multitude of multiple-choice questions, or ask a few in-depth one-ended questions to your respondents. You can even intermix both approaches into one survey.
At any rate, surveys are your one-stop shop for gaining insights into all your customers' perceptions, thoughts, needs and views.
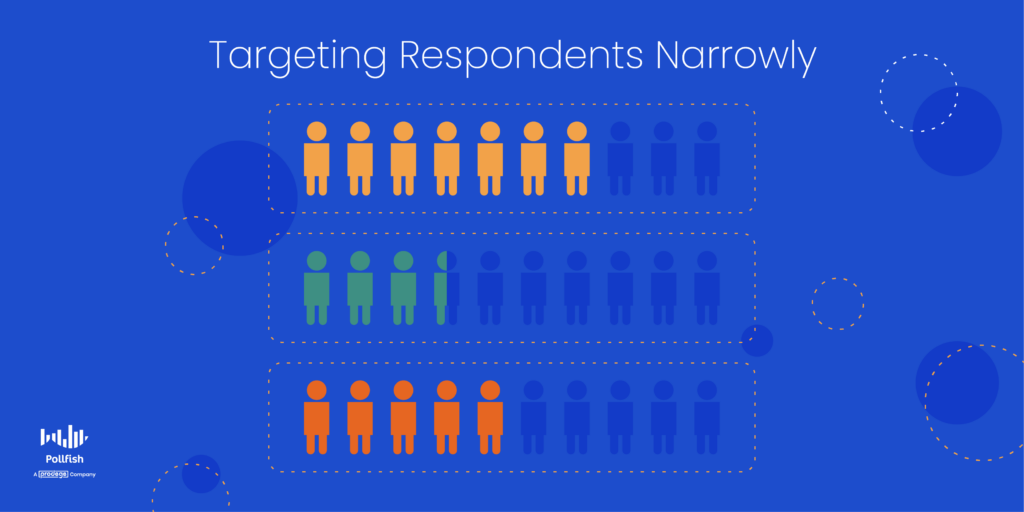
2. Narrow respondent targeting
Surveys are multifaceted; they don’t just involve the questionnaire portion.
Targeting is another critical aspect of surveys, often the very first you’ll need to work with. You’ll need to set in specific respondent qualifications in order for your survey to target the correct people.
By doing so, those that don’t fit your respondents' qualifications will be disqualified, thus their surveys won’t be used in your target market sample.
A strong survey provider will include narrow targeting, meaning that you can target respondents on a much wider variety of categories than just age, gender and location.
Instead, your survey should allow you to target participants using the following categories:
- Ethnicity
- Household income
- Marital status
- Employment status
- Number of children
- Organization
- Mobile usage criteria
- Geolocation criteria
- Country, region, state, county, city, US census region, postal code, etc.
In addition, your survey should allow you to include screening questions, in which respondents will gain entry into your survey only if they answer the questions in a particular way or with a certain response.
3. Worldwide reach
Globalization and a connected global economy have made more companies shift their focus to markets abroad.
Thus, you should conduct research on your international customers. Conducting surveys makes this possible.
Your survey provider should make it easy to research customers from around the world without hassle. With Pollfish, you can conduct global market research, as the platform reaches respondents in over 160 countries.
In addition, Pollfish doesn’t charge you more for conducting surveys in different countries.
Our survey translations feature makes it easy to understand international data, as it will likely be in a language other than English. The feature allows you to translate all the languages supported by Google Translate.
It would be nearly impossible to conduct global research without the use of an online survey platform.
4. A variety of options to customize your questionnaire
Surveys allow you to be flexible in the type of survey studies you launch, and not in just the topic of the survey. Thus, you can customize your questionnaire by adding a variety of question types.
A strong platform will be able to support various types of survey questions. This includes the following:
- Single Selection
- Multiple Selection
- Matrix Question
- Drill down question
- Open-ended
- Slider
- Ranking
- Net Promoter Score (NPS)
- Rating stars
- Numeric open-ended
You can also customize your questionnaire by adding advanced skip logic. This creates question paths for different respondents based on how they answer certain questions. Logic routes respondents to relevant follow-up questions based on their previous answers.
In addition, you can make your questionnaire unique with a variety of survey templates for different campaigns. For example, Pollfish offers templates on brand awareness, advertising testing and many other topics.
5. The ability to study any topic or support any campaign
This can be done by adding the aforementioned survey templates, which set the questionnaire by way of a topic and its accompanying questions.
You can modify these templates to your liking, by either editing the questions, removing them, adding new ones and changing their order.
You can also study topics that are more unpleasant to discuss. Thus, these would be increasingly difficult to include in in-person and even phone interviews or in a focus group.
Surveys facilitate this type of campaign by providing full anonymity to respondents, as well as providing ease of adding sensitive questions. These include a variety of subjects that respondents would otherwise feel awkward or uncomfortable sharing their thoughts on.
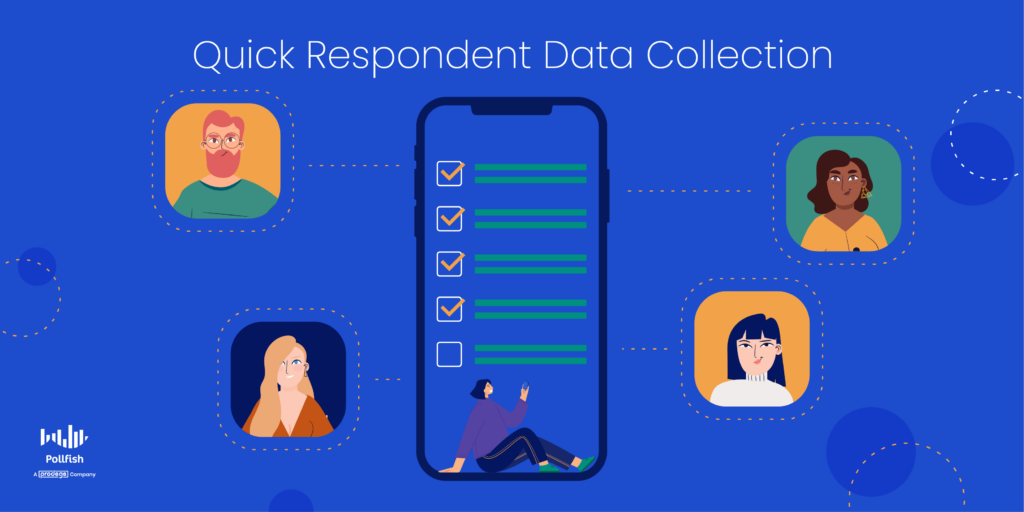
6. Fast Responses and Data Collection
A strong survey platform will retrieve data quickly. Much faster than you would with any other market research method, since it is automated.
Pollfish surveys often take hours to fully complete, with a few days being the longest wait period.
 Real-time results makes it a kind of real-time market research, despite not observing customers as something occurs to them. However, you can still view their completed responses in real-time, so, when automated, survey research is a kind of real-time market research.
With speedy access to survey data collection, you will get results far sooner and can take action all the quicker to please your customers.
7. Candid Responses
This is made possible due to the organic survey sampling method, specifically, Random Device Engagement (RDE).
This survey distribution model, also commonly referred to as organic sampling, is a method that randomly distributes surveys across the internet, prompting random users online to take the surveys.
RDE engages random netizens where they are, voluntarily. They are therefore not professional survey panelists, but real customers that aren’t pressured to answer questions in a particular way.
Thus there is no need to be wary of the survey bias that arises from professional survey takers and panelists. Many of those individuals aren’t fully anonymized or have their identities hidden (from the researchers) at all. Thus, they are under more pressure to answer questions in a cartina manner.
You don’t have this problem in organic sampling, as non-professional survey takers exist where they are online on their own will, In addition, their identities are completely private. Thus, they are free to answer questions honestly.
Gaining all the Data You Need
At this point, you should see the extensive value that surveys bring for all your research needs.
However, despite all of this, a survey is only as strong or useful as the online survey platform that hosts it. As such, it is even more important to decide on the proper survey platform before you choose a survey type to run, let alone begin conducting a campaign.
You should therefore select your survey platform carefully. A strong provider will allow you to fulfill all of your online market research activities. This includes all the activities mentioned in this guide and more.
Pollfish survey software allows you to create a comprehensive survey data collection, one you can customize to your liking, view however you see fit and organize it to the max.
We offer an advanced method to deploy your survey to millions of random users online via the organic sampling method.
Ours is called Random Device Engagement (RDE), a kind of polling that relies on advertising networks and other digital portals on devices, to engage random people where they are, voluntarily.
This way, respondents won’t feel pressured to answer in a particular way, as survey panelists would, as they are completely anonymous and randomized.
Researchers can reap a wide breadth of information on their respondents and access a wide pool of insights in their survey results dashboard.
In addition, you can send your survey to specific respondents and on specific digital spaces, by simply using the Distribution link feature. This allows you to post your survey anywhere you wish, along with emailing it to those you wish to research.
When you rely on such an exhaustive online survey platform, you can carry out any survey campaign you wish and get timely results.
Attaining All Research Goals with Online Market Research
Attaining All Research Goals with Online Market Research

Online market research is the foremost method of modern market research, owing to its speed, accuracy of execution, ability to reach millions and plenty more.
You shouldn't, however, mistake this kind of research for one subtype (such as keyword research or internet database research). That’s because this kind of research is an umbrella term that encompasses many methods and approaches.
You may be wondering, is online market research relevant to your business?
Well, 81% of customers conduct online research before they make a purchase. Thus, if you aren’t already conducting this kind of research, your customers already are to judge your business.
Thus, you’d be remiss not to conduct it. You wouldn’t want to miss out on sales opportunities.
After all, 68% of companies increased sales with market research. And online market research is the dominant form, for a variety of reasons.
This article expounds on online market research, its various types and its importance, along with how and which campaigns you can apply it to.
Understanding Online Market Research
As its name implies, this is a form of research conducted entirely online, utilizing a variety of means to gather critical customer insights.
As such, it is the direct opposite of offline market research, which is predicated on using various non-digital, and non-internet-related sources to conduct research on customers.
The reason that online market research is used specifically to collect customer insights is that it is a form of market research, which involves all the activities used to study your target market — the group of customers most likely to buy from you.
As such, market research is a kind of research driven by the study of the following topics, as they relate to your customers and industry:
- Customer preferences
- Customer behavior
- Needs
- Desires
- Aversions
- The customer buying journey
- Demographics
- Psychographics
- Lifestyles
- Sentiments and attitudes, especially in relation to your business.
Online market research involves using a variety of methods to facilitate research campaigns. Because of this, it is not bent on using just one method. Instead, it involves all the activities and tools available to study your customers and the industry at large.
You can use several forms (or subtypes) of this research, or you can use this research to accompany other forms, such as real-time market research and offline market research. But you don’t necessarily have to.
That’s because this kind of research includes many different kinds of methods and tools, allowing you to reap all the customer intelligence you need.
The Types of Online Market Research
Given that this research is largely an umbrella term for a range of online activities for researching your customers, you ought to know what kinds it includes.
As the market research industry evolves, the following list will change, as some methods will die out and more will be added. This is because this kind of research is reliant on technology, specifically, the internet, which is constantly progressing.
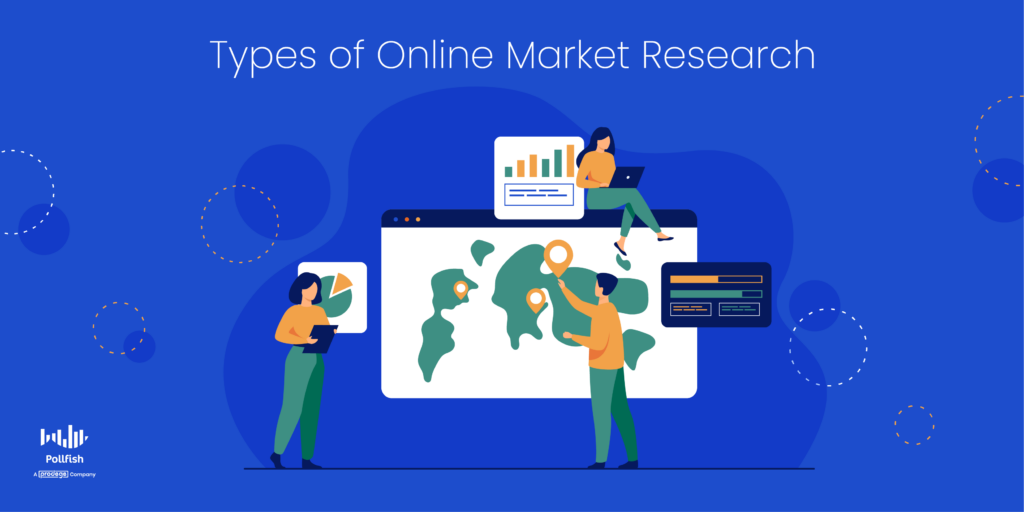
The following lists the names of various forms of this kind of research:
- Internet research
- A secondary research method that typically involves searches on search engines.
- Keyword research
- This is especially used for understanding the demand of products and services.
- Market research software
- These are platforms designed to automate the research process and are typically used in agile research.
- DIY market research
- This is a kind of research that businesses and researchers can conduct on their own through a variety of tools.
- Syndicated research
- This is virtually the opposite of DIY research, as researchers use a research firm to conduct the entirety of their research campaigns. In this context, they do so digitally.
- Real-time results research
- Closely tied with real-time research (a kind of ethnographic research), it involves using a platform that offers customer data in real-time.
- This is its own category, as not all market research software offers this.
- Competitor research
- This involves paying close attention to your competitors’ digital properties to observe how they carry out their offerings and how their customers engage with it.
- Survey panels
- Much like syndicated research, this too is external, as a company amasses a research panel to partake in research campaigns.
The Importance of Online Market Research
If the above sections, which delve into the many capabilities of online market research didn’t convince you of its importance, the following will.
First and foremost, this kind of research allows you to understand your customers in great depth, the kind you wouldn’t have access to in other forms of research. That’s because it’s far easier to reach people online, rather than via mailed surveys or interviews.
Secondly, it enables you to understand how viable a product is in your industry before you launch it, to avoid low sales. In addition, it can help you innovate and improve upon already existing products.
That’s because there are various ways to conduct product research, such as via general internet research. Or, you can do this through a market research tool that you would only get from a market research platform. For example, the Van Westendorp Price Sensitivity Meter is a pricing model that provides data for consumer price preferences.
You can also use this kind of research to improve your entire customer experience, from the first impressions of your business, to browsing your digital properties to finally making a purchase and beyond.
With a good CX, you’ll be able to delight your customers across all touchpoints, building a strong relationship with them, in turn. This itself has a wide variety of benefits for your business.
A good relationship with your customers fosters consumer loyalty, which you’ll need in order for customers to come back to your business time and again. You wouldn’t want to have a “one and done” customer.
Thus, by conducting this research and pleasing your customers, you’ll be able to increase your customer retention rate. Retention is paramount, as it is both more profitable and attainable.
For example, increasing customer retention by just 5% can increase profits from 25-95%. In addition, acquiring a new customer costs five times more than retaining an existing one.
Thus, it’s crucial to maintain adequate customer retention. By running online market research, you can also maintain or even increase your customer lifetime value, the quality of your customers in relation to the length of their patronage of your business.
This metric also ties in with retention and is a must to keep your business competitive.
What Campaigns and Macro-applications Online Market Research Can Support
One of the strongest abilities of conducting online research is that it can support a wide variety of business campaigns. This includes aspects of all areas of your business, as your customers affect it beyond the scope of marketing and selling.
While there are too many to list, here are some of the major campaigns and macro-applications this kind of research supports:
- Concept testing
- This is ideal to do before you introduce any new products into the market.
- You can test a variety of concepts to see which resonates the most and which has the highest demand.
- This is also used to ask customers themselves to pitch concept ideas for products and services.


- Customer development
- Conceived by an entrepreneur, this is the mid-portion of the lean startup model, which is designed to tackle the problems in product development.
- It requires first fully evaluating the product opportunity and then proving that the solution proposed will meet market demand and customer needs.
- Writing a business plan
- Before you embark on any new business, you’ll need to know whether your idea would be viable.
- Thus, you will need to create a business plan as a framework for all your new business undertakings. Learn how to do market research for a business plan,
- Advertising research
- There are a variety of ways to use this form of research to test ad campaigns.
- You can conduct A/B tests of ads, run surveys, view existing ads in a similar business and more.
- Brand tracking
- These campaigns involve measuring all your brand-building efforts, such as brand reputation, awareness and perception against key metrics.
- There are various methods to keep track of your brand health, but using the brand tracking survey is one of the simplest and most accurate sources of this campaign.
- Consumer analysis
- Analyzing your customers is the core of market research.
- There are various online approaches to conducting this research, including secondary and primary sources, which you can use to build your analysis.
- Purchase frequency
- Create specialized analyses, such as the RFM analysis to learn about customer buying patterns and behaviors.
- Conducting online research can also help you increase your purchase frequency.
- Customer satisfaction
- Satisfying your customers involves using a variety of avenues to get them hooked on your products/services, engaged in your social and other posts and keeping your business top of mind.
- Use research to test your customer support and engagement sessions.
- Business relationships
- Learn more about how your business customers, vendors and partners feel about working with you, or what they seek from the industry at large.
- You can do so via B2B surveys
- Learning how to lower bounce rate
- One of the many metrics you’ll contend with on your site, your bounce rate is one you’ll ideally want to lower.
- This involves testing your site’s UX and user-friendliness.
- Conducting global studies
- You’ll need to appeal to global customers beyond the ability to serve them. Conducting research will help you understand their cultures and norms to better market to them.
- The right platform will make it easy to conduct global market research.
Forming Strong Business Campaigns
Online market research guides and supports a vast variety of business matters. As such, you should never forgo conducting this research, as it reveals much about your customers and industry, and most importantly, informs you on the actions you need to take.
You should therefore select your market research platform carefully. A strong market research company will allow you to fulfill all of your online market research activities.
We suggest using a survey platform that offers a wide range of capabilities and functionalities. This will ensure valuable campaigns that are rich in insights, that also provide you with ease of survey deployment and analysis.
Pollfish survey software allows you to create a thorough survey data collection, one you can customize to your liking, view however you choose and organize it to the max.
In addition, with our vast array of question types, you can create any type of online market research survey to support your research campaigns.
Researchers can leverage a wide pool of information on their respondents by accessing the data in their survey results dashboard.
When you have the support of such a platform, you can tackle all your research needs.
The Guide to Using Crosstabs in Pollfish (Late 2022 UPDATE)
The Guide to Using Crosstabs in Pollfish (Late 2022 UPDATE)
Crosstabs are a matrix-style format for data visualization and are one of the most useful and common ways that market researchers analyze data. Pollfish offers cross tabs as an excel export for easy synthesis outside of the platform.

Analyze Pollfish data using crosstabs
Crosstabs are an easy way for researchers to synthesize data and analyze the relationships between two (or more) variables. The variables represent categorical data from the survey, and are displayed in rows and columns in a matrix for researchers to quickly find data in corresponding cells.
Many traditional tools and services offer crosstab reports, although the process is extremely manual. Researchers may only have access to the raw data from their studies initially and need to request that a crosstab report be generated for them. Because these reports are often an additional service, this can add significant expense to a research project.
Pollfish has always been at the forefront of market research technology, so we tackle crosstabs a bit differently. Our process is automated to generate crosstab reports from the survey data that we collect, which is a better fit for convenience, cost, and accuracy for teams of all sizes.
As of May 2021, Pollfish has launched a new edition of crosstabs known as Volume 2 and there will be another iteration coming soon.
Get started with crosstabs in Pollfish
To take advantage of the crosstabs feature in Pollfish, visit the results page of a completed survey, select “Export results” and choose “Crosstab” as your export option. You will be sent an email that notifies you when your export is complete. Open the document in Excel or Google Sheets to get started.
The crosstab sheet will include four “tabs” across the bottom.
- Count: This sheet shows the number of responses that fit a row and column.
- Percentage: This sheet shows the percentage of all responses from the survey that fit a row and column.
- Row Percentage: This sheet shows the percentage of the row that falls into a specific column.
- Column Percentage: This sheet shows the percentage of the column that falls into a specific row.
Example results using Pollfish crosstabs
Say you’re interested in Android users, specifically those who might switch to using an iPhone. You could run a survey, similar to the one below to ask men and women of all ages their opinions about the two devices.
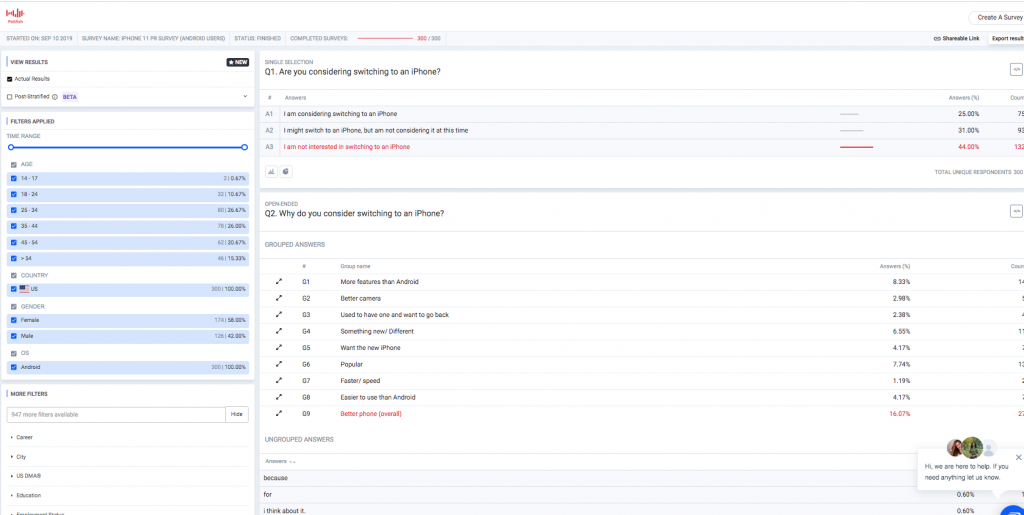
However, you could achieve a deeper level of insight by exporting these results to crosstabs, and seeing what data correlations come from it. For example, how many women are considering switching to the iPhone?
Using the “Count” tab, you can see that 39 women from the survey said that they were considering switching to an iPhone. Using the “Percentage” tab, you can see that the 39 women represent 13% of the sample population that was surveyed.
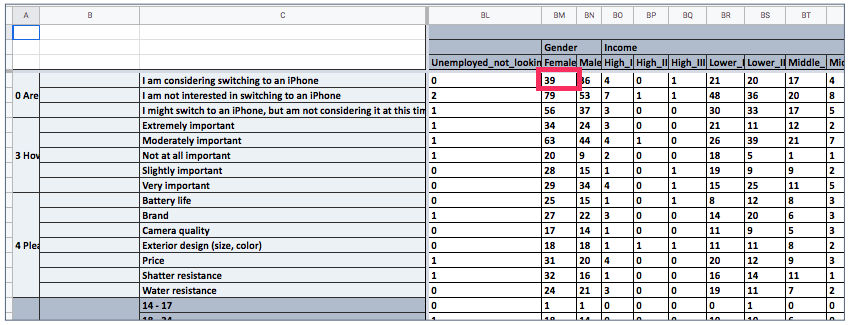
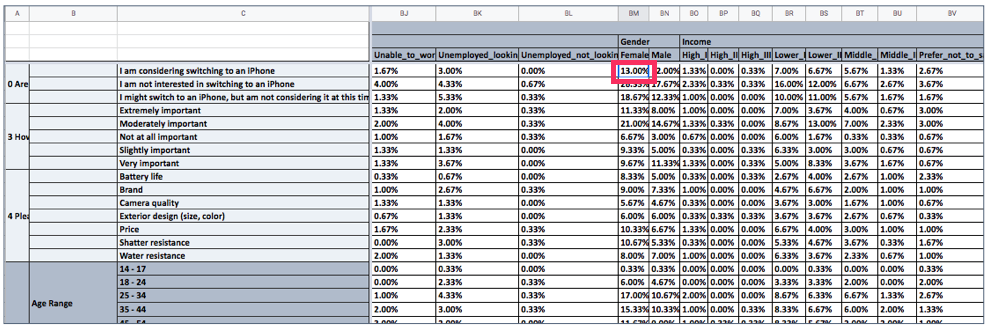
The “Row-Percentage” and “Column-Percentage” tabs are inverse tables of data that show the percentage of the rows that belong to a single column, and vice-versa. You can toggle between these tabs to choose the view you prefer.
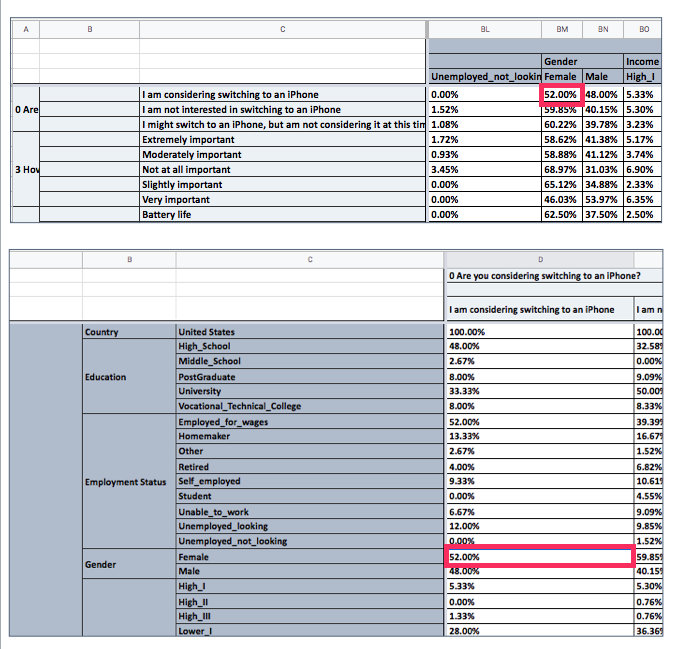
In our example, we can see that 52% of the respondents who were considering switching to an iPhone were women, where the rows and columns are displayed differently depending on the tab selected.
To gain familiarity with crosstabs, you can view the iPhone survey here and check out the crosstab export to see how the data looks. Or, you can export your own finished Pollfish survey to explore your results with a new tool.
Understanding the Updated Crosstab Features
In the Pollfish Crosstabs export file, all questions can appear in both the columns and the rows. In the Crosstab Designer, specifically, researchers can drag and drop to add whatever they see fit for their analysis. The answers can be based on different demographics, along with the percentage of those demographics that have answered in a particular way.
In our advanced version, the cells include more than just percentages of responses. Rather, the data is featured in boxes, with each box containing various information. This includes the count and percentage. In addition, the new Crosstabs version includes more columns per question, with each column representing a different answer.
The data on each answer is then displayed in each box. This version gives researchers a far more organized and granular view of their survey results.
What’s best is that researchers can generate these on their own. Moreover, they can easily drag and drop the questions into the report themselves, so that the report features only the relevant data.
The Two Types of Crosstab Solutions
The Pollfish online survey platform offers two types of crosstab solutions. Each offers a different way to layout your resulting data. The second type has been updated and has several new features to power your survey analysis needs.
- The first solution includes the results from the results page. It can appear as:
- All data or Current view
- It bridges the gap between the excel individuals file and the results page.
- The second solution is called Crosstab Designer.
- This is available for clients with an Elite plan.
- This type of crosstab has new upgrades.
- The Crosstab Designer 2.0 allows researchers to preview their crosstabs and instantly download their crosstabs.
- This allows researchers to design, preview, and download their custom tabular results view.
- It also allows researchers to choose what to crosstab without any limitations. Therefore, it is entirely custom.
- Afterward, they can preview it and download it instantly in seconds on any device
- The new Crosstab Designer supports:
- Crosstab Previews
- Instant downloads
- This will soon support A/B tests.
These first two Crosstab solutions offer translations and both of them also can generate .XLS files.
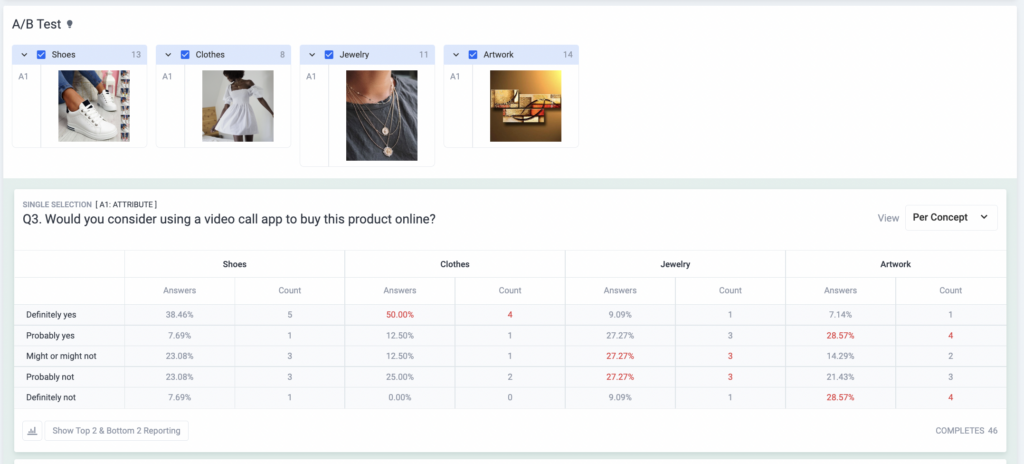
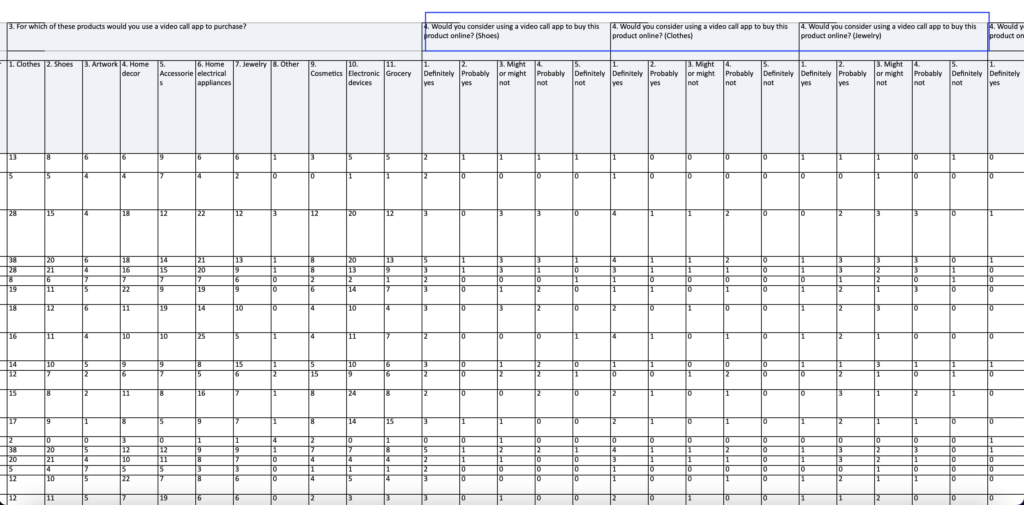
Crosstab Support for A/B Tests (Monadic and Sequential)
Crosstabs have been updated to include questions and answers per concept.
Specifically, if your survey included an A/B test with three concepts and one single selection question, you will get a crosstab with the question repeated three times. This makes it the same amount as the concepts, with both the columns and the rows.
This change is applicable to both types of A/B tests. These are the:
You can filter the responses by concepts, demographics, along with answers and use the current view export, which will generate a Crosstab based on the filtered responses.
Our team is excited to help you learn more about this newly updated feature, so don't hesitate to reach out to our 24/7 Customer Experience team if you need assistance.
Creating a Branded Survey with a Customizable Logo and Theme
Creating a Branded Survey with a Customizable Logo and Theme
![]()
![]()
A branded survey is a unique way to present your business to your respondents by featuring the likeness of your brand.
It enables you to create a custom survey experience, which is not merely critical for branding market research, but for all your branding efforts.
In the ultra-competitive landscape of brands today, many of which are jockeying for your attention on the internet, brand awareness is essential. In fact, 45% of marketers rank increasing brand awareness as a top priority for their business.
As such, branding your surveys is a less conventional, albeit innovative way to increase and maintain brand awareness among your target market.
This article delves into the branded survey, its importance, examples and how to create one with a customizable logo you can place in your questionnaire and elsewhere.
Understanding the Branded Survey
A branded survey is a survey that outwardly features your brand, whether in name, logo, related image or another type of likeness.
Such a survey directly points out that the survey is not used for an anonymous source or company. Rather, it is the product of a specific brand that asks internet users to partake in it.
You can create a branded survey on Pollfish by adding your logo to your survey’s questionnaire and customizing its header, text and more.
This kind of survey is one of the many market research techniques, as it can be used to collect key consumer insights for virtually any campaign, whether it’s for advertising, customer segmentation, brand reputation or any other market research purpose.
However, unlike its non-branded counterparts, this kind of survey is unique in that it features your brand front and center. Thus, the respondents will never have to wonder which company or entity they are taking the survey for.
You can brand your survey in the following ways:
- Adding your brand to the title of the survey
- Placing your brand name in the introduction of the survey
- Putting your brand name in one of the survey questions
- Inserting your brand in the thank you or closing page of the survey
- Adding your logo to the survey (as opposed to the Pollfish logo or having no logo at all)
Why Branded Surveys are Important
When you brand your surveys, first and foremost, you are giving your brand a competitive edge.
That’s because they can provide yet another placement for branded content on the web.
Branded content is incredibly important, as it is more effective than pre-roll ads, which are the promotional videos customers see before their chosen content. 86% of viewers could recall a brand after viewing branded content than regular pre-roll ads.
Luckily, these surveys aren’t ads, they’re surveys that exist on a massive network on website and app publishers.
Thus, a branded survey is another means to keep your brand top of mind for your customers.
This means, in a branded survey, your survey won’t merely be used for typical market research purposes. It will also provide you with brand awareness as it’ll make your customers recall your brand, while those who haven’t heard of you will be prompted to learn.
![]()
![]()
Branded surveys also enable you to engage in white-label market research. As such, when people come across your survey online, it’ll be recognized as yours only. That’s because there are no indicators of a third party, i.e., a market research survey platform.
Thus, your survey will appear as proprietary to your brand, thus giving you the full white-label experience.
For those who support your brand, seeing your logo in your survey will capture their attention better than a survey without a logo or likeness to your brand. As a matter of fact, a branded survey encourages your online customers to check out the survey and most importantly, complete it.
Thus, a branded survey hooks your target customers’ attention better and leads to a higher survey completion rate, allowing you to get timely results and complete your market research campaign.
If you are hesitant about revealing your brand in your survey, you may want to consider another crucial reason to do so. This involves collecting feedback after a sale to learn about the entire customer buying journey, along with the customer experience whilst making a purchase.
This involves getting insights into your customers’ e-commerce experience, and post-sales support, along with getting feedback from your own employees. As such, this feature is great to pair with the customer experience survey.
All in all, branding your surveys provides an excellent opportunity for the following:
- Creating branded content
- Fostering brand awareness
- Producing brand recall
- Capturing attention
- Forging interest in your survey
- Promoting your values and mission
- Standing apart from your competitors who don’t use branded surveys
- Understanding your CX during their purchase and post-sales
Get started on yours!
Create a Branded Survey on Pollfish
Creating a white-label branded survey on Pollfish is easy. This is made possible by the examples in the numbered list in the Understanding section. However, what’s special about branding in a Pollfish survey is that you can add a logo to your questionnaire.
Let’s learn how to do this. Like many other features on the Pollfish online survey platform, it’s easy to add a customizable brand logo. In Pollfish, this would live in the Questionnaire portion of the survey.
- Create a new project and choose the deployment method. There are two options: random device engagement (RDE) or sending your survey through your own chosen platforms and specific people.
- Go to the Questionnaire section.
- On the left-hand panel, go to the bottom and select Themes.
- Select the New Theme button.
- You can also select Default survey style and click on Duplicate. (This will create a Default survey style copy field to appear above the Default survey style field).
- Next, customize your theme.
- Themes are available to apply to your surveys. There is no need to recreate them from scratch.
- All themes are available to all team members.
- You’ll have various options that pop up. These include options to customize the following:
- Title of theme
- Header Options:
- Questionnaire logo (add your brand logo)
- Progress bar colors
- Questions’ colors
- Prompt box color
- Header background color
- Answer Options:
- Answers and labels text color
- Answers control color
- Answers background color
- Submit button color
- Background color
- Once done, hit Save.
- This will save the particular branded survey.
- Return to the Themes left-hand panel.
- Here you can edit, duplicate or delete the surveys by clicking on the triple dots next to each one.
- Add questions to the Questionnaire and voila! — you’ve got yourself a branded survey.
Examples of a Branded Survey on Pollfish
Now that you know how to create this kind of survey on the Pollfish market research platform, let’s take a gander at what it actually looks like.
The following provides examples of branded surveys on our platform:
![]()
![]()
Use an advanced editing solution:
Branding Yourself in Market Research Campaigns
Creating a branded survey is a unique and effective way to not only conduct market research, but to engage in a branding technique.
As such, this kind of survey goes beyond the primary purpose of a market research survey. It serves as a tool for creating brand awareness and other key needs for your branding efforts.
You can therefore use it to not simply ask questions, but embed the key things you’re proud of about your brand in the questions.
To do so efficiently, you’ll need a strong online survey platform to host it. This means it is even more important to decide on the proper survey platform before you begin on branded survey creation.
A potent survey provider will allow you to fulfill all of your online market research activities at speed and with ease.
Pollfish survey software allows you to create a comprehensive survey data collection, one you can customize to your liking, view however you see fit and organize to the max.
We offer an advanced method to deploy your survey to millions of random users online via the organic sampling method RDE method.
Additionally, researchers can reap a wide breadth of information on their respondents and access a wide pool of insights in their survey results dashboard.
With such a powerful online survey platform, your branded surveys will always be easy to create and deploy. Thus, you’re in good hands.