6 Best Enterprise Survey Software in 2025
6 Best Enterprise Survey Software in 2025
When selecting an enterprise survey software, consider these key elements:
- Advanced survey capabilities: Enterprise solutions should provide sophisticated questionnaire design tools and precise audience targeting options. If any of these areas are lacking (e.g., you’re unable to set up sophisticated branching logic or the software is missing filters to target your exact audience), then your data quality can suffer as a result.
- Powerful analytics tools: Look for platforms that make it easy to create custom charts (using multiple variables) and build presentation-ready visualizations in your brand’s colors, without requiring external software.
- Service model flexibility: In some cases, you might prefer running DIY surveys independently. However, when needed, you should have access to full-service options. This is particularly valuable when you're facing tight deadlines, lack internal expertise, and need to ensure the highest quality standards for critical research initiatives.
- Clear & transparent pricing: The cost of your survey should be transparent and clearly visible as you build it, ensuring no unexpected charges or hidden fees.
- Unlimited seats & no license fees: The best enterprise survey platforms allow you to add an unlimited number of team members without incurring additional costs.
- Administrative & collaboration features: The best enterprise platforms should make it easy to add and manage users, share survey access and collaborate across different departments, create organized project folders, enable easy and secure employee sign-in via SSO (Single Sign-On), etc.
- High-quality audience data, rapid turnaround times, and other enterprise-grade essentials.
In this post, we’ll start by discussing the key advantages of choosing Pollfish, our enterprise survey software. Then, we’ll discuss other solutions to help you make an informed decision.
Best Enterprise Survey Software
1. Pollfish
Pollfish, our market research survey platform, is renowned for its superior audience data quality. We achieve this by owning and operating our respondent communities through our parent company, Prodege, and by implementing rigorous quality control measures. This includes 14-day evaluation periods, panelist trust scores, verifying self-reported information through purchase receipt uploads, and more.
This ensures that the decisions you make based on your survey data are sound and dependable, and it’s a key reason why enterprise companies choose Pollfish.
Beyond reliable data quality, Pollfish offers enterprise clients a comprehensive suite of advanced features and capabilities:
- Volume discounts
- 5% IR (no premium)
- 2x survey priority (faster)
- Conjoint analysis
- MaxDiff analysis
- Van Westendorp (PSM)
- Custom survey themes
- Crosstab designer
- Live BigQuery export
- Language translations
- Single Sign-on (SSO)
- Unlimited seats
- Account budgets
- Dedicated Account Manager
- Complete team onboarding
- Ad-hoc trainings
- Quarterly survey meetings
- Access to Services Team
There are two methods to collect survey responses with Pollfish:
- Purchase audience responses from our existing audience panel. Use our global Prodege network to reach the right audience for your survey.
- Distribute a survey to your own audience. Create a survey and share the link with your own list via email, social media, landing page, and so on. You can also use screening questions to ensure only the most relevant participants complete the surveys.
Up next, we’ll provide in-depth information on:
- Pollfish’s Flexible Service Models: We offer DIY, assisted, and fully-managed survey options. Volume-based discounts are available and can be applied across all service tiers.
- Pollfish’s Advanced Functionality: We provide advanced questionnaire design, audience targeting, and data analysis & reporting features.
- Additional Benefits:
- High-quality audience data
- Transparent pay-per-response pricing model
- Unlimited seats & no license fees
- Fast turnaround time
- Powerful administrative and collaboration tools
Let’s dive in.
Pollfish’s Flexible Pricing: Pay-As-You-Go DIY or Enterprise Packages That Include Volume Discounts & Full-Service Agency for Custom Projects
Pollfish provides flexible service tiers for enterprise companies, designed to match your research needs and capacity:
❇️ DIY Access
Manage your surveys independently with priority support from research experts that are on call 24/7. Pricing starts at $0.95 per response, with no monthly fees and transparent pricing visible during survey creation (ensuring no hidden or surprise charges).
❇️ Enterprise Pricing Plans
Enterprise clients enjoy volume discounts, exclusive features, and access to a dedicated account manager who can help with everything from complete team onboarding to custom projects handled by our in-house agency. It’s a completely done-for-you service from start to finish. The process involves:
- Share your objectives (brief, email, or call)
- Receive a detailed proposal (design, pricing, timeline)
- We execute the project end-to-end (programming, reporting)
❇️ Volume-Based Discounts
If you plan to spend $25,000 or more, we offer volume-based discounts. These funds can be utilized across our DIY or fully-managed services.
Note: To learn more about our market research services (fulfilled through parent company Prodege), visit this article.
Robust Questionnaire Design Features
Pollfish offers extensive, customizable questionnaire design features, allowing you to program surveys exactly as you envision:
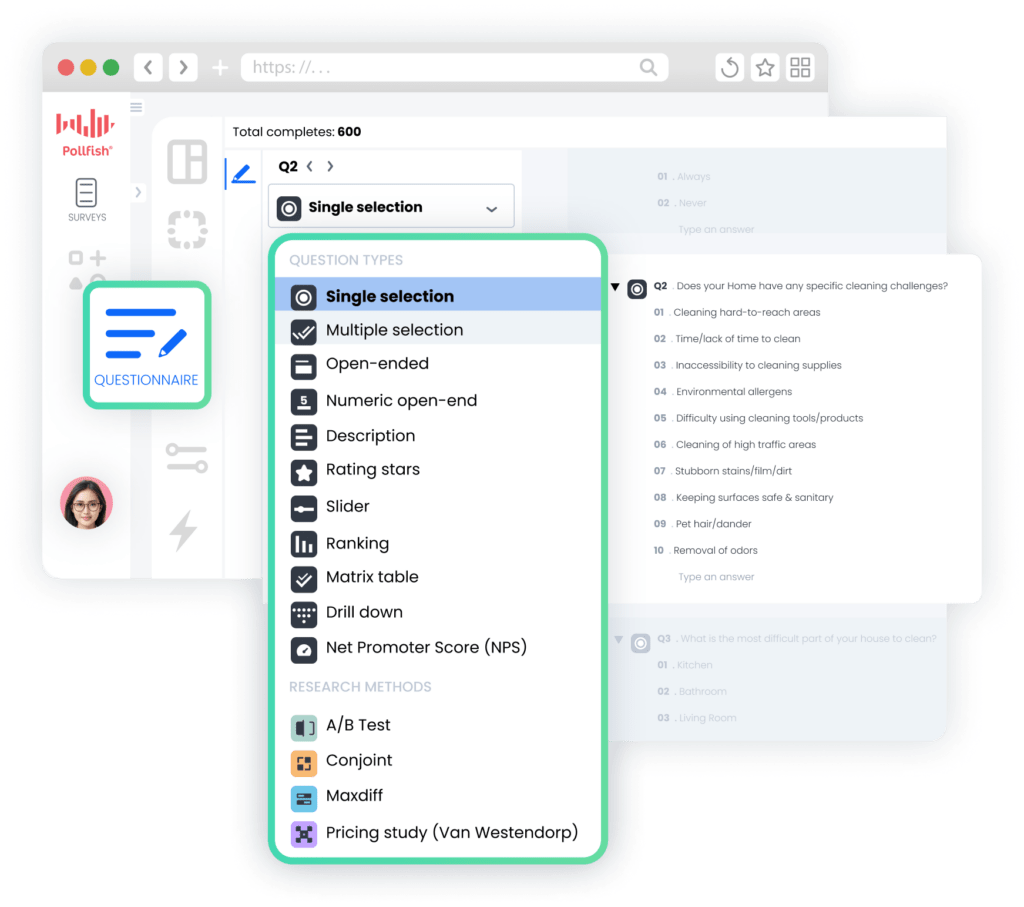
❇️ 16 question types
Explore our guide on when to use Pollfish’s various question types, including Single selection, Multiple selection, Open ended, Numeric open ended, Description, Rating stars, Slider, Ranking, Matrix single selection, Matrix multiple selection, Net Promoter Score (NPS), A/B test, Conjoint analysis, Max Diff, and Van Westendorp.
❇️ Sophisticated Branching Logic
Explore our guide on applying advanced skip logic to single-select questions, matrix questions, multi-selection questions, and more.
❇️ Screening Questions
Read our guide on how to use screening questions like a pro with Pollfish (to ensure only relevant participants take your survey).
❇️ AI Survey Builder
Read our guide on how to create surveys faster using Pollfish’s AI builder. Simply enter a prompt, and Pollfish will generate a well-formatted survey that you can then customize to your liking.
❇️ Survey Templates
Read our guide on Pollfish’s 17 survey templates, ranging from categories like brand feedback, product feedback, customer feedback, employee feedback, and more.
❇️ Conversational AI
Read our guide on how to carry real-time, one-on-one conversations with respondents at scale via AI.
❇️ And so much more…
Explore additional survey design features, including answer and question shuffling, multimedia capabilities (e.g., include videos or images), and so much more.
Note: Watch this video for more info on Pollfish’s questionnaire design features.
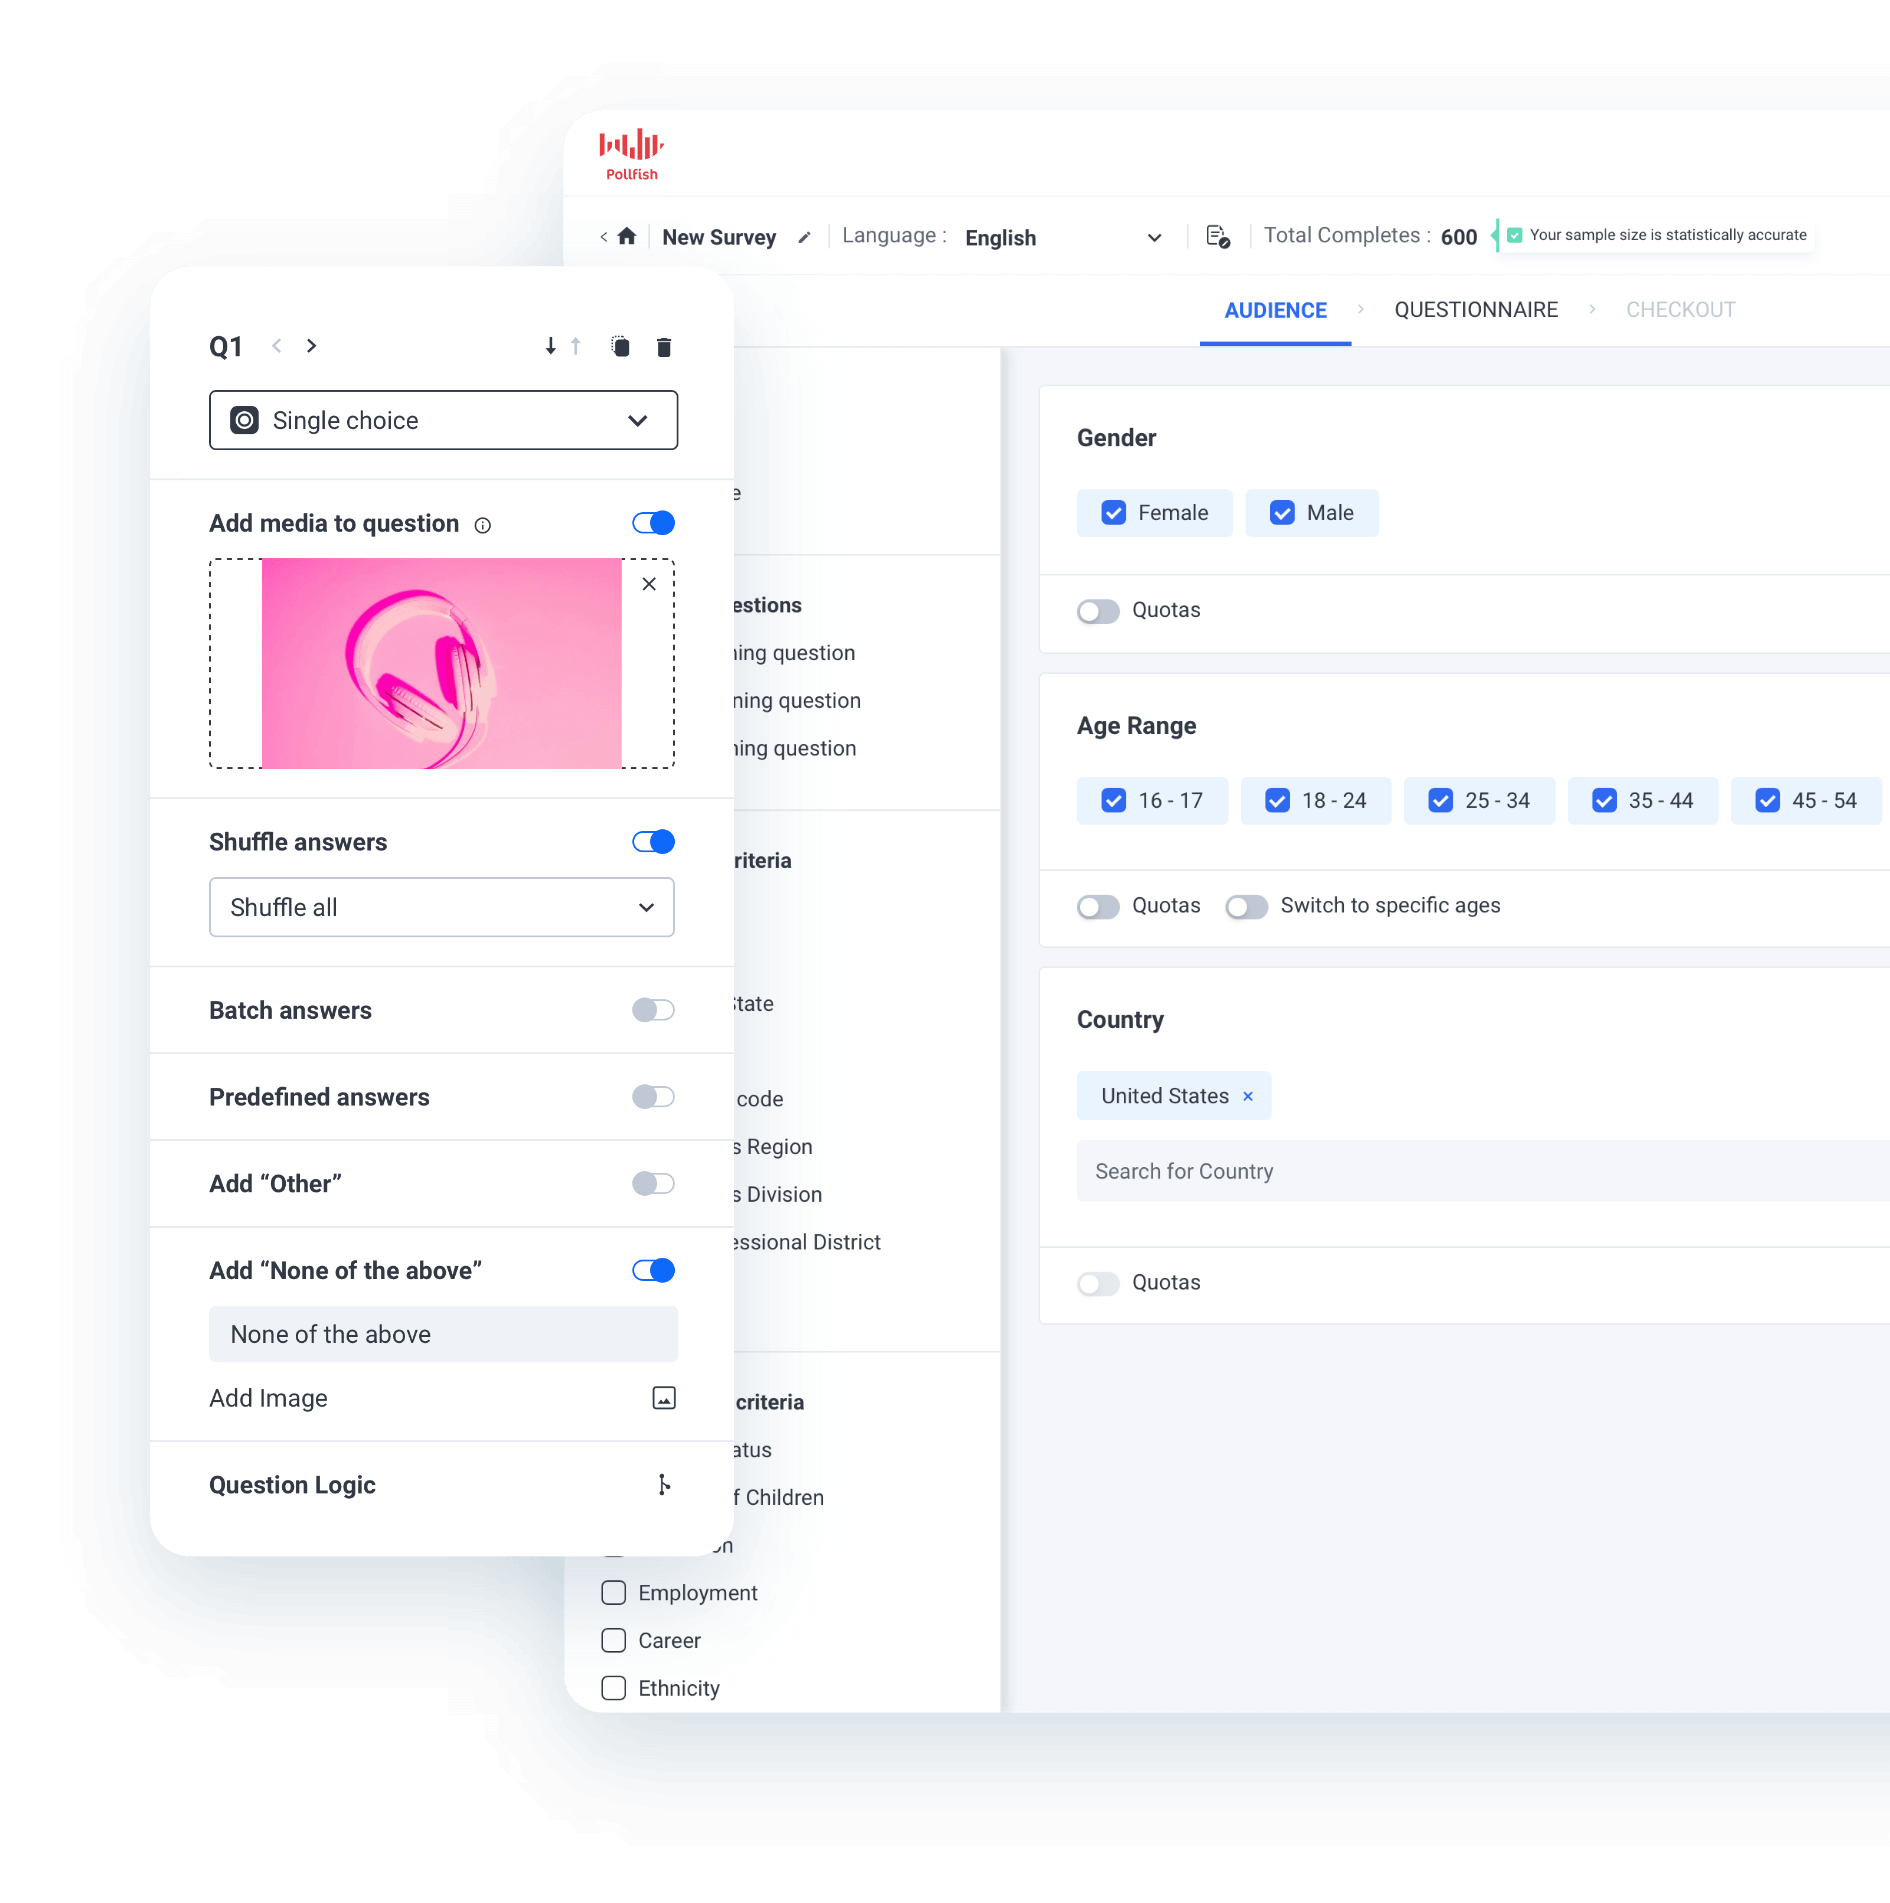
Sophisticated Audience Targeting Capabilities
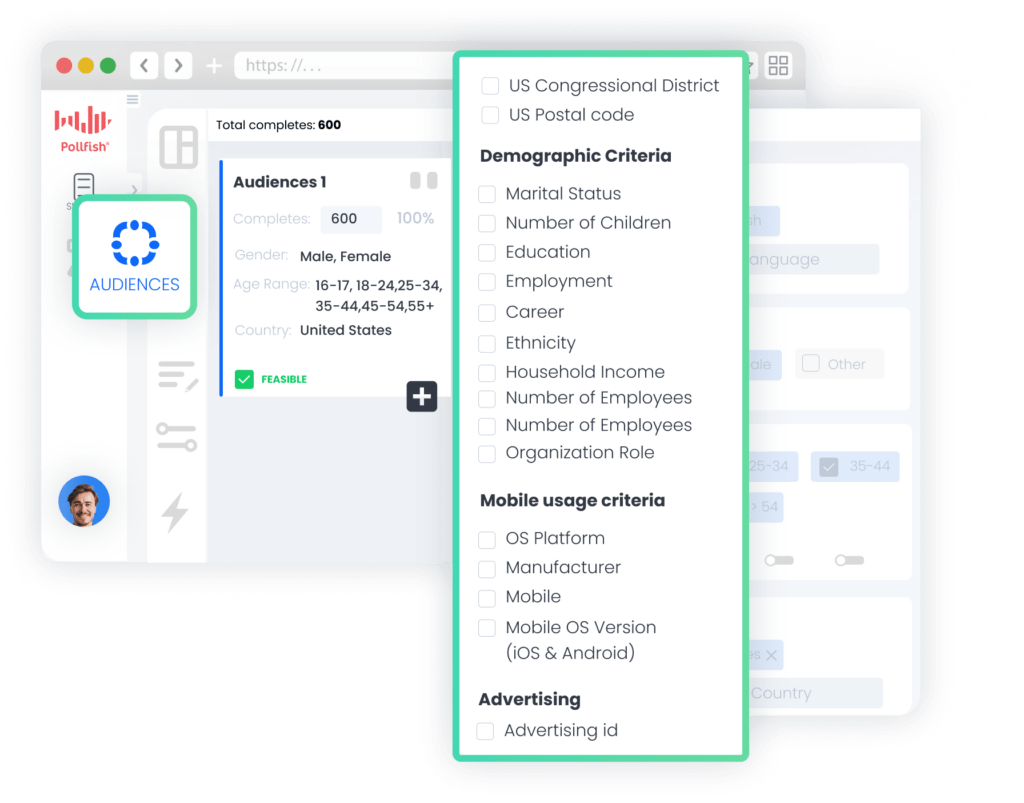
Pollfish provides a wide array of targeting criteria, allowing you to reach even the most niche audiences:
❇️ Choose from 50+ audience filters in 6 categories:
- Demographics: Age, Gender, Hispanic Origin, Marital Status, Languages Spoken, Education Level, US Voter Registration, Household Income (US), Age & Gender of Child(ren) in Household, Type of Home, Pets in Household, Political Party Support, Hispanic Level of Acculturation, Parental Status / Pregnancy Status, Race, Device Type, Device Operating System (OS), Ethnicity, Number of Children in Household
- Geographic Criteria: US State, US Division, US DMA, US Region, US Statistical Area (CBSA), US County, US Zip Code
- Consumer Lifestyle: Beverage Consumption, Hobbies & Interests, Sports Participation, Gambling Participation, Music Streaming Services Use, Movie Theater Frequency, Home Movie Viewing Frequency, Video Game Participation, Video Game Consoles, Video Game Genres, Travel by Air for Business/Leisure, Vehicle Make/Brand Own or Lease, Vehicle Type Own or Lease, Health Ailment Diagnosis
- Employment & Occupation: Employment Status, Industry Work In, B2B Department, Number of Employees, Job Title
- Behavioral Data: Brands Purchased (In-Store), Online Shopping: Retailer, In-Store Shopper, Category Buyers, Retail Channels Shopped (In-Store), Websites Visited, Retail Channels Shopped (Online)
- Media: Video Streaming Services Used
❇️ Set Custom Quotas
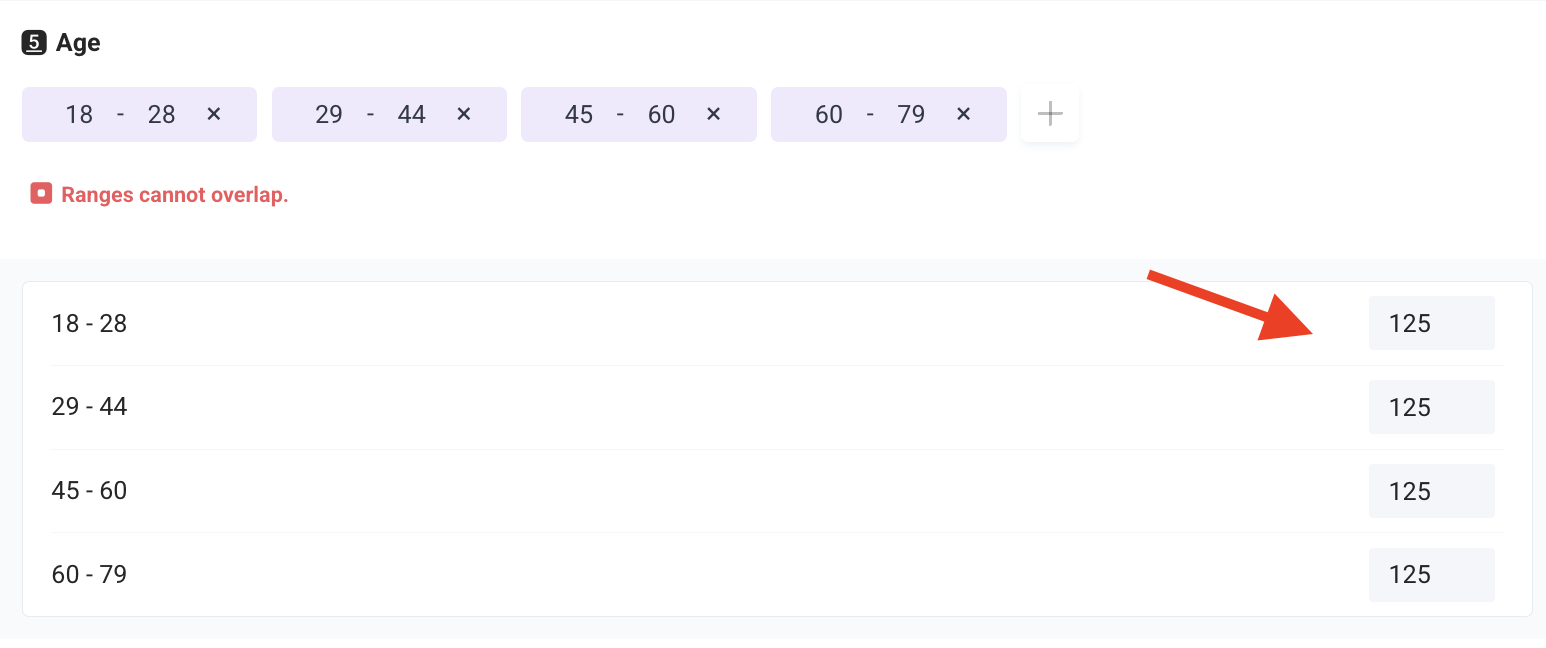
Pollfish makes it easy to set custom quotas based on age, gender, income levels, or any other audience parameters.
Note: For more info on Pollfish’s audience targeting features, see this video.
Powerful Built-In Analytics
Pollfish offers powerful, built-in analytics tools that eliminate the need to export survey data to external platforms:
❇️ Demographic filtering: In just a few clicks, filter to only view survey results from specific demographic groups (e.g., compare male vs. female responses).
❇️ Response-based filtering: View survey results from only those who selected a certain answer (e.g., only view results from those who said they’re avid golfing fans).
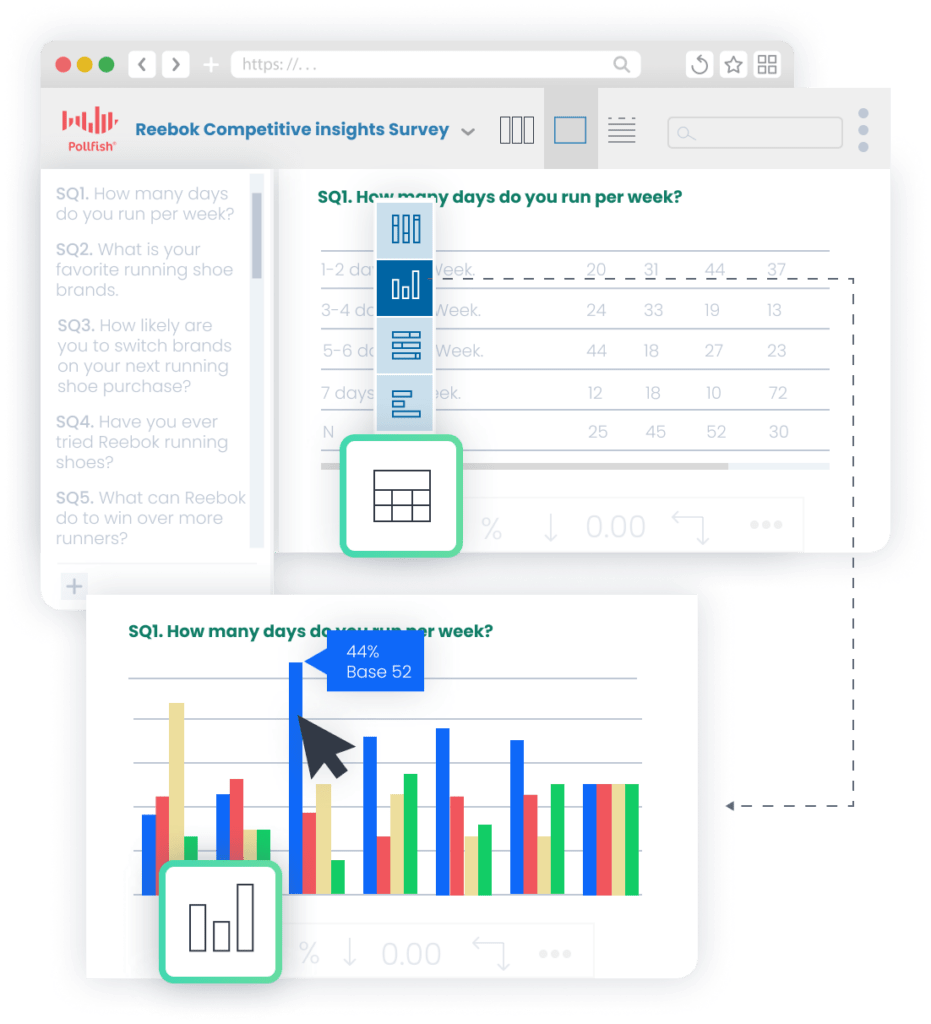
❇️ Advanced Insights Builder: Create custom charts using multiple variables in just a few clicks, as demonstrated below:

❇️ Statistical significance testing: Optionally enable statistical testing for every chart for clear, color-coded results.
❇️ Custom branding: Customize each chart to match your brand’s color palette.
❇️ Built-in PowerPoint creation: Pollfish allows you to create and export PowerPoint slide decks directly within our platform. This streamlines your workflow by eliminating the need to switch between multiple tools, making it faster and more efficient to add charts.
❇️ Flexible export options: Export survey results in multiple formats, including PDF, Excel, crosstabs, SPSS, and more.
High-Quality Audience Data You Can Confidently Rely On
Since Pollfish owns and operates our own first-party respondent communities through parent company Prodege, we maintain strict quality controls throughout the entire data collection process. Our recent article, "3 Survey Data Quality Issues Sabotaging Your Research (& How We Fix Them)" details these measures, including:
❇️ Verifying respondent identities through diverse activities: We verify respondent identities through activities beyond surveys, such as watching videos, playing games, or shopping online. These activities help us confirm that panelists are real people and not bots, which is increasingly important with the rise of AI.
❇️ 14-Day Evaluation Period: Before taking client surveys, new panelists must complete extensive internal surveys designed to filter out low-quality responders.
❇️ Purchase receipts enable verification of self-reported preferences: When panelists upload purchase receipts, we may cross-reference this data with their profiles. For example, if someone frequently buys dog food but their profile indicates they don't have any pets, we may flag this for review.
❇️ Trust Scores: Each panelist has a trust score, with higher scores leading to more earning opportunities (which incentivizes higher quality survey responses).
❇️ Fraud Detection Technologies: We use advanced fraud detection technologies, including multi-level registration verification (e.g., CAPTCHA, Device ID Reputation, 100% Double Opt-In, etc.), tech consistency (carrier/targeting alignment check), single user IDs, sophisticated anti-VPN measures, and more.
❇️ Manual Review of Open-Ended Responses: Each and every open-ended response is manually reviewed by our team to ensure quality.
As several Pollfish customers have stated on Trustpilot:
"The most important point to make is that I trust the responses of my survey. My target audience was very specific and I could tell that the responses were legitimately coming [from] subjects in my target audience.”
– Read the full review here
“Each time I use this service I am blown away by the speed with which the responses come in and with the detail which most of them include. You can tell that the respondents take this very seriously. They must really enjoy doing it.”
– Read the full review here
“I had to get some data on a product in a tricky sector. It was proving challenging to attract participants to my study. I was able to quickly get results and some insights to be able to move forward with my work using Pollfish.”
– Read the full review here
“I was very satisfied with the results I got from Pollfish. My company was conducting market research and received very insightful help from consumers who were all verified homeowners.”
– Read the full review here
Transparent Pay-Per-Response Pricing, Unlimited Seats & No License Fees
Many competing enterprise survey platforms charge high monthly subscription fees, with significant additional costs for each new user.
❇️ In contrast, Pollfish charges only per response, and allows unlimited seats at no extra cost. This is a major advantage for large enterprise companies with numerous departments and employees who need access to the platform (whether to launch surveys, view and analyze results, and so on).
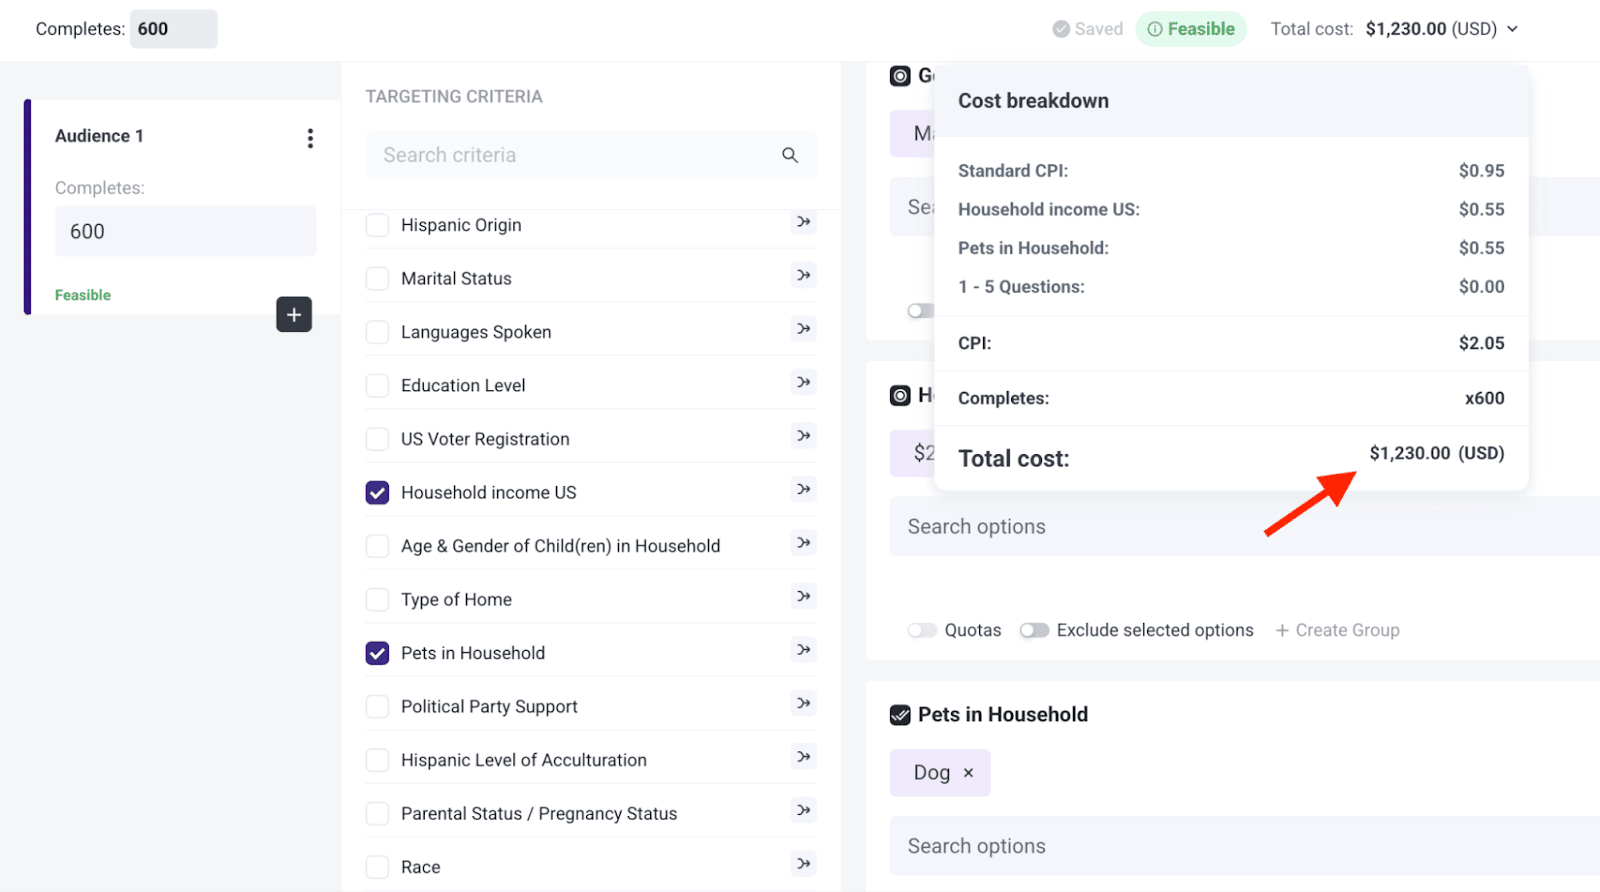
❇️ As you build your survey, pricing is always clearly displayed upfront, with no surprise or hidden fees.
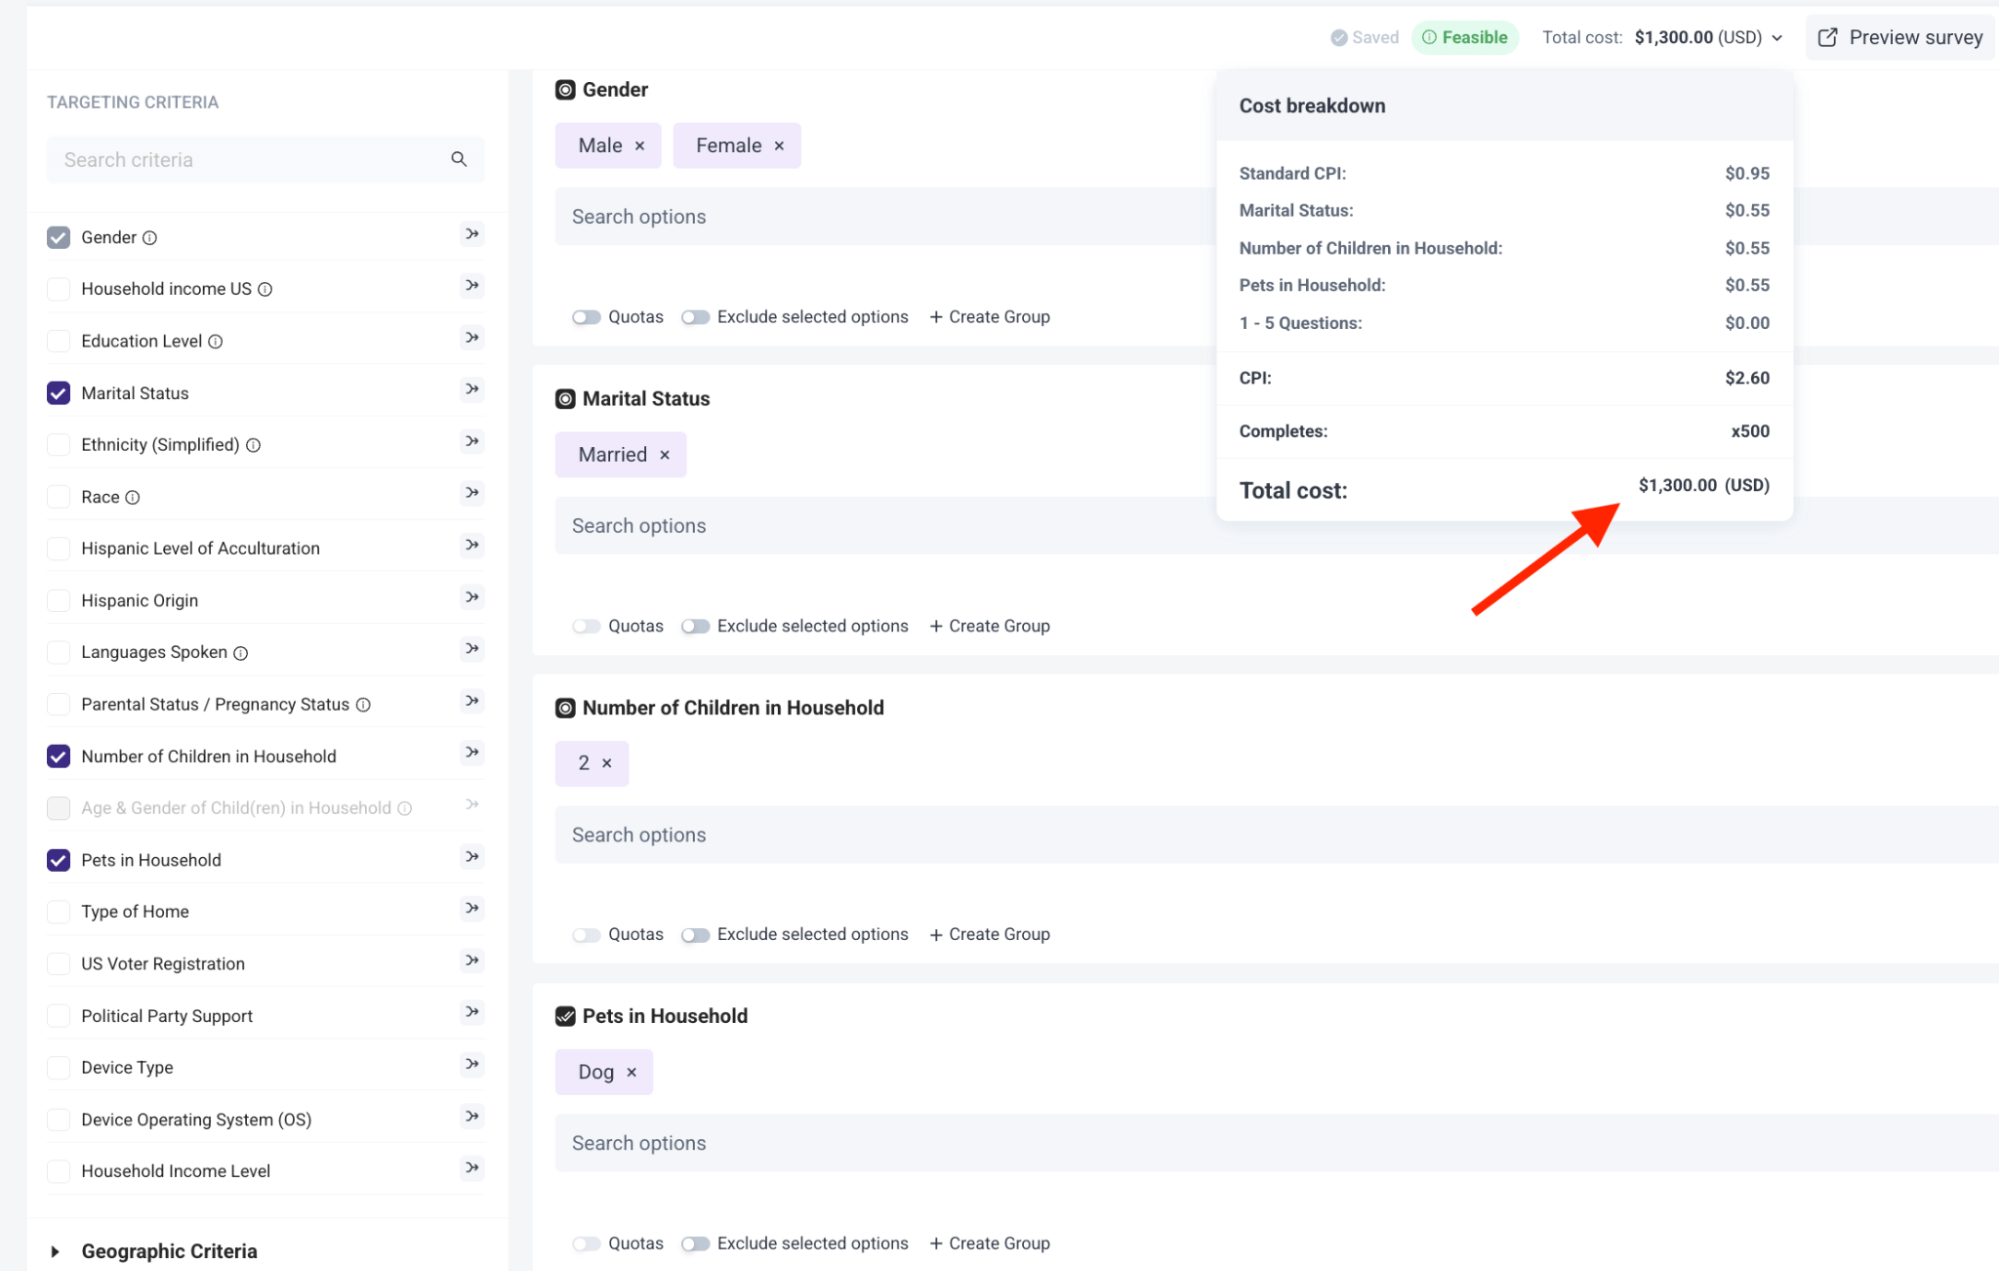
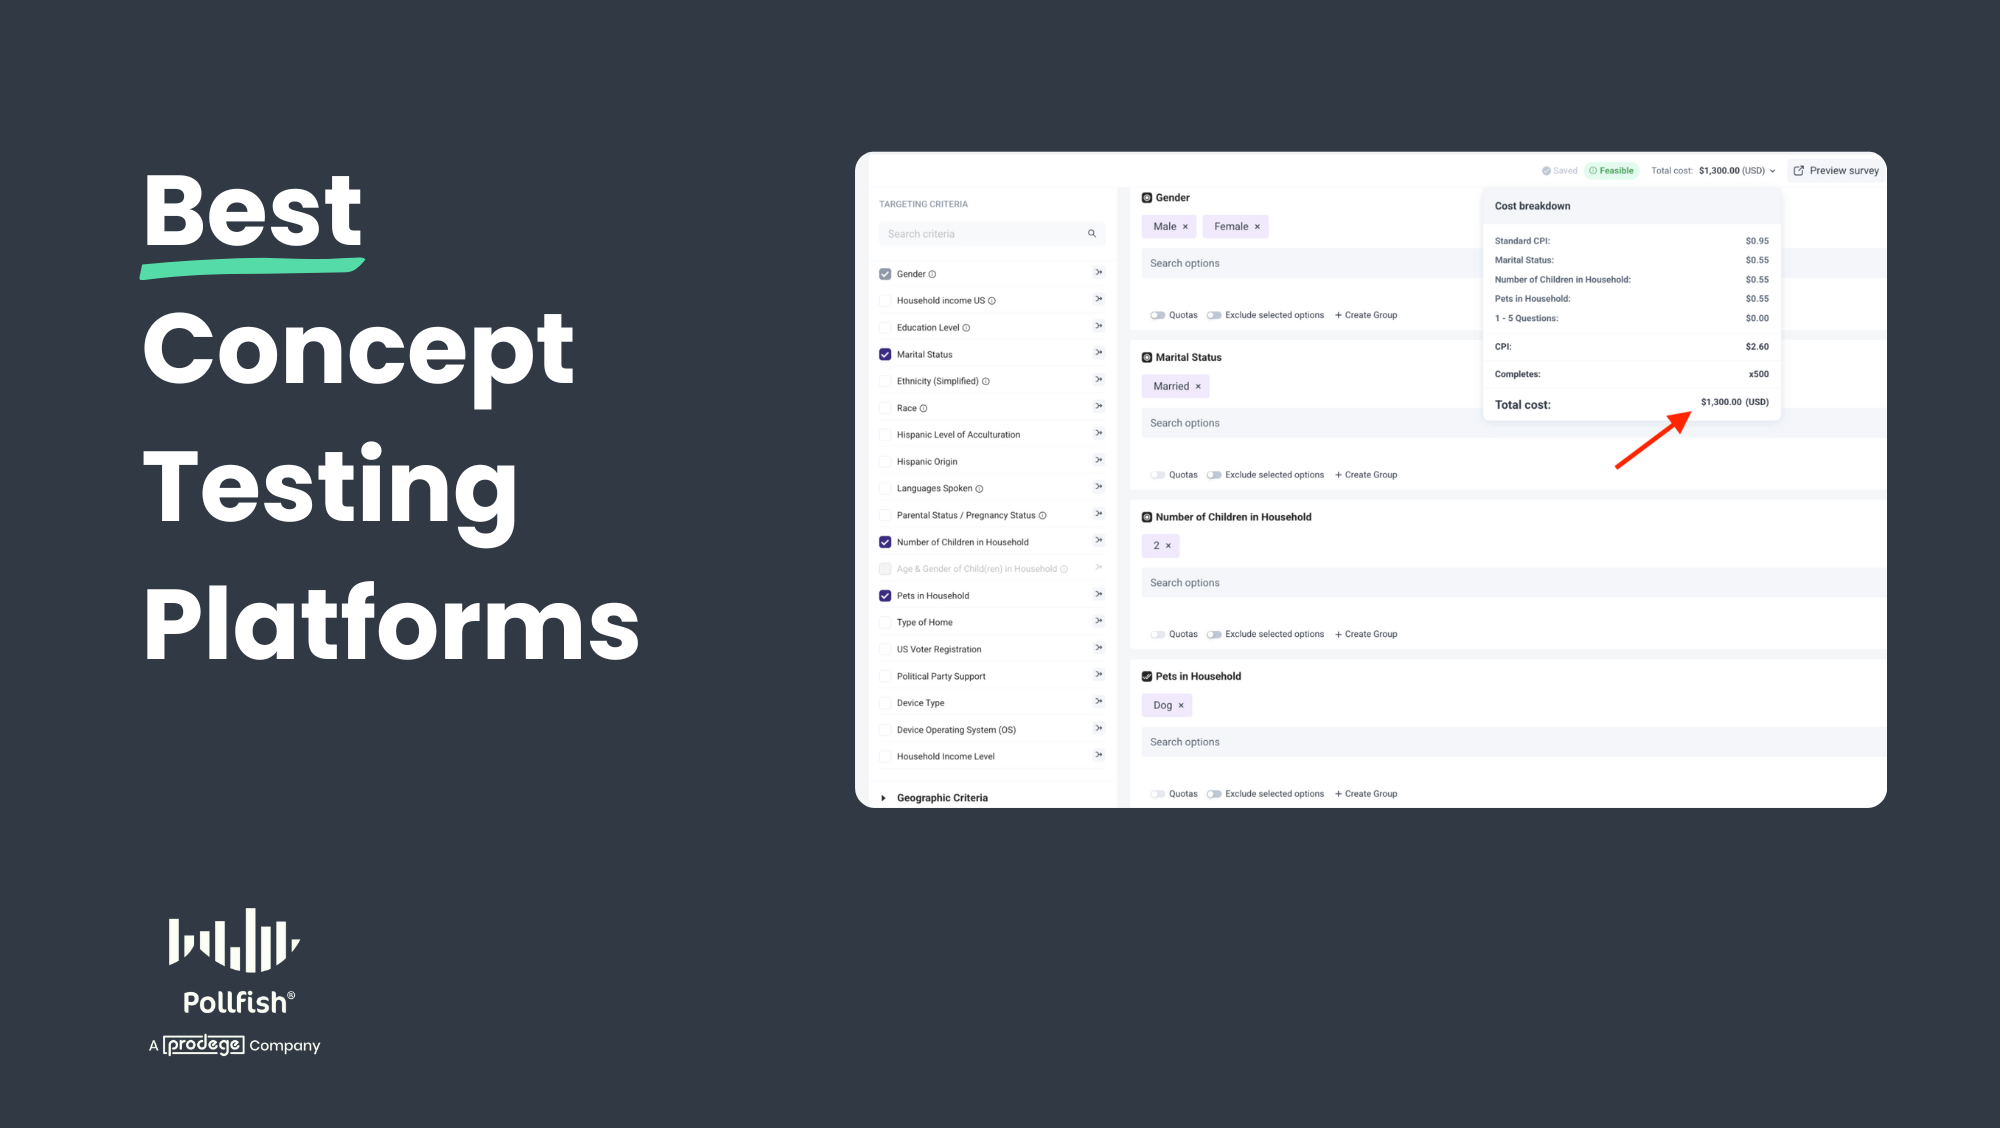
Here's a breakdown of the survey cost example above:
- Base Cost: Each response costs $0.95.
- Added Filters: Three extra filters (Marital Status, Number of Children, Pets in Household) are applied, each adding $0.55 to the cost per response.
- Adjusted Cost: With these filters, the cost per response is now $2.60 ($0.95 + $0.55 + $0.55 + $0.55).
- Total Survey Cost: For 500 completed responses, the total survey cost is visibly displayed upfront as $1,300 ($2.60 x 500).
- Dynamic Pricing Calculator: See the total survey cost instantly update as you add or remove additional filters. Pricing is transparent at all times.
As several Pollfish customers have stated on Trustpilot:
“The dollar amount they quote you in their cost calculator tool, and the number they show when you're developing the survey, is the number you pay. I was burned multiple times by [competitor] charging me unexpected amounts and making it difficult to quit an expensive subscription. I'm so happy to have found Pollfish as an alternative. Their support team also responds VERY quickly to chat messages and has been tremendously helpful the few times I had questions.”
– Read the full review here
“The pricing is clear and transparent from the beginning. The results come quickly and can be downloaded in different formats and with different filters. What we like most is the ability to filter the results and analyze them separately for each segment. We highly recommend this platform.”
– Read the full review here
“They charge based on the completed response. It is very fair and transparent. As a researcher, I have used many survey platforms, but they are the best so far.”
– Read the full review here
Fast Turnaround Times (From a Few Hours to Several Days)
Because Pollfish owns and manages its own respondent communities (through parent company Prodege), we are able to deliver incredibly fast turnaround times.
❇️ For general population audiences, you can receive several hundred responses in just a few hours, as several customers have noted:
“I needed a 25 question survey answered, and was able to get 500 completed surveys in 8 hours with Pollfish. The presentation of the results is very impressive and the demographics information Pollfish provided is invaluable.”
– Read the full review here
“The thing that amazes me most is how quickly you can get your data results back. So fast! Usually in a couple of hours.”
– Read the full review here
“I honestly thought the results would take days, and I was starting to get worried because I was using Pollfish for a quarterly goal and I was trying to make it before the deadline. However, I received the results in literally just a few hours!”
– Read the full review here
“Much more affordable than all the alternatives I found, and I had all my results ready within just a couple of hours.”
– Read the full review here
❇️ For more specific audience segments (e.g., pet owners in NYC earning over $100,000 who frequently buy dog food), the turnaround time is naturally longer, typically a couple of days. As several customers have noted:
“I'm amazed at how quickly the platform was able to deliver rich, segmentable data from over 500 respondents. I had feature-ready insights in only 3 days.”
– Read the full review here
“I've used Pollfish before so when I needed to test concepts for a new business pitch in 5 countries over the holiday, I turned to Pollfish. The surveys were easy to set up, allowed me to select my very specific target and launched right away. Within a couple of days I had my results in an easy to interpret, actionable format well within my budget.”
– Read the full review here
“I found the platform super-easy to use and we received feedback on our new name and logo from our target audience within a few days.”
– Read the full review here
Powerful Administrative & Collaboration Tools
As stated, Pollfish offers unlimited team seats and no license fees.
On the backend, you can configure robust administrative and collaboration features via our intuitive dashboard. For example:
❇️ Easily add team members and assign roles — individually or in bulk:
- Admin: Can create and launch surveys. Can access and modify payment methods, and view invoices. Can add, remove, and modify team members.
- User: Has the same permissions as an Admin, except they cannot add, remove, or modify team members.
❇️ Users can quickly view their assigned teams under the “My Teams” section.
❇️ Easily switch between different team views using an intuitive toggle option in the main menu.
❇️ Brand your surveys by adding your company logo, which will appear at the top of the survey results page for team members.
❇️ Organize projects by creating folders for different surveys.
Interested in Learning More?
We invite you to schedule an introductory call to learn more about how Pollfish can fulfill your specific needs.
2. Qualtrics
Qualtrics is an enterprise survey software which categorizes its features in 3 key areas:
1. Customer Experience
- Voice of Customer
- Omnichannel Experience Management
- Digital Experience Analytics
- Website & App Feedback
- Location Experience Hub
- Online Reputation Management
- Contact Center Analytics
- Quality Management & Compliance
- Agent Coaching
- Edge Instant Insights
2. Employee Experience
- Employee Engagement
- Employee Pulse
- Employee Research
- Candidate Experience Management
- Employee Onboarding & Exit
- 360 Development Feedback
- Employee Retention Analytics
- Continuous Employee Listening
3. Strategy & Research
- Strategic Market Research
- Product Research
- Brand and Communication Research
- User Experience Research
- Edge Audiences
3. SurveyMonkey
SurveyMonkey offers several features and capabilities that enterprise companies may find useful:
- Multi-survey dashboards
- Centralized admin dashboard (easily create, manage, and organize users)
- SSO (Single Sign-On)
- HIPAA compliance
- Sophisticated data encryption
- 2FA (Two-Factor Authentication)
- Powerful integrations with Salesforce, HubSpot, Marketo, Tableau, Microsoft Power BI, and more
4. Alchemer
Alchemer (formerly known as SurveyGizmo) is an enterprise survey software with various features and capabilities:
- Collect feedback through traditional market research surveys or in real-time as customers are using your app or website.
- 400+ integrations (e.g., Salesforce, Slack, Tableau, and more)
- Flexible workflow automations
- Role-based dashboards and reports
- ISO 27001 and SOC2 Type 2 Certifications
- Data privacy (EU GDPR compliance)
5. SmartSurvey
SmartSurvey offers several features and capabilities that enterprise companies may find useful:
- Custom branded surveys & forms
- Email, SMS, web, and popups to collect feedback through multiple channels
- CRM, helpdesk, and database integrations (e.g., Salesforce, Monday.com, HubSpot, Microsoft Teams, Pipedrive, Slack, etc.)
- AI-powered insights and analysis
- GDPR, CCPA, and HIPAA compliant
- UK-based security measures
6. SurveySparrow
SurveySparrow offers several features and capabilities that enterprise companies may find useful:
- Custom domains to host surveys from your company’s site
- Custom CSS to style online surveys
- SPSS export for further statistical analysis
- Data security measures like GDPR compliance
- Sub accounts for various teams in your company
- SSO (Single Sign-On)
- Integrations (via webhooks, API, Zapier, etc.)
Interested in Learning More About Pollfish?
We invite you to schedule an introductory call to learn more about how Pollfish can fulfill your specific needs.
12 Best Brand Tracking Software Tools for 2025 (by Category)
Brand tracking software generally falls into two broad categories:
- Survey-focused platforms, which are ideal for collecting structured, quantitative data directly from your target audience to help you measure brand awareness, track perception over time, and more.
- Brand monitoring software, which specializes in tracking online mentions of your brand across social media platforms, news outlets, forums, review sites, and more.
In this post, we cover the following survey-based brand tracking software:
- Pollfish: Our survey-focused brand tracking software offering transparent pay-per-response pricing, quick turnaround time, and high-quality data. Well-suited for companies of all sizes, from small and medium businesses to large enterprises.
- Qualtrics: A survey platform whose pricing may be cost-prohibitive for smaller and medium-sized companies due to high monthly fees.
- Tracksuit: Measures brand health using recurring surveys and simple visual dashboards.
- Quantilope: A market research platform offering various research tools, including surveys.
- Latana: A research platform focused on non-incentivized surveys and large sample sizes.
- Kantar: Offers a suite of brand guidance and research tools and services.
- Attest: A consumer research platform offering multi-market surveys and brand tracking dashboards.
And then we cover the following monitoring-based brand tracking software:
- Brandwatch: A social listening platform with a built-in influencer marketing solution.
- Meltwater: Well-established reputation management tool for tracking mentions across different types of media.
- Awario: Offers brand management and sentiment analysis.
- Brand24: Monitors social media mentions and tracks metrics using AI.
- Ahrefs: An SEO platform that can be used to track branded search terms, backlinks, and visibility across the web.
1. Pollfish: DIY Survey Platform for Brand Tracking
Pollfish is a DIY survey platform used by companies of all sizes for a variety of research needs, with brand tracking being one of the most popular.
You can choose from pre-built brand research templates like Brand Awareness, Brand Diagnostic, Brand Perceptions, and CPG Brand Awareness & Perceptions, or create your own survey from scratch.
While the platform is easy to use, it also offers powerful features that let you customize every part of your survey to match your research goals.
In this section, we’ll cover:
- How to use Pollfish, from designing your survey to selecting your target audience and analyzing results.
- Pollfish’s first-party respondent communities, which provide higher-quality audiences and more reliable data.
- Our transparent, pay-per-response pricing model that’s more affordable and upfront than traditional subscriptions.
- Pollfish’s fast turnaround times, just a few hours for general audiences, or a few days for more niche segments.
- Complimentary support from seasoned market researchers to guide you on survey design, targeting, and analysis.
Let’s dive in.
How to Use Pollfish’s Brand Tracking Software in 3 Easy Steps
- Build your brand tracking survey: Start with one of our brand research templates or create a custom survey from scratch.
- Choose your target audience: Pollfish offers flexible audience targeting, so you can either reach general populations or highly specific groups based on your research goals.
- Review and analyze your results: View your survey data directly in the Pollfish platform. You can filter responses, compare segments, and create custom charts in your brand’s colors, all without needing to export to Excel.
Below, we’ll look at each of these in more detail.
Step 1: Design Your Survey
❇️ Brand Tracking Templates
![]()
![]()
Pollfish offers brand tracking templates built by research experts, so you don’t have to start from zero.
Benefits of using Pollfish’s templates include:
- Save time by starting with professionally written, customizable questions.
- Follow market research best practices to ensure clean, reliable data.
- Maintain consistency across surveys to track brand changes over time.
- Reduce setup errors with built-in logic and structure.
- Get results faster by minimizing survey design work upfront.
Popular templates include:
- Brand Awareness: Measure how many people have heard of your brand.
- Brand Perception: Understand how your brand is viewed by consumers.
- Brand Diagnostic: Assess overall brand health at a specific point in time.
- CPG Brand Awareness & Perceptions: Track familiarity and perception of Consumer Packaged Goods (CPG) brands.
❇️ 16 Question Types
Pollfish offers 16 different question formats to choose from, including multiple choice, open-ended, NPS, MaxDiff, A/B tests, and more, giving you the flexibility to design surveys that match your research needs.
Read the full list of question types here.
❇️ Advanced Questionnaire Design Features
Pollfish has a variety of advanced features that help you collect clean, unbiased data and tailor the survey experience for each respondent. Let’s take a look at some that you may want to use in your brand tracking surveys:
1. Skip Logic Branching
Guide participants through different paths in your survey based on how they respond to earlier questions.
- Example: Ask “Which type of skincare products have you purchased in the last month?” If they select “Moisturizers,” they’re shown questions tailored to that category. If they choose “Acne treatments,” they’re routed to a different set of questions focused on that product type. This ensures each respondent gets a relevant experience, and your data reflects meaningful subgroup insights.
2. Shuffle Answers
Randomize the order of answer choices to prevent order bias.
- Example: When asking respondents to choose their favorite athletic shoe brand, some may unconsciously choose the first option if the list is always presented in the same order. Shuffling the choices ensures that no brand is unfairly favored by its position.
3. Randomize Questions
Change the order in which questions are shown to different respondents.
- Example: If your survey includes 10 brand attribute questions, randomizing them can help reduce response patterns or fatigue, especially if someone tends to rush through later questions.
4. Screening Questions
Filter out participants who don’t meet specific criteria before they enter the main portion of the survey.
- Example: If someone selects “I’ve never heard of this brand,” then they won’t be able to proceed with the survey.
5. “Other” and “None of the Above” Options
Quickly add these common answer choices to relevant questions with one click.
- Example: When asking, “Which of the following brands have you heard of?” including “Other” and “None of the above” helps you capture more complete and accurate responses without needing to add those options to every question manually.
Note: This is just a small sampling — explore the full list of survey design capabilities here.
Step 2: Select Your Target Audience
Pollfish gives you access to a broad and diverse set of respondents through our first-party network (through parent company Prodege), with tools to help you precisely define your ideal audience.
❇️ 50+ Audience Filters Across 6 Categories
Target respondents via 50 filters in six categories, including Demographics, Geographic Criteria, Consumer Lifestyle, Employment & Occupation, Behavioral Data, and Media.
For example, you can survey urban professionals aged 30 to 45 who read digital news daily, work in tech or finance, and regularly dine out at least three times a week.
❇️ Target Specific Shoppers
Refine your audience to include consumers who’ve purchased specific brands or visited particular stores, based on verified receipt data.
For example, instead of targeting all athletic shoe buyers, you can narrow your audience to people who’ve recently purchased from Nike, Adidas, or New Balance, or who regularly shop at retailers like Dick’s Sporting Goods or Foot Locker. (Later on, we cover in more detail how we verify that they’ve actually made these purchases.)
❇️ Set Audience Quotas
Ensure a balanced sample by setting quotas on attributes like age, gender, income, etc.
For example, if you want to compare perceptions across income groups, you can set quotas to ensure one-third of your sample earns under $50K, one-third earns $50 to 100K, and one-third earns over $100K.
That’s only scratching the surface of what you can do with Pollfish targeting, but you can view the full video demonstration here.
Step 3: Analyze the Results
Once responses start coming in, Pollfish gives you a range of tools to explore, filter, and share your findings. There’s no need to export data to external platforms unless you want to.
❇️ Visualize Results Instantly
You can view your survey result data in real time without waiting for a post-survey download. Results are automatically displayed as color-coded charts, graphs, and tables, making it easy to understand trends at a glance.
❇️ Filter by Segment or Response
Pollfish lets you break down your data by specific audience segments or individual responses.
For example, if you want to see how Gen Z respondents rated your brand versus Gen X, you can isolate that group and instantly update your visuals. You can also filter by specific answer choices: for instance, viewing only those who selected “highly likely to purchase.”
❇️ Analyze Multiple Variables at Once
You can layer multiple filters to uncover deeper insights without needing to export your data.
Let’s say you want to compare brand perception among women aged 35 to 44 who live in urban areas and earn over $75K annually. You can easily set those filters and see the exact results for that audience. The platform will automatically update your charts so you can compare across segments without additional setup.
❇️ Match Charts to Your Brand Colors
Pollfish allows you to customize the look and feel of your charts by applying your brand’s color palette. This helps ensure that your reports feel consistent with your company’s visual identity, which is especially important when sharing insights with stakeholders, presenting to clients, or incorporating charts into larger brand deliverables.
❇️ Statistical Testing
Pollfish includes built-in stat testing so you can validate whether observed differences in your data are meaningful.
Suppose 82% of respondents aged 25 to 34 recognize your brand, compared to 68% of respondents aged 45 to 54. Pollfish can automatically test this difference for statistical significance and highlight the results within your charts. No need to use manual tests or export to another tool.
❇️ Build Presentations in the Platform
Pollfish lets you start building your presentation as soon as responses begin to roll in, so you don’t have to wait until the survey is complete. You can organize insights, add visualizations, and begin shaping your narrative while data is still being collected. Once you're ready to finalize, export everything into an editable PowerPoint file to polish and share with your team.
❇️ Export Your Data
You can download your results as a PDF, Excel file, SPSS dataset, or crosstabs, depending on your workflow. This flexibility makes it easy to bring your data into whatever tool your team uses for deeper analysis or final reporting.
These are only some of the analysis tools built into the Pollfish platform.
Pollfish’s High Audience Data Quality
For brand tracking to be meaningful, you need accurate, thoughtful responses from real people, not rushed answers from disengaged panelists or fraudulent bots. Here’s how Pollfish approaches audience sourcing and quality control.
❇️ Sourced from a Verified First-Party Network
Pollfish operates through a proprietary respondent network built and maintained by our parent company, Prodege. Unlike platforms that rely on third-party panel aggregators, our audience comes from a trusted ecosystem where respondents engage in real-world activities, such as uploading receipts, shopping online, playing games, or completing microtasks. These behavioral touchpoints create a built-in safeguard against bots and fake users.
As one of our customers shared on Trustpilot: "The most important point to make is that I trust the responses of my survey. My target audience was very specific and I could tell that the responses were legitimately coming [from] subjects in my target audience.”
❇️ Respondents Opt In, Not Burn Out
Pollfish respondents aren’t bombarded with constant survey invites. Instead, they choose when to participate. This opt-in model attracts more thoughtful and attentive participants, which is essential when measuring nuanced brand perceptions over time.
❇️ 14-Day Evaluation Before the First Question
Before new panelists ever see a live survey, they go through a 14-day onboarding phase where they complete internal profiling surveys. Only those who demonstrate consistent, high-quality participation are invited into the active respondent pool, so your brand tracking survey data is built on a solid foundation from the start.
❇️ Fraud Prevention Built into Every Survey
Pollfish applies multiple layers of quality control to each response. This includes:
- Unique user IDs to block duplicates
- Attention checks and trap questions
- Speeding detection and gibberish filtering
- Anti-VPN and device fingerprinting
- Straight-lining detection
- Human oversight for each and every manual response
❇️ Trust Scores That Promote Better Behavior
Every respondent is assigned a dynamic trust score based on their response patterns and long-term behavior. Higher scores unlock more opportunities within the Prodege ecosystem, creating a real incentive for thoughtful, honest participation.
Like one of our customers noted on Trustpilot:
“Each time I use this service I am blown away by the speed with which the responses come in and with the detail which most of them include. You can tell that the respondents take this very seriously. They must really enjoy doing it.”
Note: These are just some of the ways that we ensure your brand tracking insights are based on clean, reliable data. Learn more here.
Pay-per-Response Pricing That Scales with Your Needs
Pollfish uses a usage-based pricing model that starts at just $0.95 per completed response, making it easy to scale your brand tracking efforts up or down depending on your goals and budget.
❇️ No Subscriptions, No Commitments
You’re never locked into a long-term plan or paying for unused response quotas. Whether you're launching a single brand tracking survey or running them on a recurring basis, you only pay for what you use.
As noted on Trustpilot by a Pollfish customer, “They charge based on the completed response. It is very fair and transparent. As a researcher, I have used many survey platforms, but they are the best so far.”
❇️ Unlimited Team Members Included
Collaborate freely across all departments at no extra cost. Pollfish allows unlimited users under one account, unlike other platforms that charge per seat.
Transparent Pricing with No Surprises
Pollfish makes it easy to understand exactly what you’re paying before you ever launch your survey.
❇️ No Hidden Fees
Your total cost is calculated based on the number of responses and any targeting filters you apply. There are no added charges behind the scenes.
As two of our customers shared on Trustpilot:
“The dollar amount they quote you in their cost calculator tool, and the number they show when you're developing the survey, is the number you pay. I was burned multiple times by SurveyMonkey charging me unexpected amounts and making it difficult to quit an expensive subscription. I'm so happy to have found Pollfish as an alternative. Their support team also responds VERY quickly to chat messages and has been tremendously helpful the few times I had questions.”
“The pricing is clear and transparent from the beginning. The results come quickly and can be downloaded in different formats and with different filters. What we like most is the ability to filter the results and analyze them separately for each segment. We highly recommend this platform.”
❇️ Full Price Transparency
As you build your survey and apply targeting filters, your total cost is clearly displayed in real time in the upper right-hand area.
For example:
- Base cost per response: $0.95
- Add targeting for household income over $150K: +$0.55
- Add targeting for respondents who shop at premium grocery stores: +$0.55
- Final cost per response: $2.05
Need 800 responses for your brand tracking survey? You’ll pay exactly $1,640, visibly displayed upfront — no surprises, no hidden fees.
This level of clarity makes budgeting for brand tracking surveys simple and predictable.
Fast Turnaround Time From a Few Hours to a Few Days
When you're tracking brand performance, timing matters. Pollfish helps you get results quickly, so you can take action without delay.
❇️ General Population Surveys Typically Come Back Within a Few Hours
If your brand tracking survey targets a broad audience, like adults in the U.S., smartphone users, or pet owners, you can often collect hundreds of responses within just a few hours. This makes it easy to monitor shifts in awareness or perception shortly after a product launch, PR event, or ad campaign.
Like our customers have pointed out on Trustpilot:
"The thing that amazes me most is how quickly you can get your data results back. So fast! Usually in a couple of hours."
“I needed a 25 question survey answered, and was able to get 500 completed surveys in 8 hours with Pollfish. The presentation of the results is very impressive and the demographics information Pollfish provided is invaluable.”
“I honestly thought the results would take days, and I was starting to get worried because I was using Pollfish for a quarterly goal and I was trying to make it before the deadline. However, I received the results in literally just a few hours!”
– Read the full review here
“Much more affordable than all the alternatives I found, and I had all my results ready within just a couple of hours.”
❇️ Niche or Highly Targeted Audience Surveys Usually Take a Few Days
If you’re targeting a more specific segment, such as high-income earners who buy from premium skincare brands, or Gen Z consumers in urban areas with a strong interest in sustainability, it may take a few days to complete. That’s because these groups are smaller and more defined, but Pollfish still delivers faster results than most other platforms in the same category.
Our customers have pointed out how quickly results come back in Trustpilot reviews:
“I'm amazed at how quickly the platform was able to deliver rich, segmentable data from over 500 respondents. I had feature-ready insights in only 3 days.”
“I've used Pollfish before so when I needed to test concepts for a new business pitch in 5 countries over the holiday, I turned to Pollfish. The surveys were easy to set up, allowed me to select my very specific target and launched right away. Within a couple of days I had my results in an easy to interpret, actionable format well within my budget.”
Complimentary Advanced Support from Brand Tracking Research Experts
Designing a great brand tracking survey isn’t always straightforward, especially if you’re new to market research or juggling multiple priorities. That’s why Pollfish offers free, on-demand support from seasoned market research experts who know the ins and outs of survey design, audience targeting, and data analysis.
❇️ Free 24/7 Support (Yes, Really)
Our support team is available 24/7 via live chat with no additional fees and no hidden limitations. And unlike platforms that rely on scripted chatbot responses, you’ll speak with real people who understand research.
Take it from one of our customers:
“The customer support agents were awesome. They responded to every question I had in a timely manner. (And before we even paid a cent!)”
❇️Help When You Need It, At Any Experience Level
Whether you’re launching your first brand equity survey or are an experienced market researcher seeking a second set of eyes, our team can help you choose the right approach, validate your targeting criteria, or sanity-check your questionnaire.
As noted by several Pollfish customers:
“The customer service I received was fantastic. Brilliant guidance that helped get high-quality results. I was really pleased with the outcome and highly recommend using them.”
“The customer service team is super responsive too for those more complex enquiries about the tool and criteria. All in all this experience has been way easier (and cheaper) than any other 'big players' out there”
“I love this product. I feel like it gives me enterprise grade market survey tech at a consumer price. Highly recommend. I love how responsive the customer support team is.”
Get Started with Pollfish
Ready to start running brand tracking surveys? Pollfish makes it easy to get started.
You have three flexible options:
- Create a free account: Explore the platform and start building your brand tracking survey at your own pace. No credit card required.
- Schedule a demo walkthrough: Get a guided walkthrough tailored to your brand tracking goals.
- Inquire about full-service brand research through our parent company Prodege: Prefer to hand it off? Our in-house research team can manage everything for you from survey design to audience selection, data analysis, and a final report customized to your objectives.
2. Qualtrics
Qualtrics is best suited for large enterprises that need brand tracking survey capabilities. It’s often priced out of reach for smaller teams. We discuss what differentiates Pollfish in our article on the best alternatives to Qualtrics.
Key Features
- Enterprise-grade customer survey tools with omnichannel distribution (email, SMS, digital, post-call, and more)
- AI-powered text and sentiment analysis
- Dozens of pre-built, expert-designed survey templates
- Custom dashboards and reports tailored to specific teams or roles
- Automated closed-loop customer feedback and ticketing workflows
- Real-time customer journey insights and VoC data routing
- Integrations with ticketing systems and CRM platforms
3. Tracksuit
Tracksuit is a brand tracking survey platform that’s great for marketing teams that want to track awareness, consideration, and preferences with an intuitive dashboard that’s easy to share and present.
Key Features
- Always-on tracking of brand awareness, consideration, and preference
- Visual dashboards showing performance across the full brand funnel
- Segment-level actionable insights by gender, region, and age
- Competitive benchmarking across messaging, values, and perception
- Timeline views to track brand growth and campaign impact over time
- Surveys managed by Tracksuit’s in-house research team
4. Quantilope
Quantilope is another tool that can help you run brand tracking surveys. It combines advanced methodologies like MaxDiff and conjoint analysis with automation and AI tools to streamline complex studies from setup to reporting.
Key Features
- 15 fully automated advanced research methods, including MaxDiff, TURF, and conjoint
- AI-powered co-pilot (quinn) to guide survey creation and analysis
- Drag-and-drop survey builder with pre-built templates
- Real-time data collection and analysis
- Automated tracking studies with flexible time-based filters
- Exportable dashboards and PowerPoint reports with statistical testing
- Integrated insights repository for long-term knowledge management
5. Latana
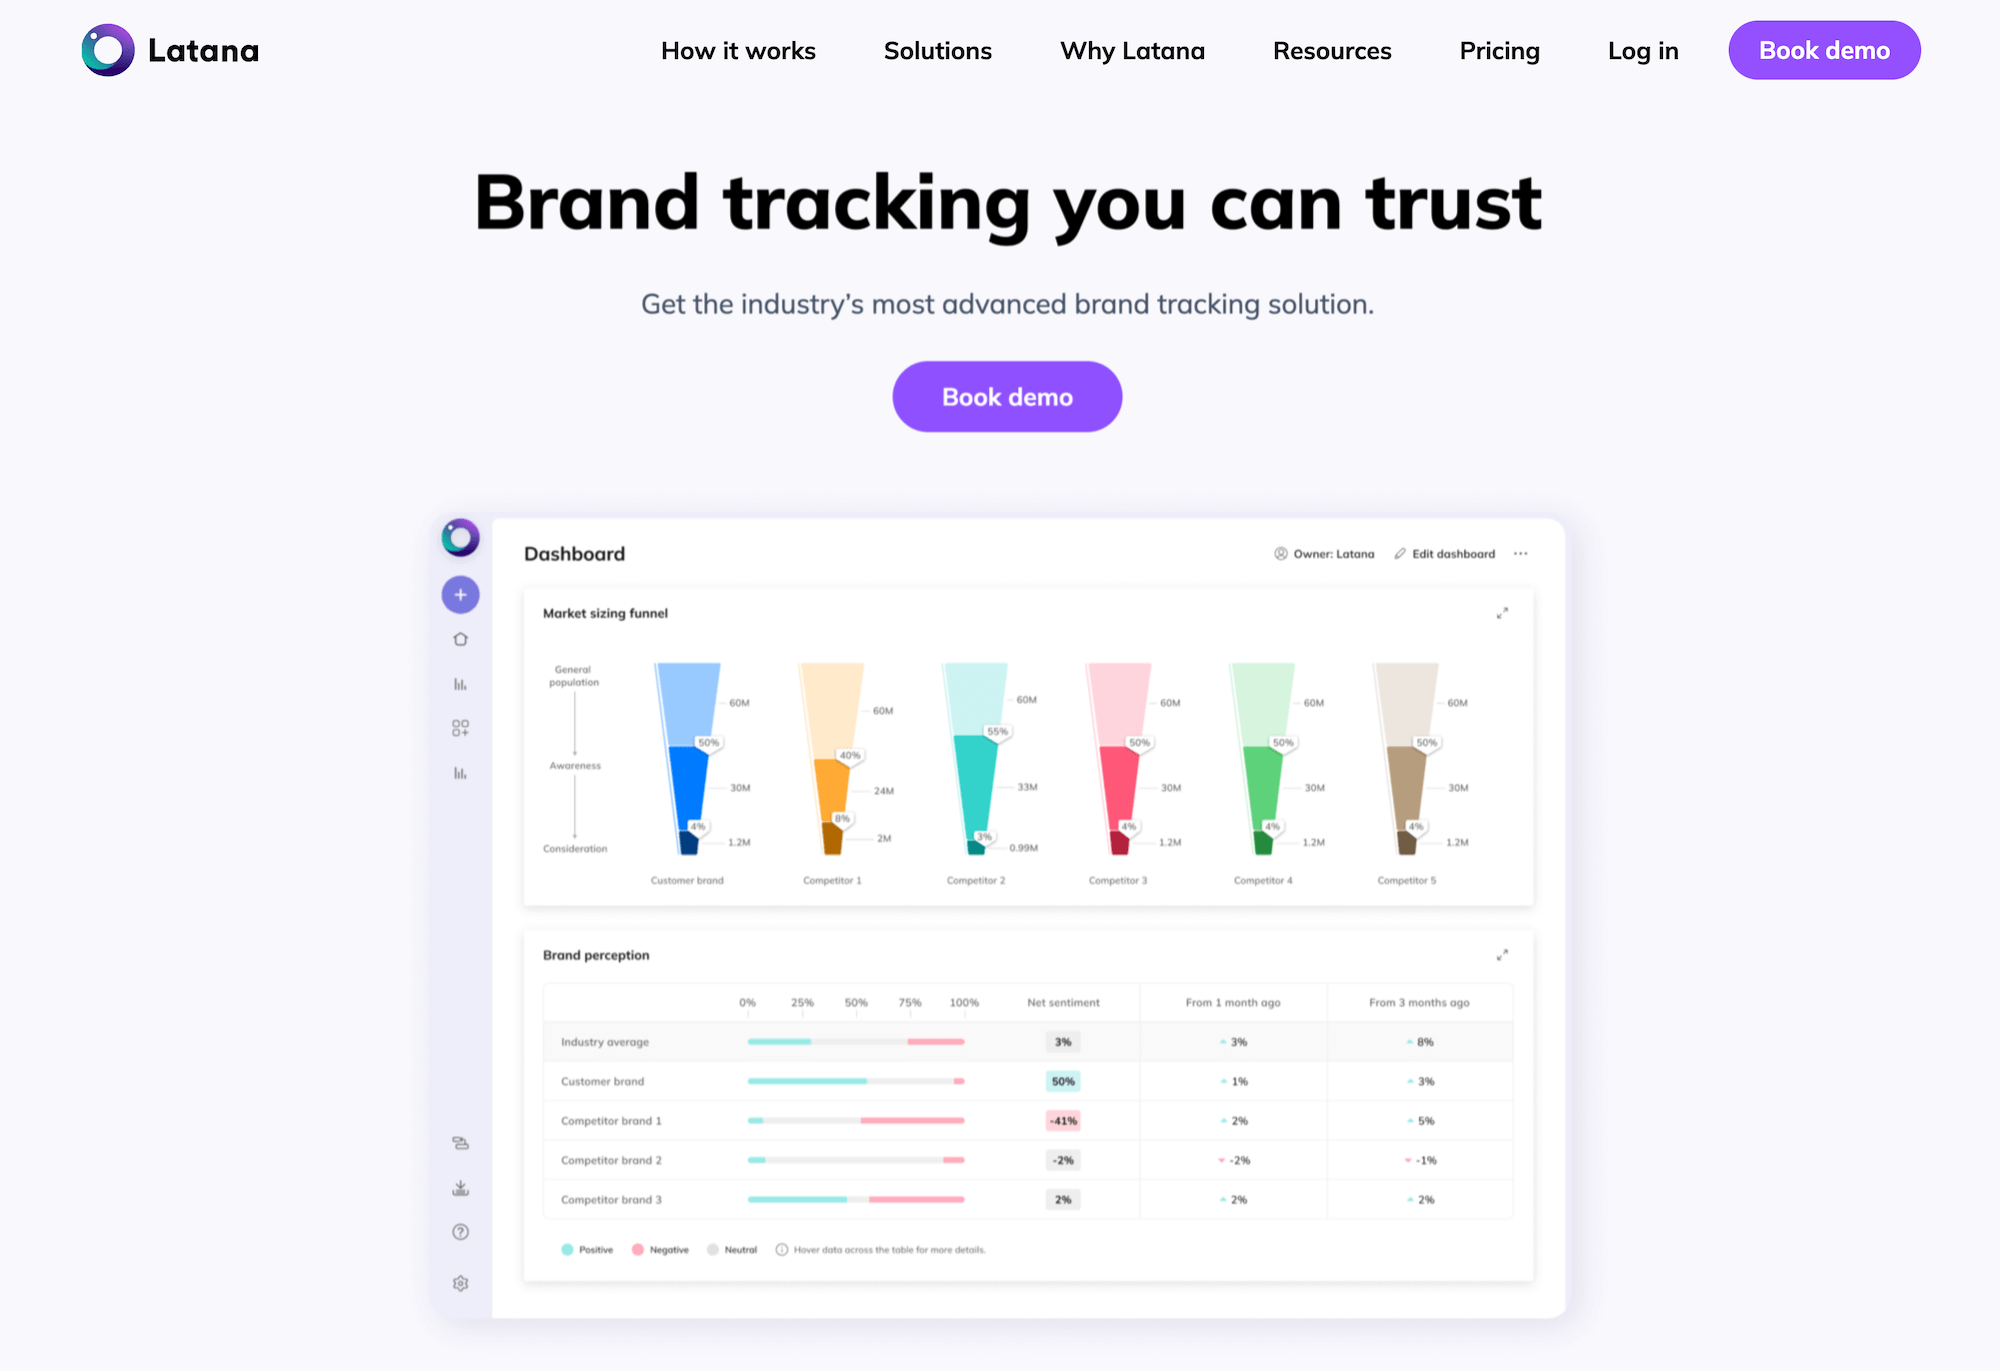
Latana is another brand tracking platform that can help you measure brand awareness and perception at scale via surveys.
Key Features
- Access to non-panel respondents for more representative sampling
- Fully integrated solution from data collection to insight generation
- Monthly dashboard updates with segment tracking and automated significance testing
- Flexible modular setup for adding markets, switching packages, or running ad-hoc research
- Real-time, ad-based sampling and machine learning-powered QA
- Intuitive dashboard with error margins and trend visualizations
6. Kantar
Kantar combines robust brand tracking tools with global panel access and full-service consulting. It’s designed for enterprises that need both DIY flexibility and high-touch strategic support for equity measurement and forecasting.
Key Features
- Extensive brand tracking tools, including BrandDynamics, BrandEvaluator, and BrandSnapshot
- Access to 170M+ global respondents in 100+ markets
- Custom survey design and expert consultation services
- Device-agnostic survey experiences to improve data quality
- Award-winning programming tools and question component library
- Integrated dashboards and visualizations for reporting and insight sharing
- Enhanced data reliability with connected datasets and fraud prevention
7. Attest
Attest is a flexible, self-serve survey platform that’s great for brands that need fresh, ongoing consumer insights across multiple regions.
Key Features
- Always-on brand tracking to monitor awareness and perception over time
- Localized surveys with translations and regional targeting
- Flat audience cost with no hidden platform fees
- Side-by-side segment comparisons and crosstab insights
- Custom research capabilities tailored to brand KPIs
- Expert research support included at no extra cost
- Reach up to 150M+ people in 59 countries with surveys in 70+ languages
Next, we’ll take a look at five monitoring-based brand tracking software options.
8. Brandwatch
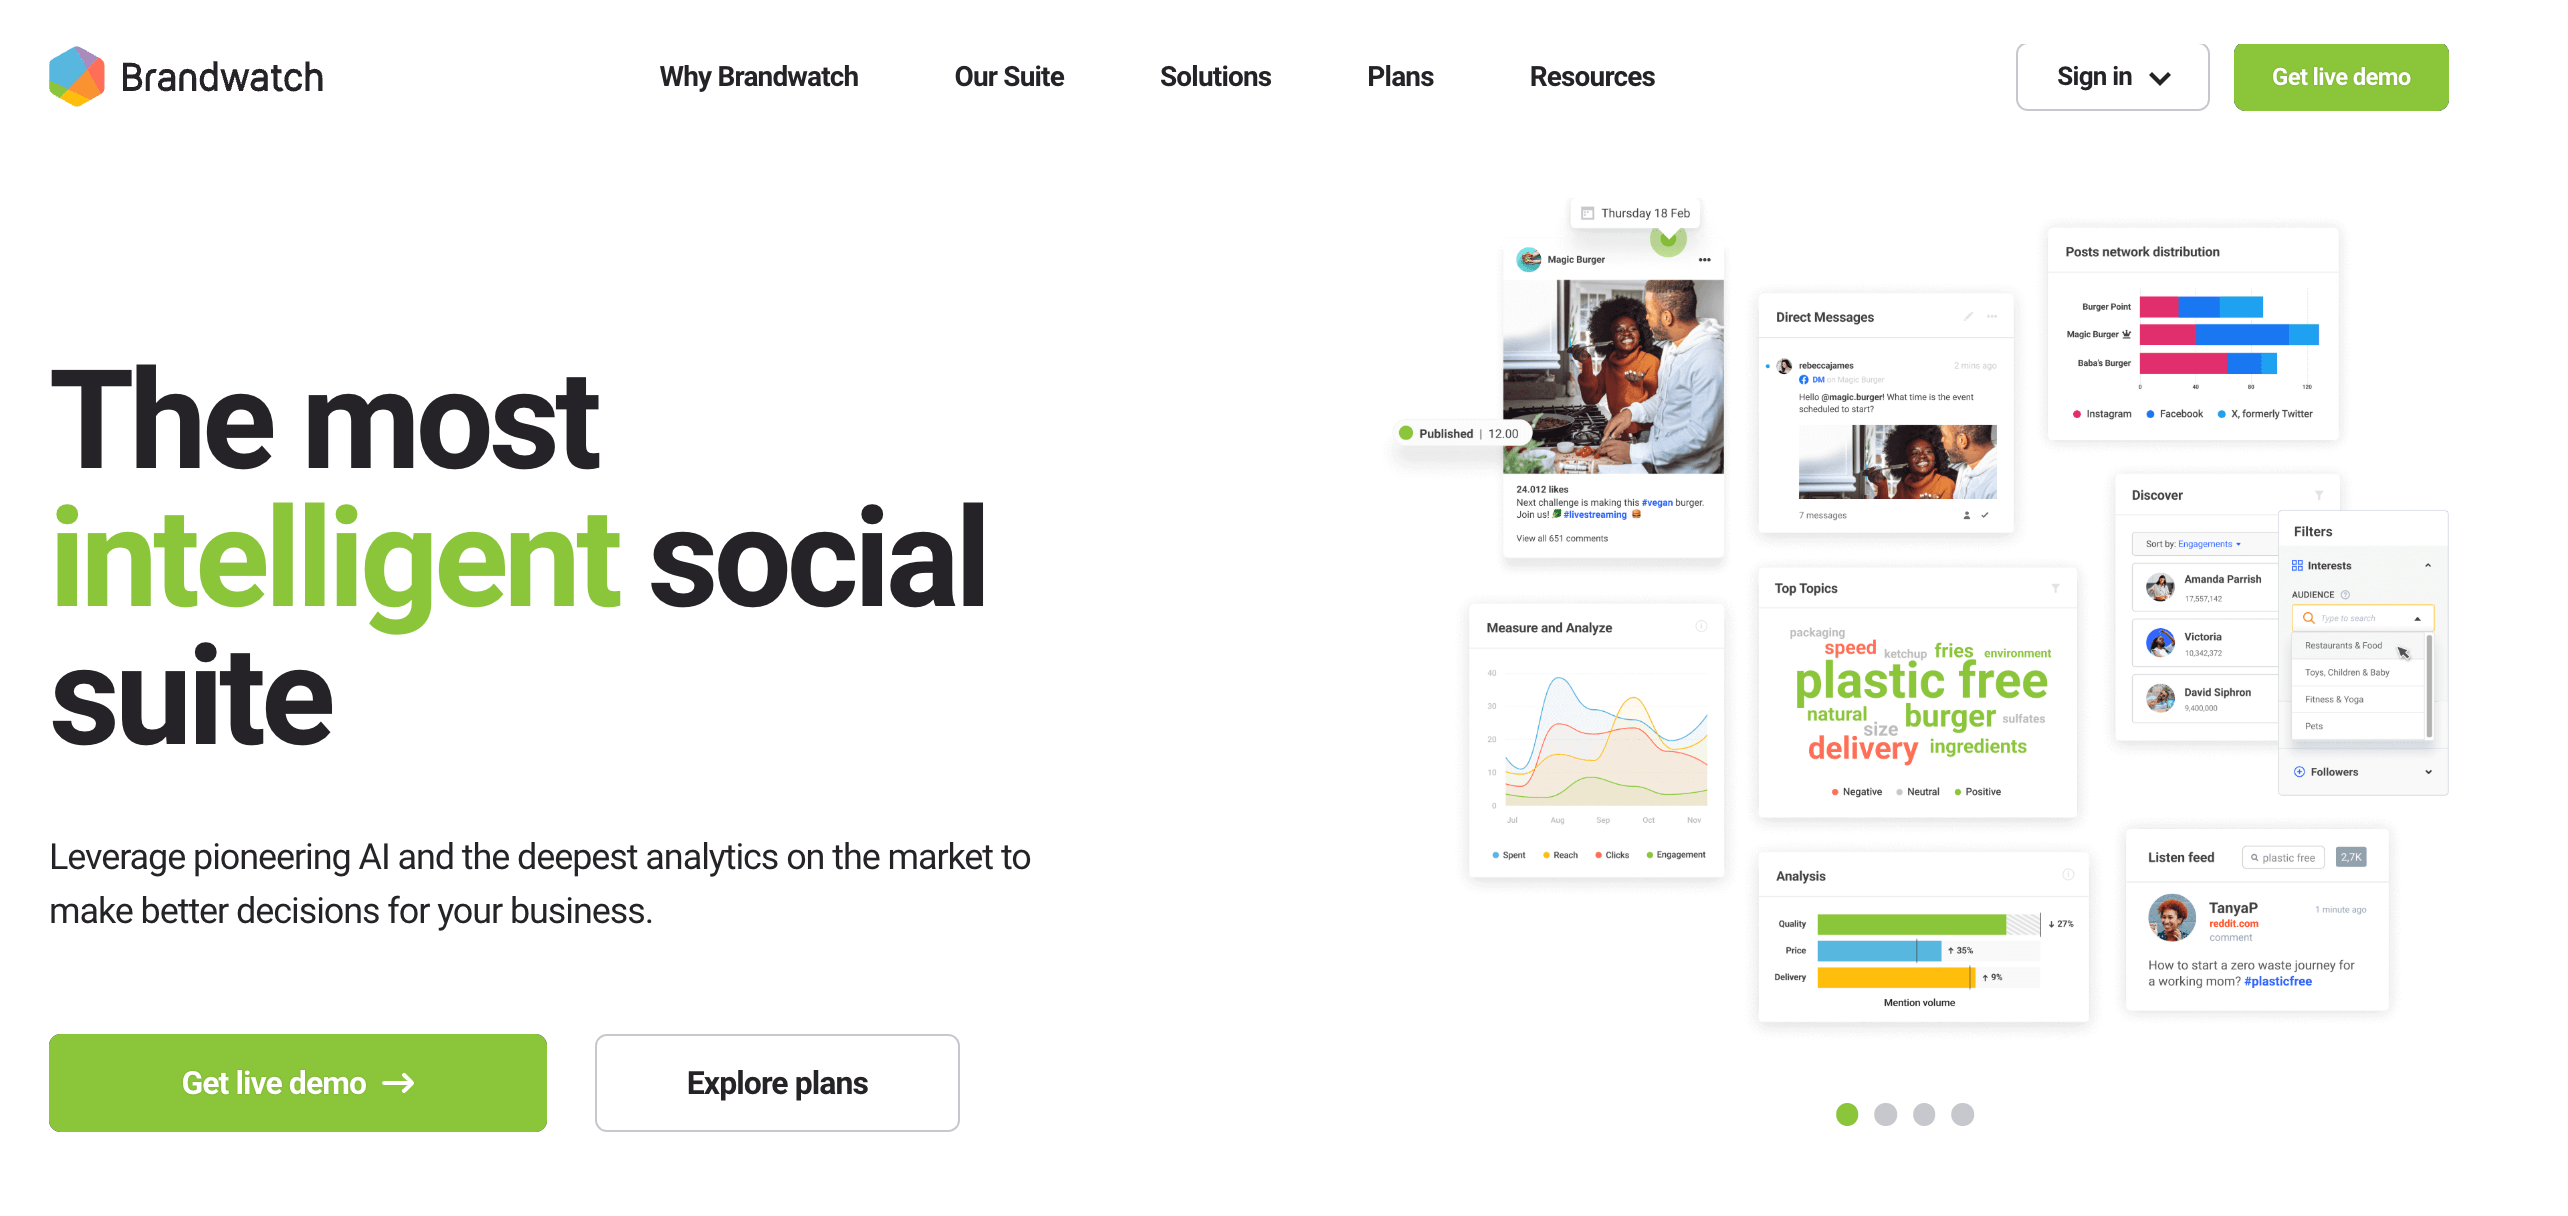
Brandwatch is a robust social intelligence platform built for marketers who need to understand how their brand is discussed across the digital landscape. It excels at social listening, trend analysis, and competitive benchmarking, making it ideal for teams focused on brand perception and engagement.
Key Features
- Real-time monitoring across social media, news, blogs, forums, and broadcast media
- AI-powered sentiment analysis and trend detection
- Historical data access for long-term brand studies
- Share of voice tracking to compare brand visibility
- Influencer identification and marketing campaigns measurement
- Custom dashboards for brand health metrics and messaging impact
- Seamless integration with MarTech stacks for reporting and brand strategy
9. Meltwater
Meltwater offers a comprehensive suite for media intelligence, combining digital and traditional media monitoring with PR analytics and social listening. It's well-suited for organizations managing brand reputation, measuring media impact, and aligning comms with marketing strategy.
Key Features
- Monitoring of brand mentions across online, print, broadcast, and social media
- Reputation tracking with sentiment and advanced analytics
- PR campaign performance measurement and media outreach tools
- 360° reporting to evaluate strategy impact across departments
- AI-powered actionable insights for trend spotting and decision-making
- Tools for influencer marketing and consumer intelligence
- Social media management and audience engagement capabilities
10. Awario
Awario specializes in real-time social media monitoring across platforms like Twitter, forums, blogs, and news sites. It's built for teams that need to stay on top of conversations as they happen and react quickly to brand mentions or sales opportunities.
Key Features
- Real-time tracking of brand mentions across the web
- Brand sentiment analysis to gauge public opinion
- Boolean search for precise, flexible keyword tracking
- Influencer identification and conversation reach scoring
- Lead generation through Awario Leads, surfacing competitor complaints and product inquiries
- Email alerts and white-label reporting for streamlined workflows
- Multi-language, location-based monitoring with mobile access
11. Brand24
Brand24 offers simple, AI-enhanced media monitoring that makes it easy for small teams to track brand mentions, analyze sentiment, and generate competitive reports. It’s a strong fit for businesses that want reliable brand insights without the complexity of enterprise tools.
Key Features
- Real-time media monitoring across social, news, blogs, and reviews
- AI-powered brand sentiment analysis and topic identification
- Share of voice, influence score, and reach metrics
- Automated alerts and anomaly detection
- Customizable, white-label reports for stakeholders
- AI Brand Assistant for insights, comparisons, and recommendations
- Clean workspace with filters, folders, and starred mentions
12. Ahrefs
Ahrefs is a powerful SEO and content marketing platform designed to help teams monitor branded search performance, competitor visibility, and overall digital presence. While not a traditional brand tracker, it excels at showing how your brand performs in organic search and link-building efforts.
Key Features
- Brand Radar tracks mentions across websites, AI platforms, and competitors
- Rank Tracker monitors branded keyword rankings and share of voice
- Site Explorer analyzes traffic, backlinks, and competitive visibility
- Content Explorer surfaces brand mentions across billions of indexed pages
- Alerts notify you of changes in backlinks, rankings, and brand presence
- SEO dashboards and reports consolidate marketing campaigns' performance data
- AI Content Grader and auditing tools optimize branded content at scale
Get Started with Pollfish
To begin using Pollfish:
- Create a free account
- Schedule a demo walkthrough
- Inquire about our full-service brand research through our parent company, Prodege

Top 20 Market Research Companies in 2025: Key Strengths
Top 20 Market Research Companies in 2025: Key Strengths

Market research companies come in many different types, but most can be broadly categorized into three main buckets:
- Full-Service Market Research Firms: These firms provide comprehensive, end-to-end market research services spanning quantitative methods like surveys to qualitative approaches such as focus groups and one-on-one interviews.
- Industry Intelligence & Custom Research Firms: In addition to offering full-service consulting and bespoke research, these companies also provide access to existing data, reports, studies, and industry insights they have previously compiled. Their industry expertise is a key differentiator.
- Self-Service Survey Platforms: These technology platforms allow businesses to conduct their own market research surveys, though many also offer supported or fully-managed services.
Even though these buckets are a helpful starting point, they aren’t mutually exclusive. Plus, within each bucket, each company will have its own unique strengths and specialties.
In this guide, we'll explore 20 top market research companies and what sets them apart in today’s competitive landscape. We'll start with our parent company, Prodege, and our DIY survey tool, Pollfish.
Here’s a high-level summary of each company’s key strengths:
- Prodege: As the largest single panel owner in the world, with over 100 million respondents across 125+ countries, Prodege (Pollfish’s parent company) is a full-service market research firm renowned for exceptional survey data quality. You can opt for an end-to-end service or select specific areas you need help with, including research design, survey programming, sample & fielding, data processing & analysis, reporting, and more.
- Pollfish: Our powerful DIY survey platform with rigorous data quality measures, a flexible and transparent pay-per-response pricing model, and a quick turnaround time from a few hours for general population audiences to a few days for more specialized niches. We offer robust questionnaire design, audience targeting, and data analysis capabilities that seasoned market researchers appreciate.
- Kantar: Best known for their brand tracking & brand equity measurement capabilities, although they offer a vast range of other market research services.
- Mintel: Offer consulting and on-demand databases & reports, including GNPD (Global New Product Database), where you can learn about 40,000+ new products launched across 86 markets and 46 CPG categories every month.
- Bixa: Market research firm specializing in Gen Z insights (although they also provide comprehensive research services across other demographics and markets).
- MRI-Simmons: Best known for their in-depth consumer data and national studies, particularly their MRI-Simmons USA study.
- Ipsos: Offer custom research and consulting across a wide variety of sectors, but best known as a leader in public opinion polling and political research.
- Nielsen: Best known for their TV rating & audience measurement capabilities.
- Suzy: Best known for their survey platform capabilities. Also offer a unique feature called Suzy Live, where you can run multi-person focus groups, 1-on-1 interviews, and in-home product testing.
- SG Analytics: While they offer a wide variety of solutions, as it pertains to market research, they provide full-service consulting (e.g., primary, secondary, quantitative, and qualitative market research).
- Gartner: Market research giant that's best known for their market research literature and analyses across various technology sectors.
- Forrester: Market research powerhouse that provides data across multiple industries, with a particular focus on technology vendors.
- IDC: Consulting firm that specializes in IT and tech research.
- Drive Research: Boutique market research agency that can help with a wide range of quantitative and qualitative research needs.
- Statista: Massive data aggregator, with insights, facts and stats across 170 industries and 150+ countries.
- IBISWorld: Best known for their wide range of industry research reports across 5,000+ industries.
- MarketResearch.com: Marketplace that boasts an extensive catalog of market research reports and analyses from a wide variety of sources.
- Attest: Best known for their survey platform capabilities. Can also help you run qualitative research.
- Qualtrics: A survey platform that’s best suited for enterprise companies.
- Remesh: Offers a unique approach to market research, where participants can respond and vote on each other’s answers.
Now that you have a high-level view of what each market research company excels at, we'll examine their capabilities in more detail.
1. Prodege (Pollfish’s Parent Company)
Prodege stands out as a company that combines full-service research capabilities with advanced technology.
Over time, Prodege has built and acquired a suite of market research tech platforms, notably Pollfish — our widely used survey tool ideal for companies conducting DIY research. (More details on Pollfish in the next section.)
Additionally, Prodege manages a vast network of audience panels and communities, boasting over 100 million respondents spanning more than 125 countries.
What Makes Prodege Unique: Survey data quality isn't just a priority for us — it's our foundation. We have a 40-person Panel Support, Security, and Compliance Department dedicated to this work every day.
We recently published The 3 Survey Data Quality Issues Sabotaging Your Research (& How We Fix Them) — an in-depth look at the stringent quality standards and processes we follow.
Our commitment to high data quality underpins every aspect of our offerings.
As it pertains to Prodege's full-service research offering, you can either opt for an end-to-end service (where we manage the entire survey process from start to finish) or pick specific areas where you need support, including:
- Research design
- Survey programming
- Sample & fielding
- Data processing & analysis
- Reporting
We also provide qualitative research services, including interviews, focus groups, and other methodologies.
Here's what Remesh had to say about working with us:
“Working with Prodege has allowed us to provide quality sample and a smooth recruitment process from beginning to end for our large-scale qual sessions. We can always count on the team for fast recruitment programming, excellent screening and quota delivery, low incidence rate audiences, and timely turnaround for all our projects. The customer service of their project management team is unmatched.”
You can also take advantage of our powerful data visualization tools that make it incredibly simple to slice and dice data and create complex charts using multiple variables:
As BuzzFeed have noted:
“Prodege has been a valuable asset in helping to prove BuzzFeed’s effectiveness. The quick turnaround of results within the Data Viz platform has allowed us to better service our advertising partners in delivering valuable campaign insights. The self-serve platform gives us the flexibility to format and export in a way that meets our specific needs. Prodege has even gone the extra mile and customized the PowerPoint slides to use our unique color scheme and layout.”
Interested in learning more about Prodege?
We invite you to:
2. Pollfish
Pollfish (our own product) is a powerful DIY survey platform with robust questionnaire design, audience targeting, and data analysis capabilities that seasoned market researchers appreciate.
Pollfish’s key benefits include:
- Rigorous data quality measures, which we explore in detail in our article on the data quality issues that can negatively impact your research.
As several customers shared on Trustpilot:
"The most important point to make is that I trust the responses of my survey. My target audience was very specific and I could tell that the responses were legitimately coming [from] subjects in my target audience.”
– Read the full review here“Each time I use this service I am blown away by the speed with which the responses come in and with the detail which most of them include. You can tell that the respondents take this very seriously. They must really enjoy doing it.”
– Read the full review here
- Flexible and transparent pay-per-response pricing model, starting at $0.95 per response, with no subscriptions, long-term commitments, or hidden surprise charges.
As several customers shared on Trustpilot:
“They charge based on the completed response. It is very fair and transparent. As a researcher, I have used many survey platforms, but they are the best so far.”
– Read the full review here“The dollar amount they quote you in their cost calculator tool, and the number they show when you're developing the survey, is the number you pay. I was burned multiple times by [competitor] charging me unexpected amounts and making it difficult to quit an expensive subscription. I'm so happy to have found Pollfish as an alternative. Their support team also responds VERY quickly to chat messages and has been tremendously helpful the few times I had questions.”
– Read the full review here“The pricing is clear and transparent from the beginning. The results come quickly and can be downloaded in different formats and with different filters. What we like most is the ability to filter the results and analyze them separately for each segment. We highly recommend this platform.”
– Read the full review here
- Industry leading turnaround time, from a few hours for general population audiences to a few days for more specialized niches. As several customers shared on Trustpilot:
Review for a general population survey:
“I needed a 25 question survey answered, and was able to get 500 completed surveys in 8 hours with Pollfish. The presentation of the results is very impressive and the demographics information Pollfish provided is invaluable.”
– Read the full review hereReview for a specialized niche:
“I'm amazed at how quickly the platform was able to deliver rich, segmentable data from over 500 respondents. I had feature-ready insights in only 3 days.”
– Read the full review here
In addition, Pollfish offers a feature called Conversational AI, which lets you have one-on-one conversations with respondents at scale, and gain unique qualitative insights. This is particularly useful for brand tracking (e.g., sentiment or perception), post-experience feedback, concept or creative testing, and more.
Interested in learning more about Pollfish?
- Create a free account, no credit card required.
- Schedule a demo call.
3. Kantar
Kantar is a global leader in brand measurement and consumer insights. They offer various solutions, including
- Brand tracking & brand equity measurement: This is their flagship offering, and what Kantar is best known for. Through BrandZ, they offer extensive reports on 4.5 million consumers across 22,000 brands, in 538 categories and 54 markets.
- Market research services: They can help with survey design & consultation, global panel management, data visualization & dashboards, data defense & fraud prevention, brand tracking, and much more.
- Consumer panel research through Worldpanel, which tracks purchase and usage behaviour data through the largest consumer panels in the world.
- Media effectiveness & audience measurement: According to their site, Kantar is an indispensable partner to 96 of the world’s 100 biggest advertisers.
- Innovation & product development: They offer solutions for idea screening, concept testing, package design screening & testing, and more.
4. Mintel
Mintel is a global leader in consumer market intelligence, offering various solutions, such as:
- On-demand databases and reports, including:
- Global New Products Database: Learn about 40,000+ new products launched across 86 markets and 46 CPG categories every month.
- Global Consumer Data: Learn about what consumers want across 36 markets generating 85% of the world's GDP.
- Market Dynamics: Connect the dots between market size data, consumer sentiment, and brand innovation.
- Consulting: They can help with primary research, social listening, predictive modeling, trends & foresight, competitive intelligence, mystery shopping, ideation workshops, and more.
- Competitive market intelligence: Delivered through a platform called Comperemedia, which is a company owned by Mintel.
- AI Tools: Includes Mintel Spark (an AI concept generator ideal for early innovation stages) and Mintel Leap (which provides instant answers from their extensive data libraries).
5. Bixa
Bixa is a market research firm specializing in Gen Z insights, though they also provide comprehensive research services across other demographics and markets.
Some of their key solutions include:
- Qualitative research services, including in-depth interviews, focus groups, ethnography and virtual ethnography, content analysis, video diary studies, mobile diary studies, subject matter expert interviews, UX audits and usability testing, and more.
- Quantitative research services, including surveys, experiments, data analytics, statistical modeling, market segmentation, trend analysis, forecasting, customer satisfaction measurement, and more.
- UX & product research services, uncovering the "why" behind user behaviors through user interviews, user testing, concept testing, CRO audits, video-based observational studies, and more.
- Market trend reports: Discover newly emerging trends via reports tailored to various industries, including fashion, technology, healthcare, and more.
6. MRI-Simmons
MRI-Simmons is best known for their in-depth consumer data and national studies, particularly their MRI-Simmons USA study (which merged the best elements of their legacy Survey of the American Consumer® study and Simmons’ National Consumer Study).
Diving deeper into some of their key solutions and offerings:
- MRI-Simmons USA study: MRI-Simmons states this is “the most comprehensive study on American consumers”, with reliable data on consumer attitudes, behaviors, media preferences, and more. It’s released each quarter, and they utilize address-based probabilistic sampling to ensure a nationally-representative sample.
- Catalyst Platform: A self-service tech platform that can help you generate clear, actionable insights based on MRI-Simmons' nationally representative consumer data.
- Local consumer insights, including their Market-by-Market Study, Local Flex Markets Study, and Local Market Report.
- Print measurement insights, including Magazine Media Brand Studies, Issue Specific Readership Study, and more.
- Studies on energetic technologies and cultural trends, including their Sports Fan Study, Podcast Study, Retail Trends Study, National Cannabis Study, LGBT & Gender Identity Study, Content Drivers Study, Trending Topics Study, Health & Wellness Study, Digital Life Study, Cord Evolution Study, Multi-Media Engagement Study, and more.
7. Ipsos
While Ipsos offers a wide variety of solutions, they're best known as a leader in public opinion polling. Diving deeper, some of their core solutions include:
- Public opinion polling & reports: While they regularly publish reports about a vast range of topics, they’re best known for their political polling reports.
- Innovation & Market Research: They can help companies seize market opportunities, test concepts, optimize pricing strategy, and more.
- Surveys: They can help you launch surveys via the Ipsos.Digital Platform, and connect you with pre-recruited respondents.
- Brand strategy: They can help you track your brand's performance against competitors.
- Customer Experience (CX) & Loyalty: They can help you measure customer satisfaction (e.g., Net Promoter Score) across the customer journey.
8. Nielsen
While Nielsen offers a wide variety of solutions, they’re best known for their TV rating & audience measurement capabilities. Diving deeper, some of their core solutions include:
- Audience measurement, including TV & streaming measurement, cross-media measurement, digital measurement, audio measurement, and more.
- Media planning, including audience segmentation, competitive intelligence, scenario planning, and more.
- Marketing optimization, including marketing outcomes and sports & games.
- Content metadata, including audio metadata, sports metadata, video metadata, and contextual video data.
- Datasets and reports across a vast range of industries.
9. Suzy
Suzy offers various solutions, including:
- Suzy Insights: Quantitative surveys, which is their flagship offering.
- Suzy Live: Qualitative insights, including multi-person focus groups, 1-on-1 interviews, and in-home product testing.
- Suzy Audiences: Iterative insights from the audiences that matter most to you.
- Suzy Speaks: AI-powered conversational surveys.
- Suzy Signals: Receive an email after each survey ends, which shows not just your results, but what to do next.
They also offer full-fledged managed services (geared for enterprise companies), which you can learn more about here.
10. SG Analytics
While SG Analytics offers a wide variety of solutions, in this section, we’ll focus specifically on their market research consulting offering.
They can help you with:
- Primary market research: Gain access to 4M+ B2B and B2C panelists across 75+ countries.
- Secondary market research: Their experienced researchers will analyze secondary data from internal and external sources.
- Quantitative market research with a focus on surveys.
- Qualitative market research: Focus groups, 1-on-1 interviews, etc.
They serve a wide variety of industries, including BFSI, Capital Market, TMT, and others.
Some of their market research solutions include market segmentation, product development, UAT studies, concept testing, competitor analysis, ad effectiveness, pricing strategy, customer satisfaction and experience, market entry strategies, brand awareness and positioning, and social and environmental studies.
11. Gartner

Gartner is a market research juggernaut that's best known for their market research literature and analyses across various technology sectors. Diving deeper, some of their key offerings include:
- Magic Quadrant™ Reports: Reports that shed light on 4 types of technology providers in fast growing markets: Leaders, Visionaries, Niche Players and Challengers.
- Hype Cycle™: Graphical representation of the maturity and adoption of emerging technologies, to help you identify how much risk is involved.
- And so much more: These are just some of Gartner’s more well-known offerings but they’re a powerhouse with a wealth of other market research information and use cases.
12. Forrester
Forrester is a market research powerhouse that offers consulting and provides data across multiple industries, with a particular focus on technology vendors.
Some of the key industries they serve include:
1. Technology
- Data
- Artificial Intelligence & Analytics
- Security & Risk
- Technology Architecture & Delivery
2. B2B
- Marketing
- Product
- Sales
3. Consumer
- Customer Experience
- Digital Business
- Marketing
13. IDC
IDC is a consulting firm that specializes in IT and tech research, with over 1,300 analysts worldwide in over 110 countries.
Some of the key industries they serve include:
- Energy
- Financial
- Government
- Health Manufacturing
- Retail
14. Drive Research
Drive Research is a full-service, boutique market research agency.
While you can explore their Services page for more details, here’s an overview of the key services they offer:
- Online surveys
- Customer surveys
- Employee surveys
- Qualitative recruiting
- Focus groups
- PR surveys
- Advanced analytics
Some of the key industries they serve include Consumer Goods, Financial Services, Higher Education, Manufacturing, Healthcare, Retail Travel and Tourism, and more.
15. Statista
Statista is a widely-known, massive data aggregator.
- They break down their insights into three categories:
- Market insights: Market forecast and KPIs for 1000+ markets in 190+ countries and territories.
- Consumer insights: Insights on consumer attitude and behavior based on 2,000,000+ interviews 15,000+ brands.
- eCommerce insights: Insights on 39,000+ online stores and marketplaces, with 70+ KPIs per store and revenue analytics and forecasts.
- Some of their more popular industry statistic categories are: consumer goods & FMCG, e-Commerce, economy & politics, energy & environment, internet, technology & telecommunications, transportation & logistics, and travel, tourism & hospitality.
- Statista also offers full-service market research, including target group analysis, pricing & product research, brand tracking, quick surveys, expert interviews, ad-hoc desk research, trend analysis, market sizes & forecasts, and other types of custom research.
16. IBISWorld
IBISWorld is best known for their wide range of industry research reports across 5,000+ industries. They were founded in 1971 and have 400+ employees in 6 offices globally: New York, Los Angeles, Melbourne, London, Frankfurt.
Some of their more popular industry report sectors include:
- Accommodation & Food Services
- Administration & Business Support Services
- Agriculture, Forestry, Fishing & Hunting
- Arts, Entertainment & Recreation
- Construction
- Educational Services
- Finance & Insurance
- Healthcare and Social Assistance
- Information Sector
- Manufacturing
- Mining
- Personal Services
- Professional, Scientific and Technical Service
- Public Administration & Safety
- Real Estate, Rental & Leasing
- Retail Trade
- Transportation and Warehousing
- Thematic Reports
- Utilities
- Wholesale Trade
17. MarketResearch.com
MarketResearch.com is best known for their extensive range of market research reports across various industries, including:
- Consumer Goods
- Food & Beverage
- Heavy Industry
- Service Industries
- Public Sector
- Life Sciences
- Technology & Media
- Marketing & Market Research
- Reports by Country
- Company Reports
18. Attest
Attest is best known for their survey platform capabilities, and you can browse their solutions by use case, including:
- Brand tracking
- Consumer profiling
- Market analysis
- New product development
- Multi-market research
- Creative testing
- Concept testing
- Campaign tracking
- Competitor analysis
- Quant & qual insights
- Seasonal research
19. Qualtrics
Qualtrics is best known for their survey platform capabilities. They’re well-suited for enterprise companies, and they categorize their features in 3 areas:
1. Customer Experience
- Voice of Customer
- Omnichannel Experience Management
- Digital Experience Analytics
- Website & App Feedback
- Location Experience Hub
- Online Reputation Management
- Contact Center Analytics
- Quality Management & Compliance
- Agent Coaching
- Edge Instant Insights
2. Employee Experience
- Employee Engagement
- Employee Pulse
- Employee Research
- Candidate Experience Management
- Employee Onboarding & Exit
- 360 Development Feedback
- Employee Retention Analytics
- Continuous Employee Listening
3. Strategy & Research
- Strategic Market Research
- Product Research
- Brand and Communication Research
- User Experience Research
- Edge Audiences
In addition to their DIY survey functionality, they also offer done-for-you market research services, which you can explore here.
20. Remesh
Remesh market research platform that has a unique offering:
- Participants can respond and vote on each other’s answers, and you can run online focus groups and surveys at scale, while receiving unique insights you might otherwise miss via traditional methods.
- Unique metrics like Percent Agree Scores give you more confidence in your insights.
- Automated data analysis tools save you time on manually reading verbatim responses, helping you create summaries and identify key themes in seconds.
- Bring your own audience or recruit on-platform: Remesh can supply you with high-quality, vetted participants, with an average sub-3% removal rate.
- Multiple service options: Beyond DIY research, Remesh also provides supported or fully managed services.
Interested in Learning More About Pollfish and Prodege?
We invite you to create a free Pollfish account (no credit card required) and/or book an introductory call.

8 Best Concept Testing Platforms (by Category)
8 Best Concept Testing Platforms (by Category)
When businesses search for concept testing platforms, they're typically looking for one of two main categories of tools:
Category #1: Concept Testing Survey Platforms
Survey-based concept testing platforms excel at delivering large-scale, statistically significant data. These platforms offer rapid results, often within hours to a few days, and let you maintain strict control over potential bias through careful questionnaire design. Top concept testing survey platforms include:
- Pollfish: Best for market researchers seeking high-quality survey data with transparent pay-per-response pricing. No subscription fees, annual commitments, or hidden costs. Well suited for companies of any size.
- Qualtrics: Best suited for large enterprise companies, and their pricing is often cost-prohibitive for small and medium-sized businesses.
- SurveyMonkey: Best for simpler survey requirements. While they offer pay-per-response pricing, essential features like skip logic require a subscription plan, increasing your total costs.
Category #2: Concept Testing Platforms Beyond Traditional Surveys
These platforms offer unique methodologies that can complement your survey data and reveal insights you might otherwise miss:
- MESH01: Specializes in concept testing for physical products where hands-on interaction is crucial. They handle recruiting qualified testers and collect comprehensive feedback through activity logs, surveys, image and video uploads, performance zone heatmaps, and real-time product usage data.
- System1: Offers innovative testing methodologies including a predictive trading game where participants buy or sell "shares" in concepts (providing market-like validation), FaceTrace technology that measures genuine emotional responses to visual concepts, and more.
- Highlight: Excels at in-home product testing across diverse use cases, from food and beverage tastings to packaging design validation. For example, they can ship package designs directly to consumers' homes and collect valuable real-world insights that complement your online survey data.
- Hotjar: Enables concept testing through two key features: concept testing questions while users browse your site (for example, after they've spent more than 45 seconds on a specific product page), and end-to-end remote user interviews, including recruiting participants, scheduling sessions, hosting calls, and generating reports.
- Kantar: While they offer a vast range of use cases, their ConceptEvaluate AI platform stands out for rapid concept screening. It can simultaneously test concepts with up to 100 participants, making it valuable for efficiently filtering through multiple concepts in early development stages.
Up next, we'll provide a comprehensive overview of Pollfish, our survey platform that excels at concept testing, followed by an overview of the other concept testing tools on this list.
Category #1: Concept Testing Survey Platforms
1. Pollfish
Pollfish is our DIY survey platform that excels at running monadic tests, sequential monadic tests, and other concept testing methodologies. Our highly intuitive, easy-to-use interface, offers a robust questionnaire design, audience targeting, and data analysis capabilities that seasoned market researchers rely on.
We offer pre-built survey templates designed with market research best practices for product concept testing, pricing testing, logo testing, ad testing, A/B testing, and more. This provides a strategic head start by allowing you to edit proven, ready-made frameworks rather than building everything completely from scratch.
There are 4 key reasons you should choose Pollfish for concept testing:
- Reason #1: High-quality audience panels with rigorous data quality standards.
- Reason #2: Pay-per-response pricing model with complete transparency and no hidden fees.
- Reason #3: Fast turnaround times — from a few hours for broad audiences to a few days for more niche groups.
- Reason #4: Robust functionality across three key areas: audience targeting, questionnaire design, and data analysis.
Let’s dive in.
Reason #1: High-Quality Audience Panels with Rigorous Data Quality Standards
Why is this important? Data quality should be your top priority when choosing a concept testing survey platform. Even a perfectly designed survey will produce unreliable results if respondents are fraudulent or provide low-quality answers, leading to flawed decisions about which concepts to choose or invest in.
Our Approach: At Pollfish, through our parent company Prodege (the world's largest single panel owner), we maintain our own first-party respondent communities rather than purchasing data from external third-party providers.
This direct ownership approach enables us to maintain rigorous quality controls that ensure high-quality concept testing survey results:
❇️ Diverse activities beyond surveys help us verify respondents are real people, not bots: Through communities like Swagbucks, panelists earn rewards not just from surveys but also from activities like playing games, watching videos, or uploading shopping receipts.
These activities serve as authenticity checks — for example, uploading an actual shopping receipt is something only a real person can do, giving us certainty that our respondents are genuine humans rather than bots.
❇️ Shopping receipt uploads enable more accurate targeting than self-reported preferences: When participants upload shopping receipts (e.g., showing they've recently purchased an energy drink), you can precisely target them based on verified purchase behavior.
This is far more reliable than self-reported preferences, where participants might falsely claim they buy energy drinks just to qualify for more surveys.
❇️ 30-day evaluation period: New members undergo a mandatory 30-day evaluation period where they complete internal profiling surveys. We closely monitor their responses, and only participants who consistently provide high-quality responses are approved to take client surveys.
❇️ Manual-review of open-ended responses: Every open-ended survey response is manually reviewed by a human team member to ensure quality and filter out nonsensical or low-effort answers.
❇️ Sophisticated fraud prevention measures, including unique user IDs (to prevent duplicate entries), speeding detection, straight lining detection (repeatedly choosing the same answer), trap questions, anti VPN measures, etc.
The bottom line: By choosing Pollfish for your concept testing survey needs, you can trust that your data is reliable and the decisions you make based on that data are well-founded.
Reason #2: Pay-per-Response Pricing Model with Complete Transparency and No Hidden Fees
❇️ We use a straightforward pay-per-response pricing model, starting at $0.95 per response, with no subscription fees or annual contracts required.
Pollfish scales with your concept testing needs (or other survey needs), so you only pay for the responses you actually collect — never for unused capacity.
❇️ As you build your survey, pricing is always visible in the upper-right corner and updates in real-time as you add targeting filters.
What you see is exactly what you'll pay, with no surprise fees or hidden charges:
❇️ Here's how our transparent pricing calculator works based on the example above:
- Base cost: $0.95 per response
- Three targeting filters are added:
- Marital status → Married (+$0.55 per response)
- Children in household → 2 (+$0.55 per response)
- Pets in household → Dog (+$0.55 per response)
- Total cost per response: $2.60 with these additional filters
- For 500 responses: $1,300 total cost clearly displayed upfront
That's your final cost — no subscription fees, no hidden charges, no surprises.
As one of our customers shared on Trustpilot:
“The dollar amount they quote you in their cost calculator tool, and the number they show when you're developing the survey, is the number you pay. I was burned multiple times by SurveyMonkey charging me unexpected amounts and making it difficult to quit an expensive subscription. I'm so happy to have found Pollfish as an alternative. Their support team also responds VERY quickly to chat messages and has been tremendously helpful the few times I had questions.”
– Read the full review here
Reason #3: Fast Turnaround Times (From a Few Hours for Broad Audiences to a Few Days for More Niche Groups)
Since Pollfish uses first-party audience data from Prodege rather than purchasing from external third-party sources through middlemen, we can deliver exceptionally fast turnaround times.
❇️ For concept testing surveys targeting broad, general population segments, you can receive results in as little as a few hours for several hundred responses.
As multiple reviewers have noted on Trustpilot:
“The thing that amazes me most is how quickly you can get your data results back. So fast! Usually in a couple of hours.”
– Read the full review here“I needed a 25 question survey answered, and was able to get 500 completed surveys in 8 hours with Pollfish. The presentation of the results is very impressive and the demographics information Pollfish provided is invaluable.”
– Read the full review here“I honestly thought the results would take days, and I was starting to get worried because I was using Pollfish for a quarterly goal and I was trying to make it before the deadline. However, I received the results in literally just a few hours!”
– Read the full review here“Much more affordable than all the alternatives I found, and I had all my results ready within just a couple of hours.”
– Read the full review here
❇️ For more specific targeting requirements, completion typically takes several days (e.g., household income over $250,000, live in New York, and own a dog).
This is still exceptionally fast compared to other platforms for similar audiences. As several reviewers have noted:
“I'm amazed at how quickly the platform was able to deliver rich, segmentable data from over 500 respondents. I had feature-ready insights in only 3 days.”
– Read the full review here“I've used Pollfish before so when I needed to test concepts for a new business pitch in 5 countries over the holiday, I turned to Pollfish. The surveys were easy to set up, allowed me to select my very specific target and launched right away. Within a couple of days I had my results in an easy to interpret, actionable format well within my budget.”
– Read the full review here“I found the platform super-easy to use and we received feedback on our new name and logo from our target audience within a few days.”
– Read the full review here
For specific turnaround time estimates based on your unique audience requirements, please contact us here, or submit your question via live chat. We’re available to help 24/7.
Reason #4: Robust Functionality Across 3 Key Areas (Audience Targeting, Questionnaire Design & Data Analysis)
Robust functionality across audience targeting, questionnaire design, and data analysis is critical:
- If you can't precisely target your ideal audience, you'll test concepts with the wrong people, and act on flawed insights.
- If your questionnaire design capabilities are limited, you won't be able to create sophisticated concept testing surveys with proper A/B testing structures, branching logic, and the diverse question types necessary to capture high quality data.
- If your data analysis tools are lacking, you won't be able to identify the nuanced patterns and demographic differences that reveal which concepts truly resonate with your target market.
Up next, we’ll discuss Pollfish’s key features and capabilities across these three areas.
❇️ Audience Targeting
With Pollfish, you can choose from 50+ targeting filters across 6 categories: Demographics, Geographic Criteria, Consumer Lifestyle, Employment & Occupation, Behavioral Data, and Media.
While most customers use only a subset of the below options, here's the complete range of targeting filters available to ensure you reach exactly the right audience for your concept testing surveys:
❇️ Demographics
Age, Gender, Hispanic Origin, Marital Status, Languages Spoken, Education Level, US Voter Registration, Household Income (US), Age & Gender of Child(ren) in Household, Type of Home, Pets in Household, Political Party Support, Hispanic Level of Acculturation, Parental Status / Pregnancy Status, Race, Device Type, Device Operating System (OS), Ethnicity, Number of Children in Household
❇️ Geographic Criteria
US State, US Division, US DMA, US Region, US Statistical Area (CBSA), US County, US Zip Code
❇️ Consumer Lifestyle
Beverage Consumption, Hobbies & Interests, Sports Participation, Gambling Participation, Music Streaming Services Use, Movie Theater Frequency, Home Movie Viewing Frequency, Video Game Participation, Video Game Consoles, Video Game Genres, Travel by Air for Business/Leisure, Vehicle Make/Brand Own or Lease, Vehicle Type Own or Lease, Health Ailment Diagnosis
❇️ Employment & Occupation
Employment Status, Industry Work In, B2B Department, Number of Employees, Job Title
❇️ Behavioral Data
Brands Purchased (In-Store), Online Shopping: Retailer, In-Store Shopper, Category Buyers, Retail Channels Shopped (In-Store), Websites Visited, Retail Channels Shopped (Online)
❇️ Media
Video Streaming Services Used
❇️ Custom Quotas
You can set custom quotas with ease to prevent bias in your survey results, whether across age groups, gender, income levels, or any other criteria you choose.
❇️ Questionnaire Design
No matter how robust or sophisticated your concept testing questionnaire needs to be, Pollfish provides the tools you need:
❇️ 16 question types, including Single selection, Multiple selection, Open ended, Numeric open ended, Description, Rating stars, Slider, Ranking, Matrix single selection, Matrix multiple selection, Net Promoter Score (NPS), A/B test, Conjoint analysis, Max Diff, and Van Westendorp.
❇️ AI survey creation: Quickly create concept testing surveys by simply describing your research goals.
For example, you can prompt the AI with "I want to test 3 packaging designs for a new food product" and it will automatically generate appropriate questions, logic flows, answer options, and more.
❇️ Multimedia questions: Insert video or image-based concept visuals (e.g., product mockups, packaging designs, logos, ad ideas, etc.) directly into your survey questions, with the option to require full video viewing before respondents can proceed.
❇️ Answer shuffling: Automatically randomize answer choices to eliminate bias.
For example, when testing three logo concepts, Pollfish ensures each logo appears in different randomized positions (preventing the first option from being unfairly selected more often due to primacy bias).
❇️ Screening questions: Add screening questions to automatically filter out participants based on their responses.
For example, when testing a new energy drink concept, you can ask "How many energy drinks do you consume per week?" and automatically filter out anyone who responds with less than 2, allowing only qualified prospects who consume 2+ energy drinks weekly to proceed with your survey.
❇️ Conditional branching: Create dynamic survey paths based on previous responses, allowing you to show different concepts or follow-up questions depending on participant answers.
For example, if someone identifies as a "frequent online shopper," they see e-commerce app concepts, while "in-store shoppers" are shown retail experience concepts instead.
❇️ Explore the full range of Pollfish’s survey design capabilities.
❇️ Data Analysis
Pollfish makes it easy to collect and filter the data to get the insights you need, eliminating the need for external tools like Excel. We offer:
❇️ Demographic filtering: Analyze how different concepts perform across specific audience segments.
For example, see how millennials vs. baby boomers respond to your packaging designs, or compare male vs. female reactions to your ad concepts.
❇️ Response-based filtering: Drill down into specific feedback patterns by filtering responses.
For example, focus only on participants who rated a concept as "very appealing" to understand what drove their positive reaction.
❇️ Advanced insights builder: Create complex multi-variable analyses and charts without Excel.
For example, if you ran a concept test and wanted to analyze feedback from "males who live in the Northeast and Midwest, who are married, and who rated concepts as extremely believable," you can simply drag and drop these variables and generate instant charts with just a few clicks.
❇️ Statistical significance testing: Automatically identify which concept performance differences are statistically significant.
❇️ Charts in your brand colors: Customize each chart with your company's brand colors automatically, eliminating the time you'd otherwise spend manually formatting charts in external design tools.
❇️ Built-in PowerPoint creation: Create complete PowerPoint slide decks directly within Pollfish while analyzing your data to streamline your workflow.
❇️ Flexible export options: Export your survey results and charts in multiple formats, including PDF, Excel, crosstabs, SPSS, and more.
Sign Up for a Free Pollfish Account
Create your free Pollfish account today — no credit card required, no commitments — and start building your first concept testing survey in minutes with our easy-to-use, intuitive interface.
2. Qualtrics
Qualtrics is best suited for large enterprise companies, and their pricing is often cost-prohibitive for small and medium-sized businesses.
Our article on Qualtrics alternatives elaborates on how Pollfish stands apart, including higher quality survey data, flexible pay-per-response pricing structure (rather than being locked into a long-term commitment), stellar customer service, and more.
Qualtrics’ features can be divided into 3 categories:
1. Customer Experience
- Voice of Customer
- Omnichannel Experience Management
- Digital Experience Analytics
- Website & App Feedback
- Location Experience Hub
- Online Reputation Management
- Contact Center Analytics
- Quality Management & Compliance
- Agent Coaching
- Edge Instant Insights
2. Employee Experience
- Employee Engagement
- Employee Pulse
- Employee Research
- Candidate Experience Management
- Employee Onboarding & Exit
- 360 Development Feedback
- Employee Retention Analytics
- Continuous Employee Listening
3. Strategy & Research
- Strategic Market Research
- Product Research
- Brand and Communication Research
- User Experience Research
- Edge Audiences
3. SurveyMonkey
As mentioned, SurveyMonkey suits simpler survey needs. Our article on SurveyMonkey alternatives elaborates on how Pollfish stands apart, offering advantages like more affordable pay-per-response pricing for all question types, superior survey data quality, and the inclusion of most premium features without requiring a subscription upgrade.
Some of SurveyMonkey’s key features and capabilities include:
- Customizable survey design features, although crucial ones like skip logic are only available with a subscription.
- Ability to target SurveyMonkey’s vetted, pre-recruited respondents.
- Built-in analysis capabilities, including tools like Word Cloud, which automatically identify common themes and phrases from open ended questions.
- Diverse concept testing methodologies, including logo design testing, name testing, package testing, or message & claims testing.
Category #2: Concept Testing Platforms Beyond Traditional Surveys
4. MESH01
MESH01 specializes in concept testing for physical products where hands-on interaction is crucial. They handle recruiting qualified testers (70,000+ person testing community) and collect comprehensive feedback through:
- Activity logs
- Surveys
- Image and video uploads
- Performance zone heatmaps
- Real-time product usage data
They offer unique industry insights and reports, such as The State of Product Testing and Product Testing Program Trends.
5. System1
System1 offers innovative concept testing methodologies, and some of their key solutions and capabilities include:
- Predictive trading game where participants buy or sell "shares" in concepts (providing market-like validation).
- 1–5 Star Rating system with validated predictive power — 5-Star concepts typically achieve triple the sales of 1-Star concepts.
- FaceTrace technology that measures genuine emotional responses to visual concepts and new products.
- Database of 54,000+ concepts to benchmark your performance against.
- Comprehensive ad testing tools.
Overall, it’s a great platform to help optimize product development and concept testing.
6. Highlight
Some of Highlight's key solutions and capabilities include:
- At in-home product testing across diverse use cases, from food and beverage tastings to packaging design validation, and many other product ideas.
- Quick-touch pulse surveys, with access to a large community of product testers and live data dashboards, as well as the ability to choose a specific target audience, design your questionnaire, field results, and gain actionable insights in a matter of hours.
- MaxDiff testing, TURF testing, and other methodologies.
The key industries Highlight serves include Food, Beverage & Supplements, Personal Care & Beauty, Alcohol (RTD, Beer, Liquor, Mocktail), Kids Products, Pet Care & Accessories, Household Cleaning & Goods, and Apparel Footwear.
7. Hotjar
As it pertains to concept testing, some of Hotjar’s key offerings and capabilities include:
- Hotjar Surveys: Trigger concept testing surveys while users browse your site (e.g., after users spend 30 seconds on the pricing page). You have multiple survey deployment options, including pop-ups, buttons, bubbles, embedded widgets, full-screen overlays, and more. Hotjar also offers pre-built templates and AI survey creation to speed up the process.
- Hotjar Engage: Handles end-to-end remote user interviews, including recruiting participants, scheduling sessions, hosting calls, generating reports, and more. They offer a diverse pool of 200,000+ participants from 130+ countries and 25 industries, though you can also interview your own customers.
8. Kantar
While Kantar offers a vast range of uses, their ConceptEvaluate AI platform stands out for rapid concept screening:
- You can simultaneously test concepts with up to 100 participants, making it valuable for efficiently filtering through multiple concepts in the early development process.
- Their survey-based AI model has been trained on over 39,000 concepts, so you have more confidence you’re making informed decisions.
- You can receive feedback and results in as little as 24 hours.
- Some of the key metrics they track include Predictive Trial, Predictive Uniqueness, and Predictive Relevance, which help increase your decision-making confidence.
- You can choose from two options, both of which increase in cost as you test more concepts:
- Self-Serve: Pricing starts at $360.
- Serviced by Kantar: Pricing starts at $5,500.
Overall, Kantar is a great platform to streamline concept development, and offers various unique research methods.
Sign Up for a Free Pollfish Account
Create your free Pollfish account today (no credit card required, no commitments) and start building your first concept testing survey in minutes with our easy-to-use, intuitive interface.

3 Survey Data Quality Issues Sabotaging Your Research (& How We Fix Them)
3 Survey Data Quality Issues Sabotaging Your Research (& How We Fix Them)
When conducting market research, data quality is the most critical factor. While that might sound obvious, it’s often not given enough consideration.
Even with a meticulously designed survey — solid logic, good flow, and bias controls — if respondents are fraudulent (e.g., bots) or rushing to finish, the data is flawed. This can lead to costly mistakes and damage credibility with leadership.
In this article, we’ll cover:
- 3 critical survey quality issues
- Issue #1: Bots posing as real respondents or survey farms (fraud caused by a network of real humans), contaminating data with fraudulent responses
- Issue #2: Respondent profiles and demographic information may become inaccurate over time, even if initially true
- Issue #3: Respondents providing low-quality, rushed, or contradictory answers
- How Pollfish, through our parent company Prodege — the world’s largest single panel owner — combats these issues via first-party panel ownership and the robust, multi-layered data quality safeguards we have in place.
Issue #1: Bots posing as real respondents or survey farms, contaminating data with fraudulent responses
The Problem
Survey fraud can be divided into 2 broad categories:
- Bots – Sophisticated automated scripts, or "bots," masquerade as genuine respondents. These bots may originate from click farms or individuals in various countries attempting to conceal their true location and pose as legitimate participants from target markets like the US.
- Survey Farms – Fraud caused by networks of real humans who register for multiple panelist accounts and attempt to complete as many surveys as possible while avoiding detection. Members of these networks pay a portion of any survey earnings to the owners of the websites where they go to learn the latest tricks to distinguish their location (e.g., using a legitimate IP address to mask their own) and how to create multiple accounts and qualify for surveys.
Our Solution
Prodege has an in-house, 40-person Panel Support, Security and Compliance Department which continually innovates and stays one step ahead of survey fraud. Some of the quality controls and processes we implement include:
❇️ Verifying Respondent Identities Through Diverse Activities Beyond Surveys
Many panels simply have people log in, answer surveys, and get paid without tracking any other behaviors. In contrast, through Prodege's flagship communities like Swagbucks, members can earn rewards not only from completing surveys but also by playing games, shopping online, uploading supermarket receipts, and more.
These additional activities provide valuable data points to verify respondent identities and build out fuller profiles. For example, if someone uploads a unique shopping receipt image, it confirms they are a real human as a bot couldn't replicate this behavior.
❇️ 14-Day Evaluation Period
Before a new panelist becomes eligible to participate in their 1st client survey, they must complete a number of internal quality measurement surveys over their first 14 days on the panel.
Panel members failing to meet our quality thresholds are removed from the panel. After the initial evaluation period, we continue to administer these surveys at random points in a member's panel lifespan.
❇️ Trust Scores
We’ve developed a proprietary solution leveraging AI plus machine learning, where each member is assigned a “Trust Score” shortly after registering for one of our panels. This score is updated based on ongoing inputs.
Based on the Trust Score, we may deactivate a member’s account, block entry to surveys and/or require additional identity verification (e.g., scan driver’s license).
❇️ Fraud Detection Technologies
This includes multi-level registration verification (e.g., CAPTCHA, Device ID Reputation, 100% Double Opt-In, etc.), tech consistency (carrier/targeting alignment check), single user IDs (no duplicate survey takers), sophisticated anti-VPN measures, etc.
Issue #2: Respondent profiles & demographic information may become inaccurate over time, even if initially true
The Problem
While some survey participants might intentionally misrepresent their demographics from the start, a more common issue is that respondent profiles naturally become outdated as individuals' circumstances and interests change over time.
This gradual drift can lead to inaccuracies in the data, even when participants provide honest answers during the initial profile setup.
Consider this scenario: A participant who initially reported being single may get married and have children but fail to update their marital status and parental information in their profile. Consequently, they may be incorrectly included in or excluded from surveys based on these factors.
The challenge for survey platforms lies in ensuring that participant profiles remain accurate and up-to-date, not just at the point of creation but also throughout the respondent's lifecycle. Failing to do so can lead to skewed survey results, misallocated targeting efforts, and ultimately, flawed insights that misinform critical business decisions.
Our Solution
❇️ We go beyond relying on self-reported information by leveraging behavioral data. By analyzing purchase receipts and websites visited, we can identify potential mismatches between a participant's claimed profile and their actual behavior.
For instance, a participant may initially report being single and not having any children. However, if we observe a sudden and consistent increase in purchases related to baby products such as diapers, formula, or child safety equipment (through purchase receipt data), our system may flag this profile for potential updates to parental information.
Our ability to leverage behavioral data for demographic validation is made possible by Prodege's unique position as a company that owns and maintains its consumer communities directly. This stands in stark contrast to most survey platforms, who rely on third-party audience panels (a critical distinction we'll explore further in a later section).
Issue #3: Respondents providing rushed, low quality, or contradictory answers
The Problem
Even when a respondent is verified as a real person, the quality of their survey responses may still be lacking. This can manifest in several ways:
- Speeding and straight-lining: If a survey is designed to take 5 minutes on average, but a respondent completes it in 30 seconds, it raises serious doubts about their level of attention and engagement. Also, some respondents may simply select the same answer choice repeatedly (e.g., always choosing "B" on multiple-choice questions) without actually reading the questions.
- Low-quality open-ended responses: When presented with open-ended questions that require written input, some respondents may provide brief, irrelevant, or nonsensical answers rather than investing the time and effort to share meaningful insights.
- Contradictory answers: Respondents who are not fully engaged or attentive may provide inconsistent or contradictory responses throughout the survey. For instance, they might indicate they've never used a particular product, but later claim to have purchased it within the past month.
- Disengaged respondents: These are real humans with good intentions who on occasion may be multitasking (e.g., watching a movie or cooking while taking a survey), and thus submit lower quality responses.
Our Solution
❇️ Speeding detection: Our system monitors the time respondents spend on each question and flags those who complete the survey significantly faster than the average, indicating a lack of thoughtful engagement.
❇️ Straight-lining detection: We identify respondents who repeatedly select the same answer choice for multiple questions in a row.
❇️ Manual review of open ended responses: We strongly recommend including at least one open-ended question in every survey as an additional quality check. Our dedicated Project Management Team meticulously reviews these responses and removes and replaces any respondents who provide low-quality answers, such as:
- Random characters or irrelevant text.
- Overly brief answers where a detailed response is warranted.
- Answers that do not make sense given the context of the question.
- Any other indicators of poor engagement or lack of effort.
❇️ Red herring questions: We strategically insert our own "red herring" questions throughout the survey, designed specifically to check for contradictory answers and ensure respondents are paying attention.
❇️ And so much more.
Unique Advantage of Prodege: Staff of Research Experts Who Were End-Users of Data in Their Previous Roles
An additional unique advantage of Prodege versus traditional sample suppliers and audience monetizers is that we have a staff of research experts who were end-users of data in their roles at companies such as Hall & Partners, Ipsos, Kantar, Lieberman Research, Nielsen and NPD.
The team's experience preparing reports and dashboards to deliver insights to enterprise clients is layered into Prodege's research best practices, bringing a perspective to data quality missing at other sample firms.
The Bottom Line: Pollfish Delivers Reliable Data
Pollfish's unique approach, which leverages first-party data from Prodege, enables us to implement robust quality control measures and recruit a representative and engaged member base.
As a result, when you use Pollfish, you can trust that you're receiving the highest caliber of survey responses. As several of reviewers have noted on Trustpilot:
"The most important point to make is that I trust the responses of my survey. My target audience was very specific and I could tell that the responses were legitimately coming [from] subjects in my target audience.”
– Read the full review here
“Each time I use this service I am blown away by the speed with which the responses come in and with the detail which most of them include. You can tell that the respondents take this very seriously. They must really enjoy doing it.”
– Read the full review here
“I had to get some data on a product in a tricky sector. It was proving challenging to attract participants to my study. I was able to quickly get results and some insights to be able to move forward with my work using Pollfish.”
– Read the full review here
“I was very satisfied with the results I got from Pollfish. My company was conducting market research and received very insightful help from consumers who were all verified homeowners.”
– Read the full review here
Note: Click here to explore additional Pollfish reviews on Trustpilot.
Interested in Learning More About Pollfish?
Beyond exceptional data quality, Pollfish offers several other key benefits:
- Pay-per-response pricing model, starting at $0.95 per response – no subscriptions, no long term commitments, just pay for what you actually use.
- Transparent pricing: As you build your survey, you'll see the total price update in real-time (it's clearly visible in the upper-right-hand corner, and we don't hide it). What you see is exactly what you'll pay, and there are no surprise charges.
- Quick turnaround time, with general population surveys completed in just a few hours and more specialized audience surveys within a matter of days.
- Comprehensive suite of features, including sophisticated questionnaire design, audience targeting, and data analysis capabilities, to support even the most complex survey research needs.
For more details on the advantages of Pollfish and guidance on choosing the best DIY market research survey tool for your needs, refer to this article.
In addition, for details regarding Prodege’s done-for-you market research service offering, reach out here.
Create a Free Pollfish Account Account or Book a Demo
We invite you to:
- Create a free Pollfish account, no credit card required.
- Book a demo call, where we’ll provide a personalized walkthrough of our platform and answer any questions you may have.

No Shoes, No Problem: TSA Just Made Travel Less Annoying
No Shoes, No Problem: TSA Just Made Travel Less Annoying

You know that awkward shuffle in the TSA line? One shoe off, one hand juggling your laptop, and the ever-present fear of someone judging your sock choice? Well, good news: that part of the airport ritual might finally be over.
In a quiet but glorious move, TSA has rolled out a policy allowing most travelers to keep their shoes on during security screening. After 20 years of toe exposure, public lacing, and general travel indignity, it’s a welcome change.
Naturally, we were curious—how do travelers really feel about this? So we ran a quick nationwide survey using Pollfish to find out. And yes, American travelers have thoughts.
“Wait—this is real?”
First, the awareness check. While, sixty percent of people were already in the know. The shock factor was real - with 84% surprised with the news.
One respondent said, “I thought I misheard it on the news—like, surely I’m not going to be able to walk through with my shoes on?”
You are. And if you're still skeptical, we get it. After two decades of taking off our footwear like we’re entering a traditional tatami room, it feels... weird. But in the best way.
The People Have Spoken: Feet First, Worries Later
Once people got over the initial shock, the mood shifted quickly to celebration. According to the Pollfish survey:
- Over half of travelers (57%) said they feel positive about the change.
- Just 13% had anything remotely negative to say.
- And the rest? Probably still recovering from past foot-related trauma.
There’s something universally comforting about not having to expose your socks to public scrutiny before 8 a.m.
The Real Perks? They’re Not Just About Comfort
Sure, convenience matters (and 51% of people said it’s their top reason for loving the change), but the benefits run deeper—literally:
- 70% said faster lines were the biggest win.
- 40% cited hygiene (yes, because airport carpet is not your friend).
- And 37% said it actually reduced stress, which is saying something, because air travel has a black belt in raising cortisol.
It's not just about comfort—it's about efficiency, dignity, and reclaiming one small corner of your autonomy in the chaos of modern travel.
So… Does This Make Security Less Safe?
A fair question—and one many travelers still asked.
Interestingly, only 9% said they feel less confident in airport security because of the change. The majority—62%—feel just the same, and nearly 30% said they feel more confident, likely thanks to updated technology behind the scenes (think better scanners, not looser rules).
The vibe: “If you trust your tech, we’ll trust your process.” Mostly.
But What About TSA PreCheck?
Ah yes, the elephant in the express lane.
For years, TSA PreCheck has been the promised land for frequent flyers—shorter lines, fewer hassles, and yes, shoes stayed on. But now that everyone gets to skip the footwear removal?
- 15% say PreCheck feels less valuable
- 36% say it’s “somewhat” less enticing
- Still, 76% would enroll or renew anyway
Why? Because PreCheck isn’t just about shoes—it’s about not removing belts, laptops, or dignity, and generally getting to feel like a VIP in Zone 3.
Final Boarding Call: This Change Matters
It’s easy to roll your eyes at something like “no more shoe removal” being treated as a major win. But it is.
Because this tiny change represents something bigger. A system that’s learning, adapting, and—dare we say—humanizing travel just a bit.
So next time you’re at security and realize you can walk straight through in your boots, loafers, or Crocs (we’re not judging), give a little nod of appreciation. To progress. To convenience. To TSA’s long-overdue footwear liberation.
And maybe—just maybe—pack better socks. Just in case.
Bonus: We Got These Insights in Under 30 Minutes
Like the new security lines, collecting this data was quick and painless. Using the Pollfish platform, we surveyed 100 U.S. travelers in less than 30 minutes—no lines, no waiting, and no unlacing required.
So if you’re wondering what your audience thinks, just ask them. Quickly, easily, and in real time.
Qualtrics vs. SurveyMonkey vs. Pollfish: Comparing 4 Key Areas
Qualtrics vs. SurveyMonkey vs. Pollfish: Comparing 4 Key Areas

In this post, we’ll compare Qualtrics vs. SurveyMonkey vs. Pollfish across 4 key areas: data quality, pricing, features, and customer support.
We'll start with a quick summary of key differences, then dive deeper into each category.
Key Differences at a Glance (High-Level Summary)
Data Quality
- Pollfish: We exclusively use 1st-party data from audience panels we directly own and manage ourselves through parent company Prodege, the largest single panel owner in the world, and renowned industry-wide as the gold standard for quality.
- Qualtrics & SurveyMonkey: They often rely on 3rd-party audience panels, which are more prone to inconsistent data quality.
Pricing
- Pollfish: Transparent, pay-per-response pricing with no monthly fees and unlimited team members. For 1–5 questions, pricing is comparable to SurveyMonkey. But as your question count grows, Pollfish becomes far more cost-effective — once you exceed 10 questions, SurveyMonkey can be nearly twice as expensive.
- SurveyMonkey: Pay-per-response model, but requires additional monthly subscription fees for advanced features. As the question count increases, SurveyMonkey's pricing becomes progressively more expensive than Pollfish.
- Qualtrics: Significantly more costly than Pollfish and SurveyMonkey, as it’s geared towards enterprise companies. Typically operates on a subscription basis. Additional team licenses can become costly.
Note: Pricing is always subject to change. For the most up-to-date pricing details, please refer to the respective websites of Pollfish, SurveyMonkey, and Qualtrics.
Features
- Pollfish: Advanced functionality with a user-friendly interface. We particularly excel at advanced survey programming, complex skip logic and branching, and data analysis.
- SurveyMonkey: Good for basic to intermediate needs. More limited survey programming and data analysis capabilities.
- Qualtrics: Powerful tool with enterprise-grade features and capabilities.
Customer Support
Pollfish is renowned for providing exceptional customer support, as frequently praised by customers who switch to our platform. Our support goes beyond mere technical assistance. We have a team of seasoned market researchers ready to offer expert guidance on survey programming, audience targeting, interpreting results, and more. We're also available 24/7 via live chat and phone.
Now that we’ve briefly covered the key differences at a glance, let’s dive deeper into each category.
Diving in Deeper: Data Quality Differences
SurveyMonkey and Qualtrics often purchase responses from third-party audience panels. While some of these external providers are reputable, others are more susceptible to "professional survey takers" who hastily complete surveys without carefully considering each question.
At Pollfish, we exclusively use first-party data from audience panels we own and manage directly. This gives us complete control over data quality measures, resulting in higher quality responses.
For instance, through Swagbucks, one of our core communities, we implement quality control measures such as:
- 30-day evaluation period: New signups cannot immediately start completing client surveys. They must first undergo a 30-day evaluation period where they fill out internal test surveys. We meticulously monitor the quality of their responses during this time. They can only participate in client surveys when we are fully confident that they provide thoughtful and high-quality responses.
- Trust quality scores: We assign and track a trust score for each panelist based on the quality of their survey responses. The more consistently they provide high-quality answers, the more opportunities they unlock to earn additional rewards, creating a strong incentive loop.
- Voluntary survey participation: When panelists join, they can engage in various activities to earn rewards, such as playing games, watching movies, uploading shopping receipts, and more. Surveys are simply another optional activity, and we don't actively solicit participants via text or email to take surveys (unlike some third-party providers). Instead, panelists can choose to navigate to the survey section of their dashboard when they feel ready and willing, leading to higher-quality responses.
- Anti-fraud measures: We manually review open text responses, employ unique user IDs to prevent the same person from taking a survey multiple times, implement speeding prevention, anti-VPN measures, straight-lining detection (selecting the same answer repeatedly), and much more.
This is just a small sampling of our quality control measures.
With Pollfish's rigorous data quality standards, you can trust your survey results and the business decisions that follow.
In addition to our thorough audience vetting process, we deliver exceptionally fast turnaround times. For broad, mainstream audiences (e.g., such as general streaming preferences), you can receive 500 responses within hours.
For more niche audiences (e.g., doctors with certain specialties), turnaround naturally takes longer — typically several days — but remains significantly faster than most other survey software.
Diving in Deeper: Pricing Differences
Note: Before we dive into pricing, note that it’s always subject to change. For the most up-to-date pricing details, please refer to the respective websites of Pollfish, SurveyMonkey, and Qualtrics.
Qualtrics, being primarily geared towards enterprise companies, can be significantly more expensive than Pollfish and SurveyMonkey. They operate mainly via long-term contracts that can be cost-prohibitive for many organizations.
SurveyMonkey employs a pay-per-response pricing model, but access to certain survey programming and data analysis capabilities requires an additional monthly subscription. For individual plans, they offer options ranging from $39/month to $139/month. Team plans range from $30/user/month to $92/user/month, with enterprise pricing also available.
At Pollfish, we use a straightforward pay-per-response pricing model starting at $0.95 per response. This is the only cost you incur — there are no hidden fees or subscription charges.
As you create your survey, the pricing is transparently displayed upfront:
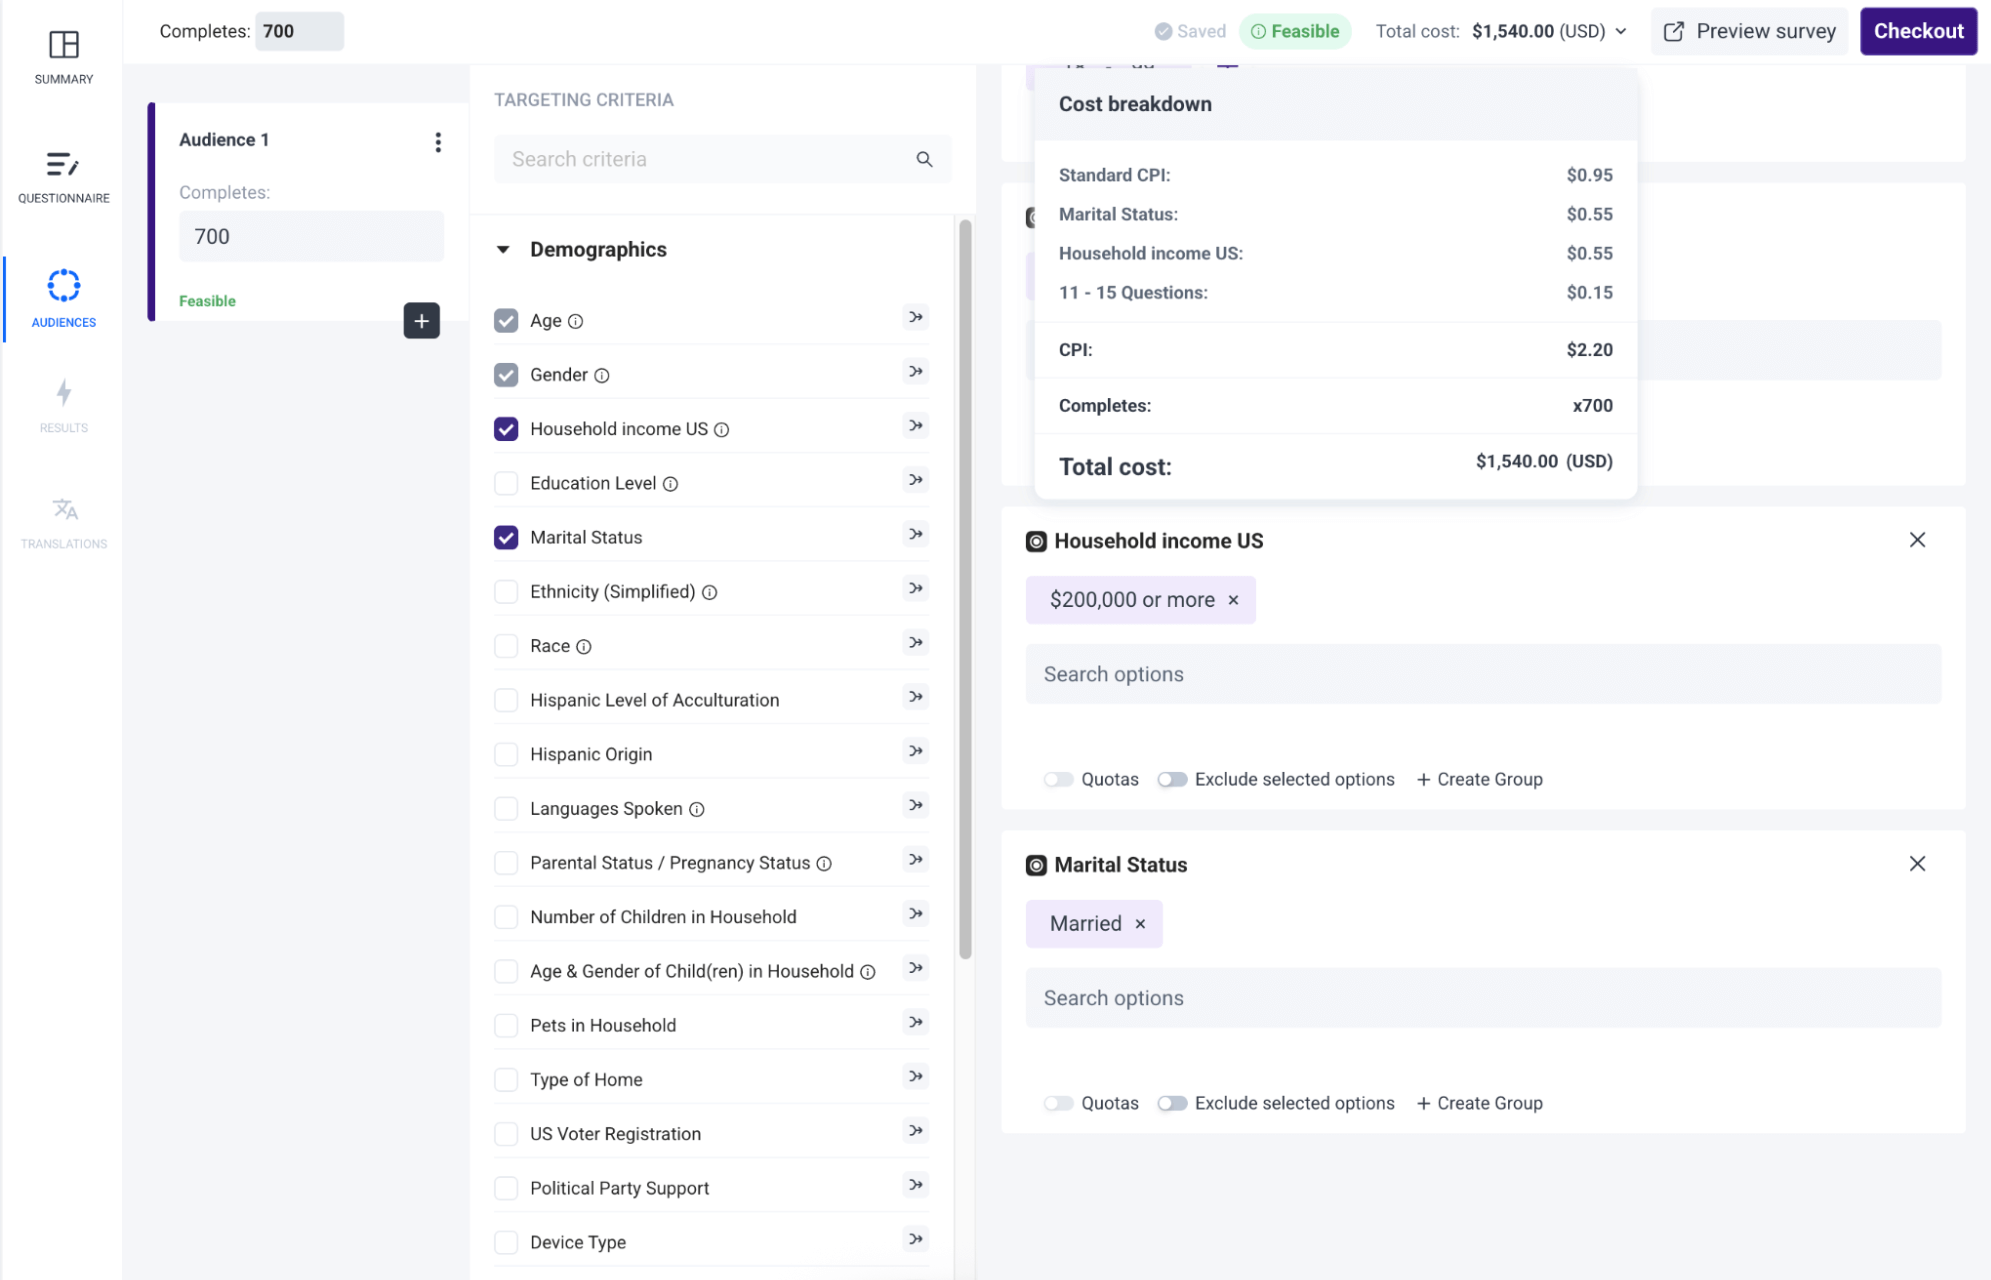
Here's how our pricing transparency works in practice:
- Base cost: $0.95 per response
- Add "Married" filter: +$0.55 per response
- Add "Household Income $200K+" filter: +$0.55 per response
- Add “11-15 questions”: +$0.15 per response
- Final cost per response: $2.20
- Total for 700 responses: $1,540
In this example, the total price displayed upfront is $1,540, and that’s exactly what you’ll pay. Nothing more, nothing less. There are no hidden surprises.
In comparison, the same example above is quoted at $2,100 on SurveyMonkey:
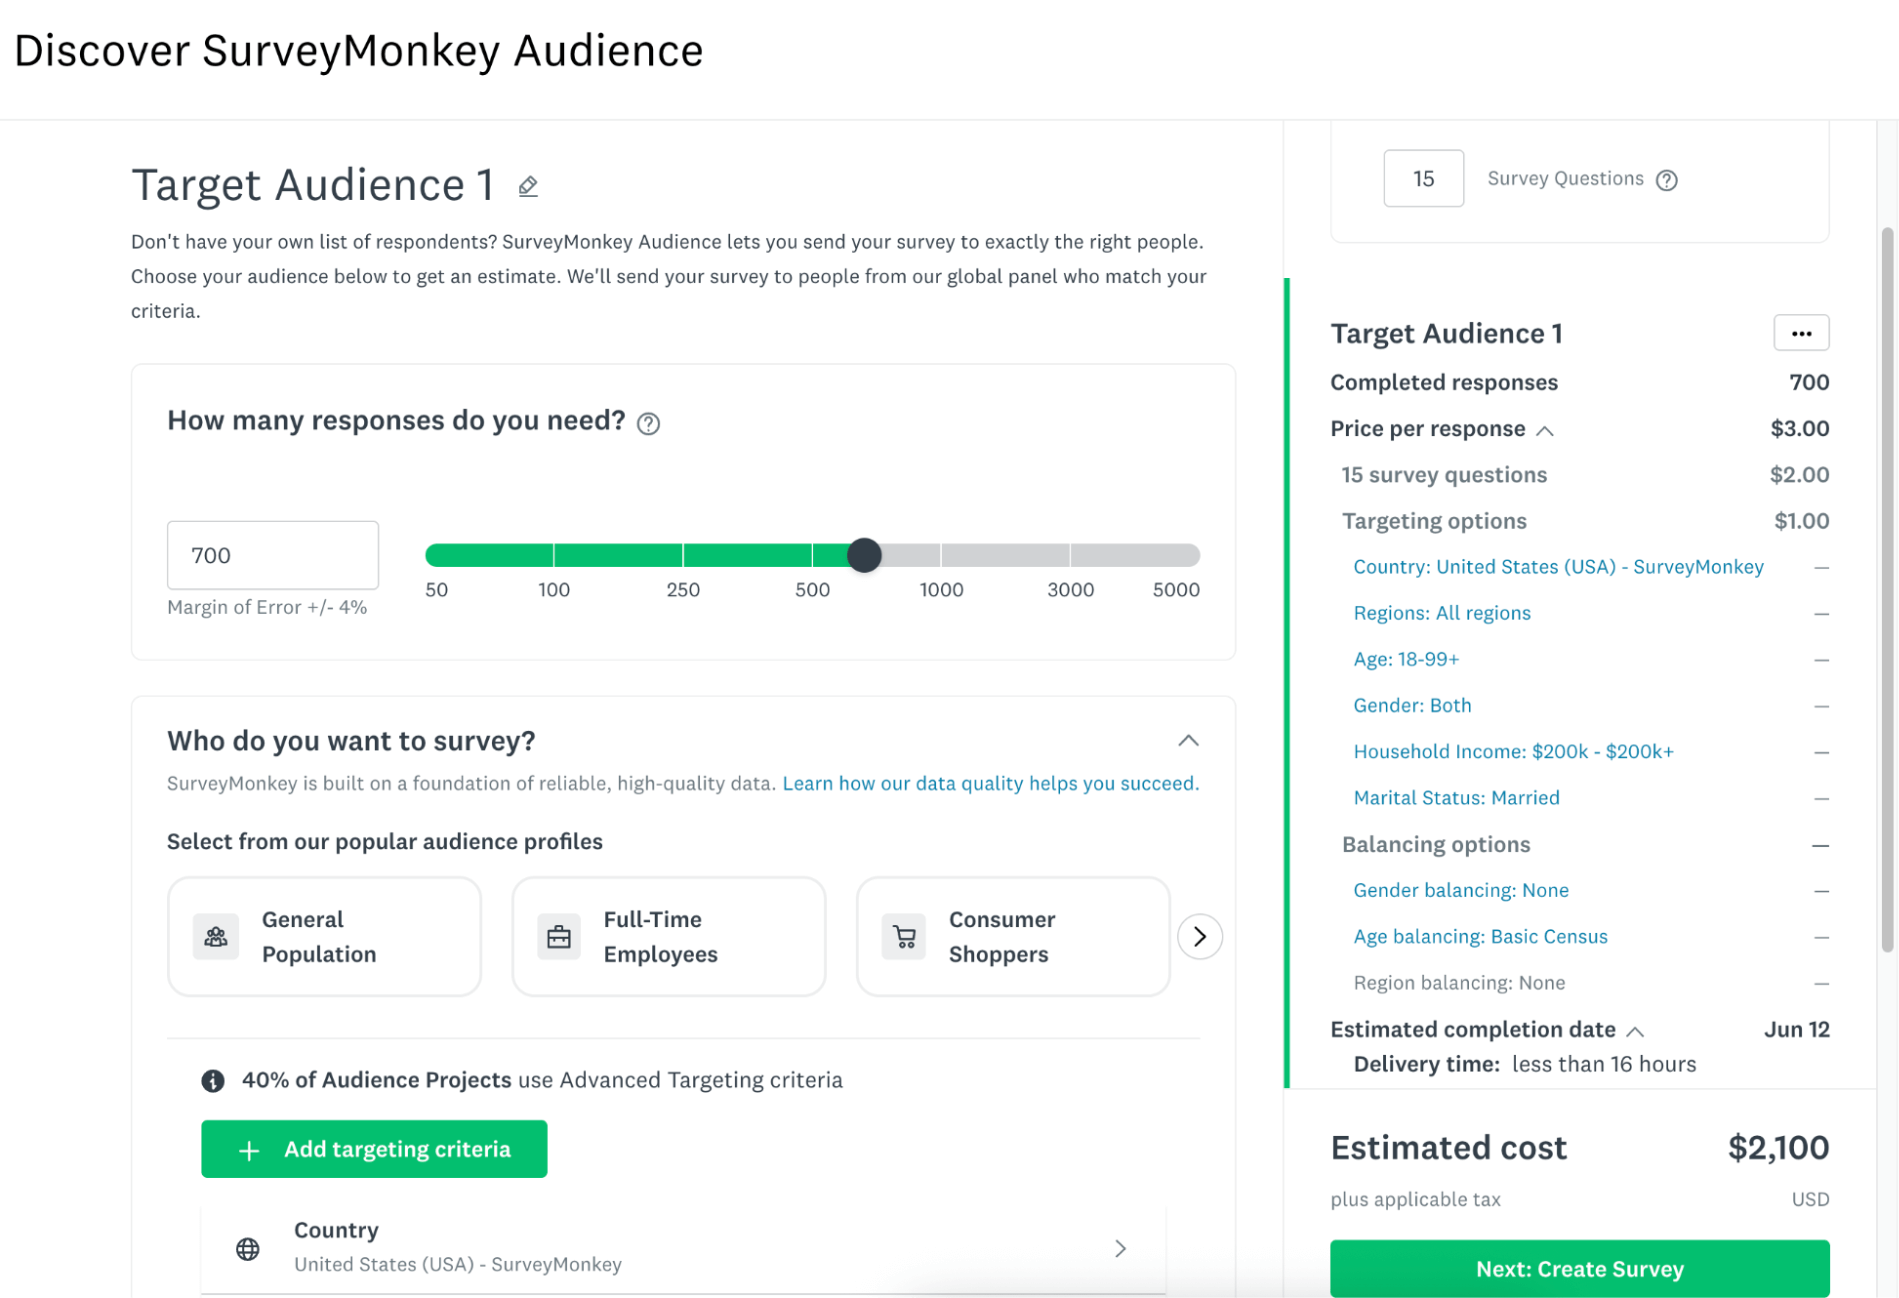
Here’s what a Pollfish customer said about our pricing transparency in their Trustpilot review:
“The dollar amount they [Pollfish] quote you in their cost calculator tool, and the number they show when you're developing the survey, is the number you pay. I was burned multiple times by SurveyMonkey charging me unexpected amounts and making it difficult to quit an expensive subscription. I'm so happy to have found Pollfish as an alternative.”
Moreover, we are often the most cost-effective option when comparing Pollfish to SurveyMonkey's pay-per-response pricing. As shown below, both survey platforms charge roughly the same for 1–5 questions. But as the question count increases, Pollfish becomes significantly cheaper:
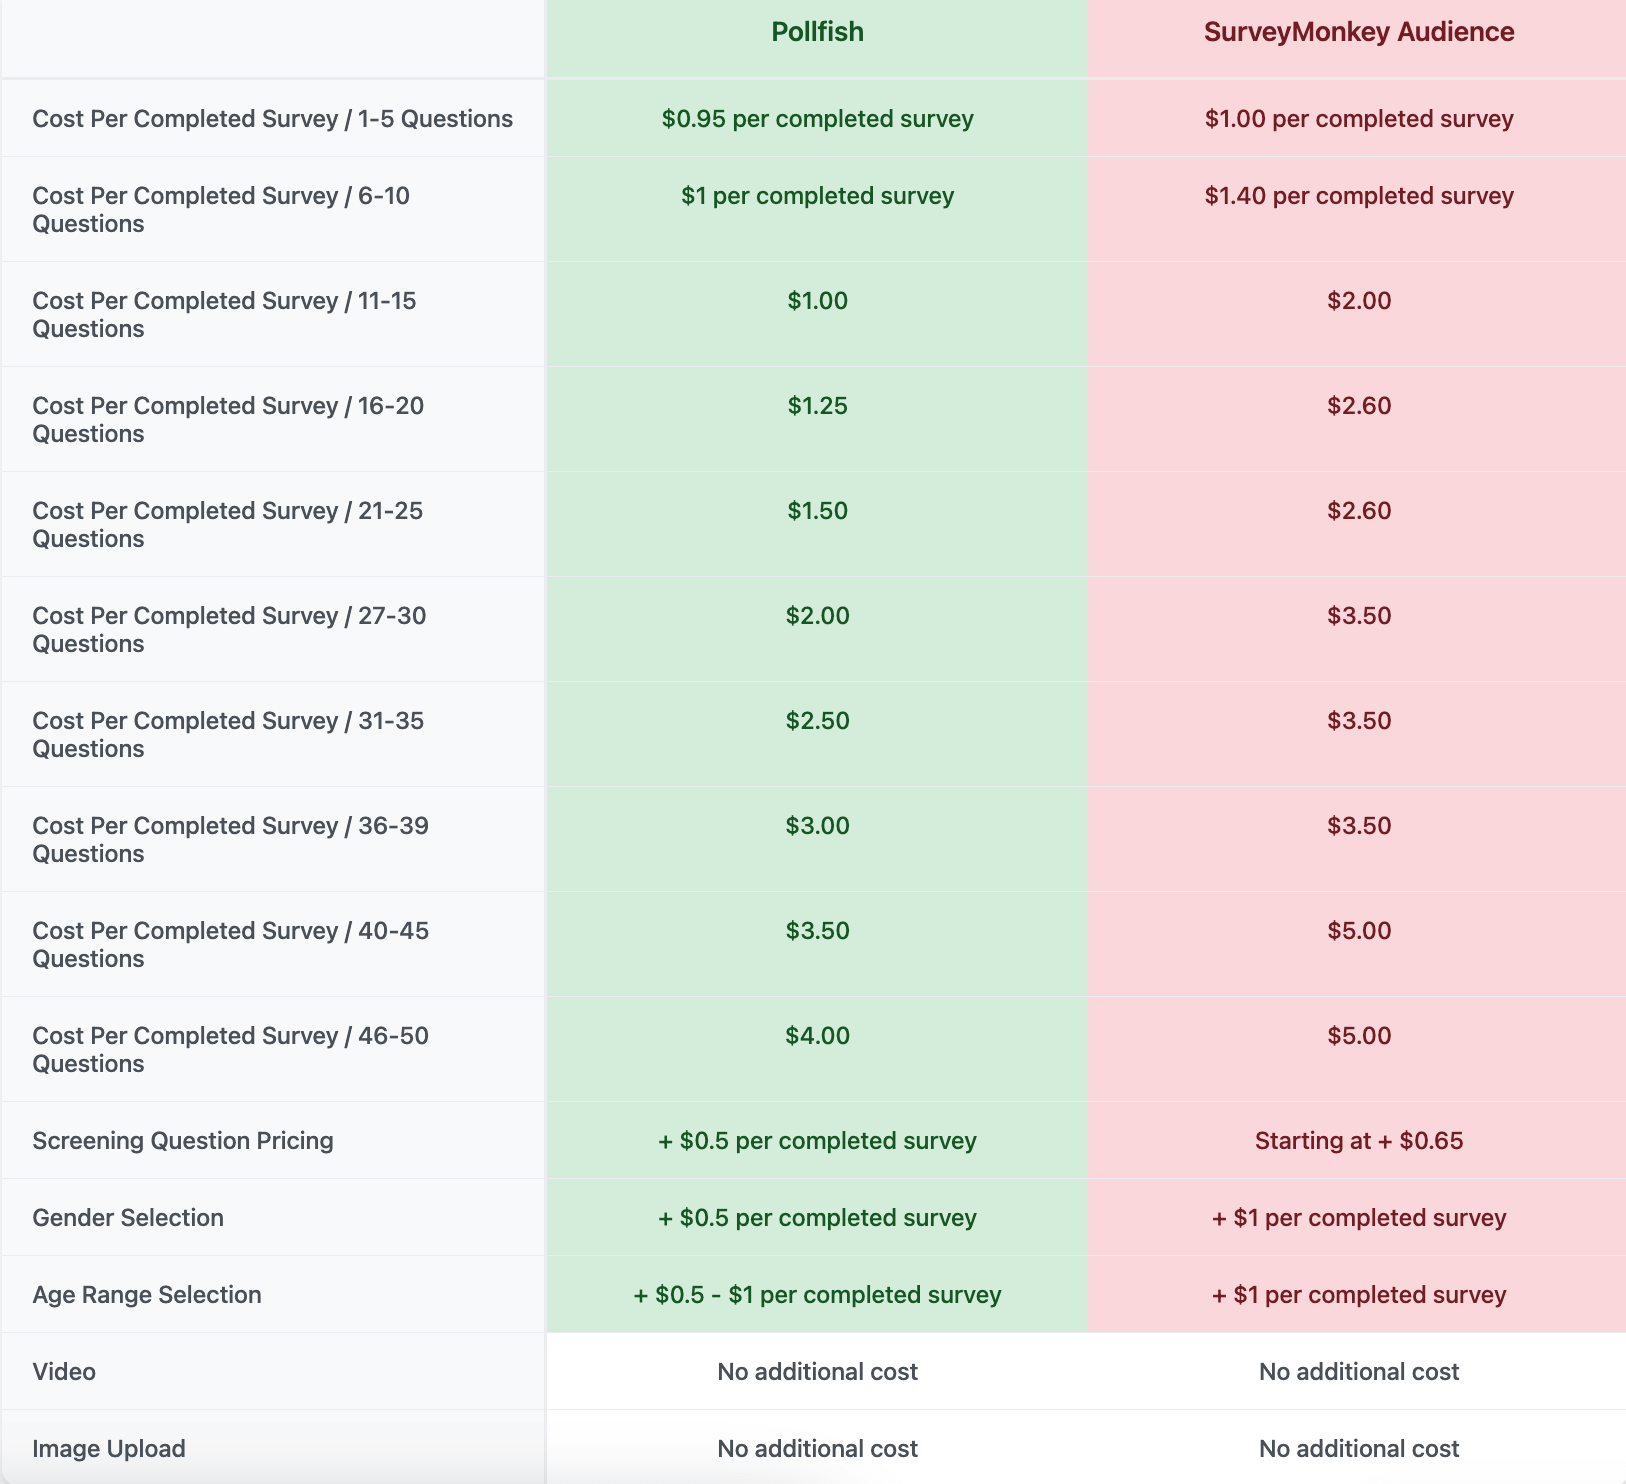
Additionally, for many audience filters, Pollfish's pricing is lower than SurveyMonkey's. Signing up for both platforms is free, allowing you to test them out for yourself!
Diving in Deeper: Feature Differences
SurveyMonkey is best for basic to intermediate needs. They excel at ease of use, and their platform has a minimal learning curve. However, many customers report that it lags behind in survey programming. As a Reddit user mentioned in this thread:
“Survey routing logic is way more time consuming in SurveyMonkey (and sometimes does not match what Qualtrics can do period). SurveyMonkey forces me to compromise the design of my surveys because I’m not able to pipe from certain question types or route in the way I want. My impression is that SurveyMonkey started as primarily a marketing survey tool and is better for more simple survey designs.”
Qualtrics is a powerful tool with enterprise-grade features and capabilities. However, they do come at a significant cost.
Pollfish offers all the powerful features you’d expect at a reasonable cost, and we offer a great user experience.
We particularly excel in advanced survey programming and complex skip logic and branching:
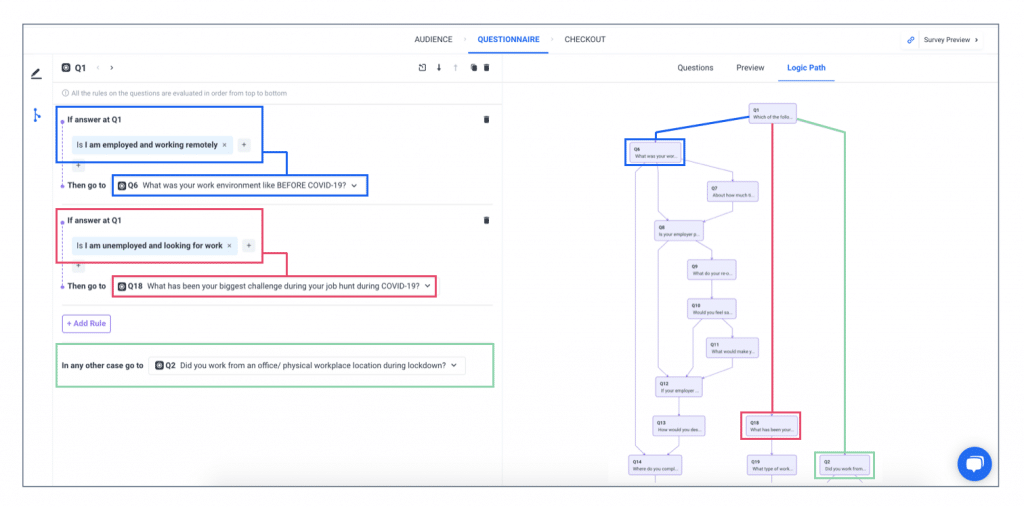
Not only is it highly powerful and customizable to set up the exact survey logic you need, but it's also intuitive and easy to understand. As we'll discuss next, we also provide 24/7 live support that you can leverage. Even when the platform is simple to use, we understand that having someone available to help can make the process even easier.
As a Pollfish customer mentioned in their G2 review:
“The interface was extremely intuitive and easy to use. I especially liked how we set up the logic for the questions. Furthermore, the customer support agents were awesome. They responded to every question I had in a timely manner. (And before we even paid a cent!)”
We also offer a wide array of other survey programming capabilities, including 16 question types (e.g., A/B test, Conjoint analysis, Max Diff, and Van Westendorp), AI online survey creation, survey templates, screening questions, question and answer shuffling to collect customer feedback, and more:
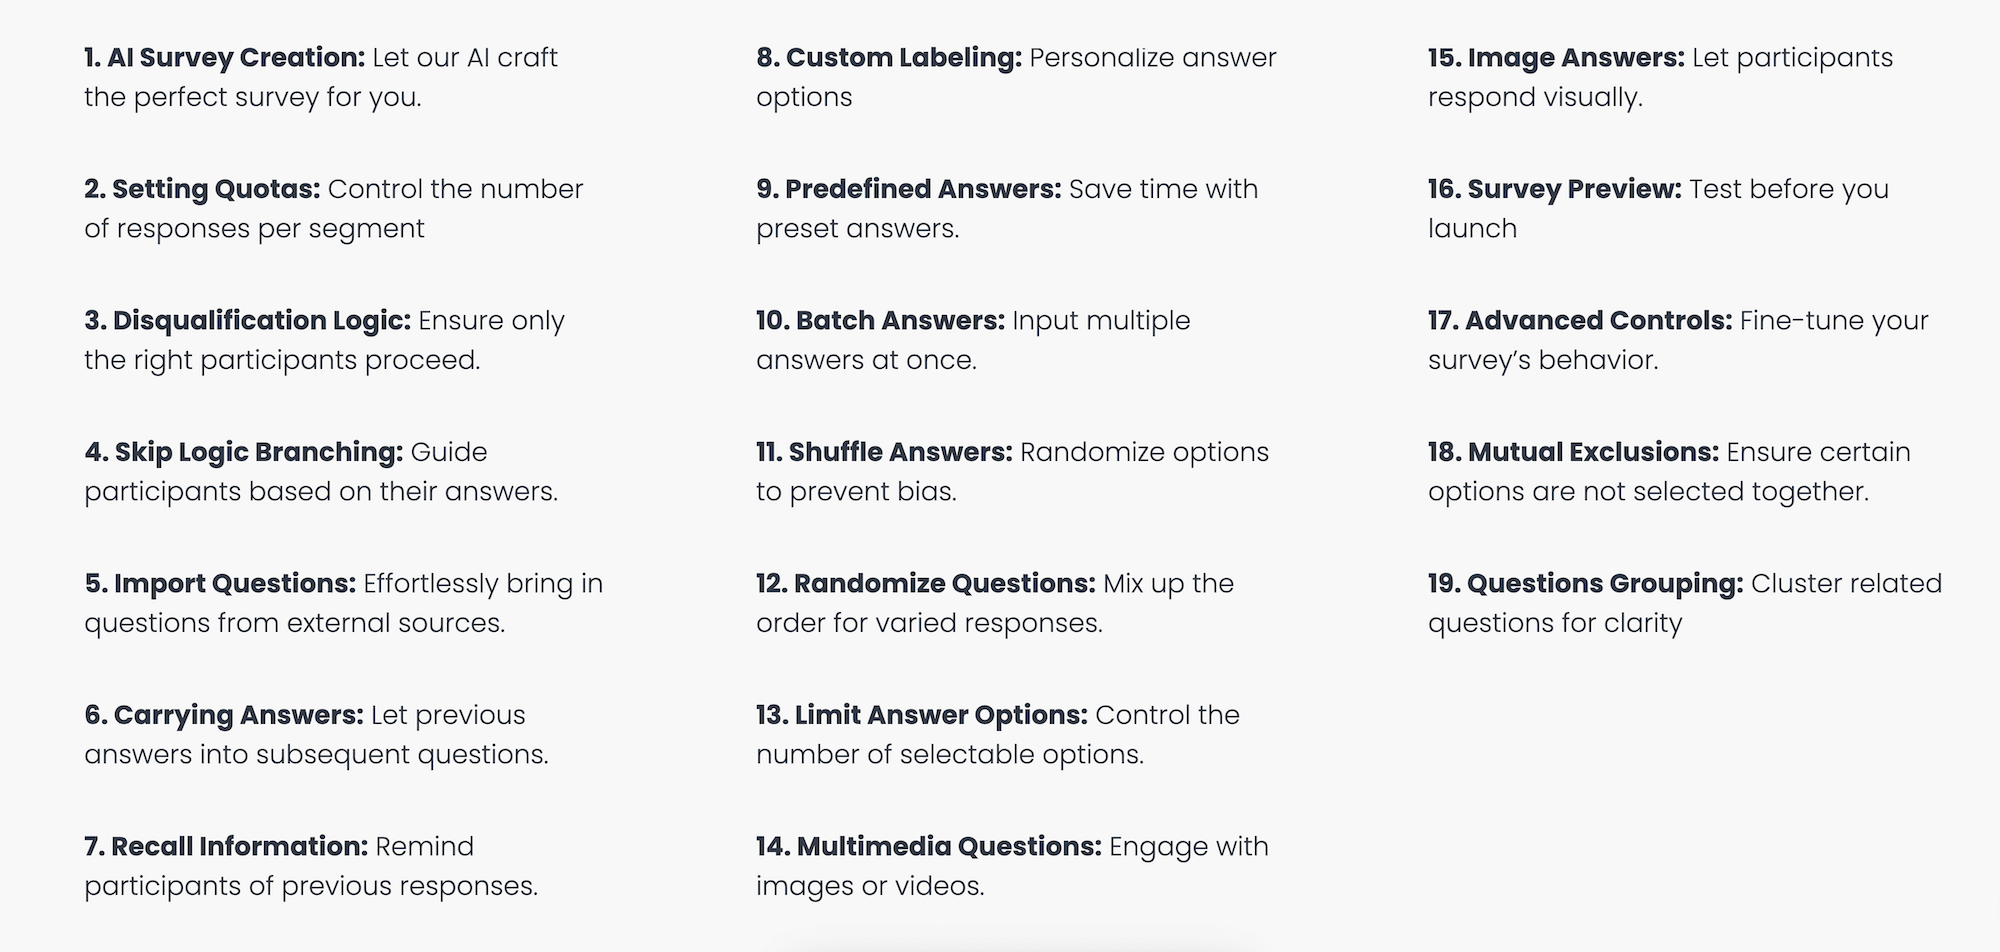
Additionally, we offer robust data analysis tools & capabilities. You can enable statistical significance testing, create crosstabs and data visualizations, and slice and dice data using multiple variables simultaneously:
Another unique feature is the ability to create presentations in real-time within Pollfish for easy export while your survey results are still being collected. This way, once the survey is complete, you'll have already begun the work to finalize the report and be ahead of schedule.
The features mentioned here are merely a glimpse of what Pollfish has to offer. In short, we can accommodate any research requirements, whether simple or complex.
Diving in Deeper: Customer Support
Customers who switch to Pollfish from Qualtrics and SurveyMonkey often express their satisfaction with the quality of our service.
Our support team is not only equipped to provide technical assistance but also consists of experienced market researchers who can offer guidance on more complex issues, ranging from questionnaire design to audience selection, survey data analysis, and more.
This level of support is provided complimentary (at no additional cost), and it's an invaluable resource that many customers may not realize they have access to when using Pollfish.
In addition, we offer 24/7 support via both live chat and phone. So, whether you're working late into the night to meet a tight deadline or putting in extra hours over the weekend, we'll be there to assist if you need us.
Below are several reviews from Trustpilot that highlight Pollfish’s exceptional customer experience:
- “The customer service team is super responsive too for those more complex enquiries about the tool and criteria. All in all this experience has been way easier (and cheaper) than any other 'big players' out there” (See review)
- “I love this product. I feel like it gives me enterprise grade market survey tech at a consumer price. Highly recommend. I love how responsive the customer support team is.” (See review)
- “The customer service I received was fantastic. Brilliant guidance that helped get high-quality results. I was really pleased with the outcome and highly recommend using them.” (See review)
Interested in Signing up for Pollfish?
- Sign up for a free account today — no credit card needed.
- Schedule a demo call and receive personalized guidance on how to maximize Pollfish for your needs.
13 Best SurveyMonkey Alternatives & Competitors: Paid & Free
13 Best SurveyMonkey Alternatives & Competitors: Paid & Free

In this post, we'll explore top SurveyMonkey alternatives, categorizing them into paid and free options to cater to different research needs and budgets.
Before diving into our recommendations, it's worth understanding why choosing a robust survey platform with advanced capabilities can deliver significantly better results:
❇️ Data Quality & Reliability
Advanced survey platforms offer sophisticated survey fraud prevention, verified respondent communities, and robust data quality controls that most free tools cannot match. When your business decisions depend on accurate research insights, the cost of poor data far exceeds the price of premium software.
❇️ Advanced Features & Customization
While basic tools work for simple questionnaires, advanced platforms offer more complex question types, advanced logic branching, and specialized research methodologies (e.g., conjoint analysis, MaxDiff).
Additionally, these platforms provide robust data analysis capabilities, including automated statistical significance testing, advanced filtering, and more — which can save you hours of manual work and help you uncover insights that might otherwise be missed.
In this article, we’ll discuss our own product, Pollfish, which provides upfront, usage-based pricing starting at just $0.95 per response with no subscription commitments. We’ll also explore additional paid and free SurveyMonkey alternatives.
Best Paid SurveyMonkey Alternatives
Best Free SurveyMonkey Alternatives
Note: Pricing information is subject to change. For the most current pricing, please visit each brand's website.
Paid SurveyMonkey Alternatives
1. Pollfish
Pollfish is our powerful DIY survey platform designed for researchers who need access to a large pool of pre-recruited respondents rather than bringing their own audience.
Below, we'll compare Pollfish with SurveyMonkey Audience (SurveyMonkey's service for accessing their respondent panel) across three key areas:
❇️ Audience Quality & Targeting Options
- SurveyMonkey's approach: At times, SurveyMonkey sources respondents from third-party panel suppliers, many of which are prone to "professional survey takers" who hastily complete surveys to maximize earnings, compromising response quality.
- Pollfish's approach: We utilize first-party data from our parent company, Prodege (the world's largest single-panel owner), where we manage communities like Swagbucks. As we'll cover in more detail later below, these communities have rigorous measures in place to ensure high-quality responses. Moreover, Pollfish offers a wider range of targeting criteria than SurveyMonkey.
❇️ Survey Pricing
- For 1–5 questions: Pollfish: $0.95 per response vs. SurveyMonkey: $1.00 per response
- 6–10 questions: Pollfish: $1.00 per response vs. SurveyMonkey: $1.40 per response
- 11–15 questions: Pollfish: $1.00 per response vs. SurveyMonkey: $2.00 per response
- And the cost advantage continues to grow. We'll include a comprehensive pricing chart demonstrating how SurveyMonkey consistently costs more per response than Pollfish across all question ranges.
Note: Pricing is always subject to change. For the most up-to-date pricing, please visit Pollfish and SurveyMonkey’s websites.
❇️ Customer Support Quality
What makes Pollfish unique: 24/7 complimentary guidance from experienced market researchers (not just technical support staff) who can assist with survey design best practices, optimal audience targeting and filter selection, data analysis and interpretation, and more. Many of our customers have expressed how much they appreciate this level of support, noting that it's rare in other survey platforms.
Pollfish’s Audience Quality & Targeting Capabilities
At Pollfish, we own and maintain our own respondent communities through our parent company, Prodege. This direct ownership allows us to implement rigorous quality control measures.
Our flagship community, Swagbucks, exemplifies this quality-first approach:
❇️ Surveys Are Just One of Many Earning Opportunities
Unlike traditional panels where respondents join solely to take surveys, our community members engage in diverse activities — watching movies, playing games, shopping online, uploading receipts, and more. This variety means surveys aren't their primary focus, reducing the "professional survey taker" mentality that leads to rushed, low-quality responses.
❇️ Opt-In Participation, Not Aggressive Outreach
We deliberately avoid sending frequent survey invitations via email or text. Instead, members access surveys through their dashboard when they choose to participate, ensuring they're in the right mindset to provide more thoughtful responses.
❇️ Mandatory 30-Day Evaluation Period
Prospective survey takers must complete a mandatory 30-day period of filling out internal surveys. Only those who demonstrate high-quality responses during this time are permitted to participate in client surveys.
❇️ Trust Quality Scoring System
We continually monitor survey response quality through both manual and automated means. Panelists with higher quality responses earn greater trust scores, unlocking more earning opportunities within our ecosystem.
❇️ Advanced anti-fraud measures
We employ several methods, including tracking unique user IDs (to prevent duplicate survey takers), trap questions, speeding prevention, anti VPN measures, gibberish detection, straight lining detection (consistently selecting the same answer), conducting human review of open-text responses, and much more.
Prodege provides access to over 100 million respondents across 160 countries and 345 cities. This massive scale enables a wider range of targeting options compared to SurveyMonkey:
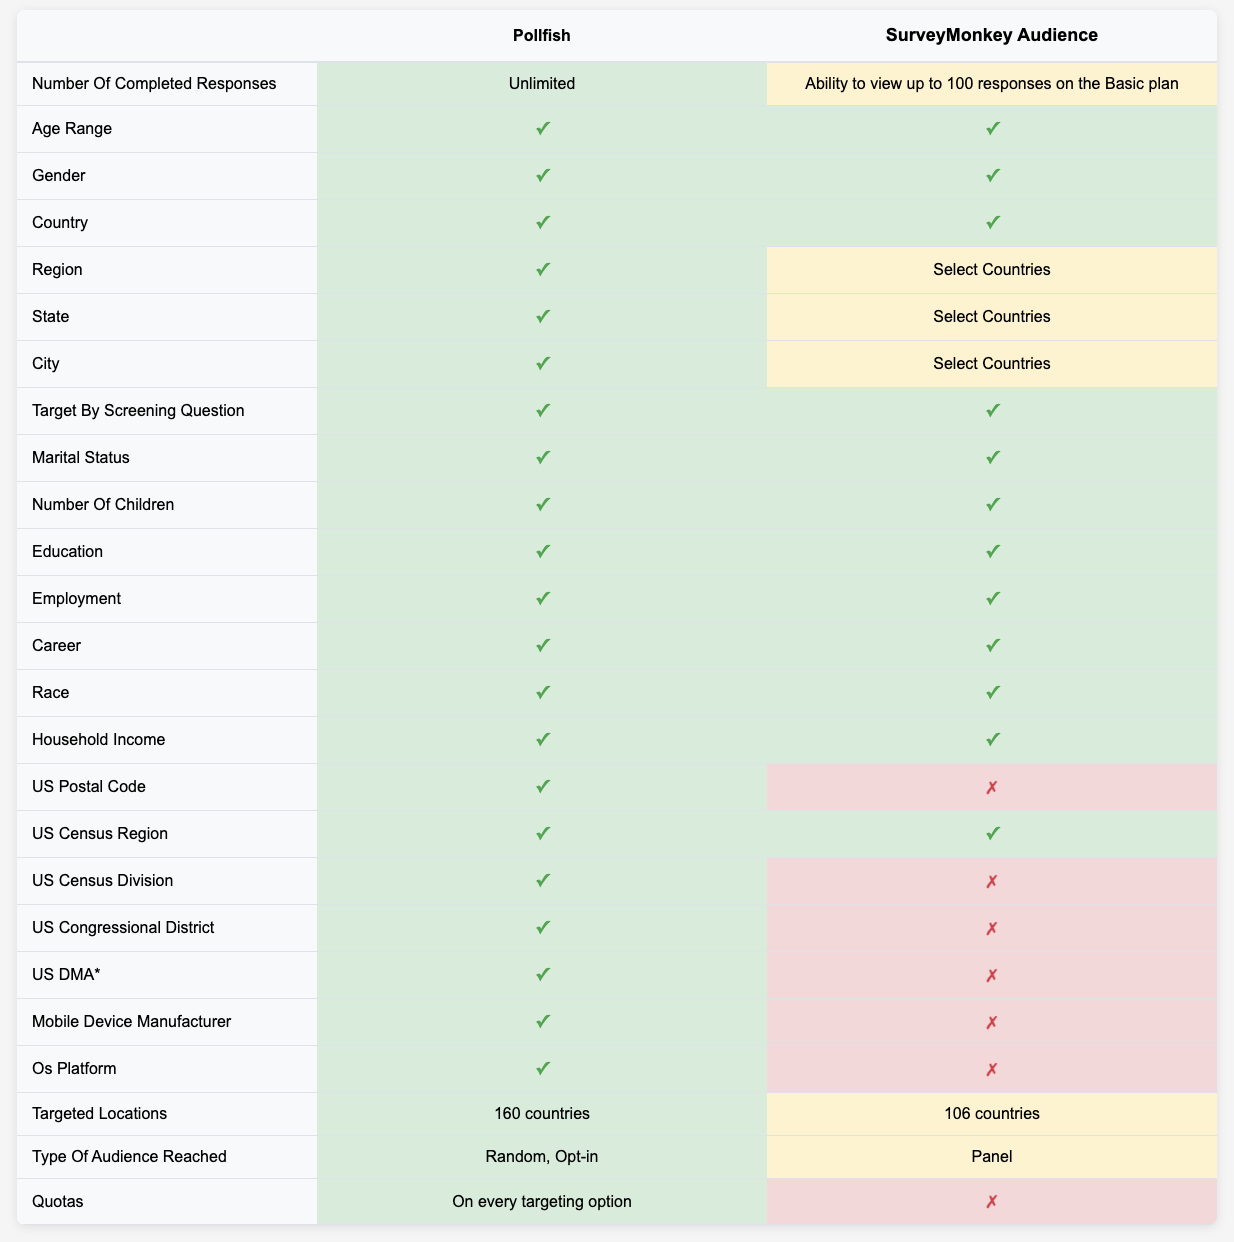
This comparison highlights several key differences, particularly in geographic targeting. Pollfish supports more regions and postal codes, and even allows targeting by congressional district or custom radius (select any location and specify distance parameters).
Another area where Pollfish differentiates itself is behavioral targeting. Through Prodege's ecosystem, panel members upload actual purchase receipts to earn rewards, enabling remarkably precise audience targeting based on verified purchase behavior rather than unreliable self-reported claims.
For example, instead of targeting people who simply check "outdoor activities" on a survey, you can target consumers who actually purchased camping equipment with verified REI receipts — ensuring you reach genuinely relevant respondents.
Note: We encourage you to contact us directly with questions about reaching your specific target audience. No matter how broad or niche, we can likely accommodate your needs.
Pollfish vs. SurveyMonkey: Cost Breakdown
Note: Pricing is always subject to change. For the most up-to-date pricing, please visit Pollfish and SurveyMonkey’s websites.
At Pollfish, you pay only for the survey responses you collect — no monthly subscription plans and no extra fees for premium features. Just straightforward pay-per-response pricing.
❇️ Per-response pricing comparison: For 1–5 questions, Pollfish is $0.95 per response vs. SurveyMonkey at $1.00 per response. This is a relatively similar rate. However, for surveys with 6+ questions, SurveyMonkey consistently charges significantly higher per-response rates:
Additional Cost Advantages
❇️ Demographic Targeting
Pollfish offers more competitive pricing for basic demographic filters like gender and age selection.
❇️ Screening Questions
While Pollfish charges $0.50 per completed response for screening questions, SurveyMonkey’s pricing starts at $0.65, and this number increases with incidence rate.
❇️ Skip Logic and Advanced Survey Programming
Essential survey design capabilities like skip logic, question randomization, advanced question types (e.g., matrix), etc., are included at no additional cost with Pollfish. SurveyMonkey requires you to upgrade to a paid subscription plan to access these same features.
…and more.
Customer Support Quality
One of the most frequent compliments we receive from customers is about our exceptional support quality — something that's surprisingly rare in the market research survey industry, which often requires expert guidance beyond basic platform navigation:
❇️ We have experienced market researchers on our support team who help you design better studies, not just customer service representatives limited to basic technical troubleshooting.
❇️ Expert guidance for any research question, whether simple or complex. Need help structuring branching logic to maximize response quality? We'll walk you through it. Unsure about the optimal sample size for statistical significance? We'll explain the calculations. Survey results appear contradictory? Our researchers will guide you through proper analysis and interpretation techniques.
❇️ This level of support comes at no extra cost. You're not paying premium consulting fees for expert guidance — it's simply part of how we ensure our customers' success.
❇️ Always accessible when you need us. We offer genuine 24/7 support via live chat or phone, including evenings and weekends.
Online Reviews from SurveyMonkey Customers Who Switched to Pollfish
Below are several Trustpilot reviews from customers who switched from SurveyMonkey to Pollfish:
- “The dollar amount they quote you in their cost calculator tool, and the number they show when you're developing the survey, is the number you pay. I was burned multiple times by SurveyMonkey charging me unexpected amounts and making it difficult to quit an expensive subscription. I'm so happy to have found Pollfish as an alternative. Their support team also responds VERY quickly to chat messages and has been tremendously helpful the few times I had questions.” (Read full review)
- “Cheaper than SurveyMonkey and gives so much more demographic data”. (See review)
- “Excellent insights, easy to use. Pollfish's audience data and survey flexibility were a perfect match for my needs. I've used SurveyMonkey as well and prefer Pollfish. The question logic tools are more straightforward, the image-based question capability is easier, and the audience data was meaningfully less expensive.” (See review)
Sign Up for a Free Pollfish Account or Book a Demo
Interested in learning more about Pollfish?
We invite you to create a free account (no credit card required) or book a personalized demo.
2. Qualtrics
Qualtrics is a SurveyMonkey alternative that’s best suited for enterprise organizations. We cover what differentiates Pollfish in this post.
Qualtrics’ features can be categorized into three areas:
1. Customer Experience
- Voice of Customer
- Omnichannel Experience Management
- Digital Experience Analytics
- Website & App Feedback
- Location Experience Hub
- Online Reputation Management
- Contact Center Analytics
- Quality Management & Compliance
- Agent Coaching
- Edge Instant Insights
2. Employee Experience
- Employee Engagement
- Employee Pulse
- Employee Research
- Candidate Experience Management
- Employee Onboarding & Exit
- 360 Development Feedback
- Employee Retention Analytics
- Continuous Employee Listening
3. Strategy & Research
- Strategic Market Research
- Product Research
- Brand and Communication Research
- User Experience Research
- Edge Audiences
3. Alchemer
Alchemer (formerly known as SurveyGizmo) is a SurveyMonkey alternative with various features and functionality, including:
- Market research surveys
- Real-time, in-app customer feedback
- Brand health tracking and consumer insights
- Text sentiment analysis
It offers solutions by industry, including Education, Government, Non-Profit, Food & Beverage, Financial Services, Retail, Software, etc.
4. Suzy
Suzy is a SurveyMonkey alternative with various features and functionality, including:
- Quantitative surveys
- Qualitative multi-person focus groups, 1-on-1 interviews, and in-home product testing
- AI survey creation and templates to help save you time
- Email, CRM, and social media integration to help connect with audiences
- AI-powered analytics and reporting, helping you easily gain actionable insights
5. SurveySparrow
SurveySparrow breaks down their features into 5 categories:
1. Surveys
- Conversational Surveys
- Offline Surveys
- SMS / Text Surveys
- Executive Dashboard
- SpotChecks: In-app Feedback
- AI-powered Text Analytics
- Multi-lingual Surveys
- Security
- Workflows
- White Labelling
2. CX
- NPS
- CSAT
- Voice of Customer Surveys
3. Reputation
- Review Monitoring
- Social Listening
- Boost Reviews
4. Ticketing
- SLA Management
- Automated Workflows
- Ticket Dashboard
- Locations
5. 360 Assessments
- Personalized Insights
- AI-driven PDPs
- Heatmaps
- Team Analytics
6. Forsta
Forsta is a SurveyMonkey alternative that offers a variety of features and functionality, including:
- Market research surveys
- Panel management
- Online focus groups
- Digital diaries & communities
- Social listening
- Research automation
- Text analytics
- Voice sentiment analysis
- And more
Free SurveyMonkey Alternatives
7. Google Forms
Google Forms is a free SurveyMonkey alternative with a minimal learning curve that can help you:
- Build forms via a user-friendly drag-and-drop interface
- Easily share online forms via email or social media, or embed them on your company’s website
- Optionally utilize premade templates for online surveys and questionnaires
- Build custom flows and quizzes
- Analyze survey data and customize visualizations to match your brand identity
…and more
8. Typeform
Typeform is a SurveyMonkey alternative that offers a free plan, and it boasts a wide range of features and functionality, including:
- Form builder
- Survey maker
- Quiz maker
- Test maker
- Poll builder
- Application form builder
- Landing page builder
- NPS form builder
- Registration form builder
- Short form builder
You can use it for a variety of use cases, including:
- Market research
- Lead generation
- Employee onboarding
- Employee satisfaction
- Employee engagement
- Customer feedback
- Customer satisfaction
- Event planning
- Customer engagement
- Customer testimonials
- Candidate feedback
…and more.
9. Jotform
Jotform is a SurveyMonkey competitor that offers a free plan, and it boasts a wide range of features and functionality, including:
- Form Builder
- Jotform Enterprise
- Jotform Apps
- Store Builder
- Jotform Tables
- Jotform Inbox
- Jotform Mobile App
- Report Builder
- Smart PDF Forms
- PDF Editor
- Jotform Sign
- Jotform Workflows
- Jotform for Salesforce
- Jotform AI Agents
- Jotform Boards
They offer a user-friendly interface and integrate with Microsoft Teams, PayPal, Slack, Google Sheets, Mailchimp, Zoom, Dropbox, Google Calendar, Salesforce, and many other tools.
10. Microsoft Forms
Microsoft Forms is a SurveyMonkey competitor with a free plan. It has an intuitive interface and offers several features and functionality, including:
- Surveys, polls, and quizzes to collect data
- Built-in AI and smart recommendations
- A wide variety of seamless integrations to connect with your audience and streamline operations
- Data analysis visualizations and automatically generated reports in various formats
11. Zoho Survey
Zoho Survey is an alternative to SurveyMonkey that offers a free plan. It boasts several features and functionality, and lets you:
- Create surveys, polls, and quizzes
- Translate surveys
- Share surveys
- Secure surveys
- Personalize surveys
- Analyze reports
- Display logic
- Apply other customization options
Their product can help you with multiple functions, including market research, product experience, candidate assessment, customer experience, brand experience, and more.
12. Survicate
Survicate is a SurveyMonkey alternative that offers a free version. They break down their features into 3 categories:
1. Survey Software
- Create Surveys
- Distribute Surveys
- Analyze Surveys
- Act on Feedback
2. Digital User Feedback
- Mobile App Feedback
- Website Feedback
- In-Product Feedback
- Email Surveys
3. Feedback Analytics
- Dashboards
- Insights Hub
- AI Analysis
Survicate can be used by various teams, including product management, marketing, user research, customer experience, and more. It can also be used for different industries, including SaaS, apps, E-commerce, healthcare, financial services, and more.
They offer various survey templates and metrics, including Net Promoter Score (NPS), Customer Satisfaction Score (CSAT), Customer Effort Score (CES), Software Evaluation, 1-10 Rating Scale, and more.
13. Tripetto
Tripetto positions itself as a tool that’s “like SurveyMonkey, Typeform and Landbot united, but with a fresh take on truly smart form building and safe data collection”. They provide a free plan and offer several features and functionality, including:
- Create conversational forms
- Sharm forms with a link
- Embed forms in a website
- Optimize and style forms
- Unlimited number of forms
- Unlimited questions per form to collect responses
- Unlimited conditional logic jumps
- Unlimited number of closing messages per form
- Unlimited number of responses per form
Sign Up for a Free Pollfish Account or Book a Demo
Interested in learning more about Pollfish, our paid survey tool with premium functionality?
We invite you to create a free account (no credit card required) or book a personalized demo walkthrough.

8 Best Market Research Services: In-Depth Look
8 Best Market Research Services (In-Depth Look)
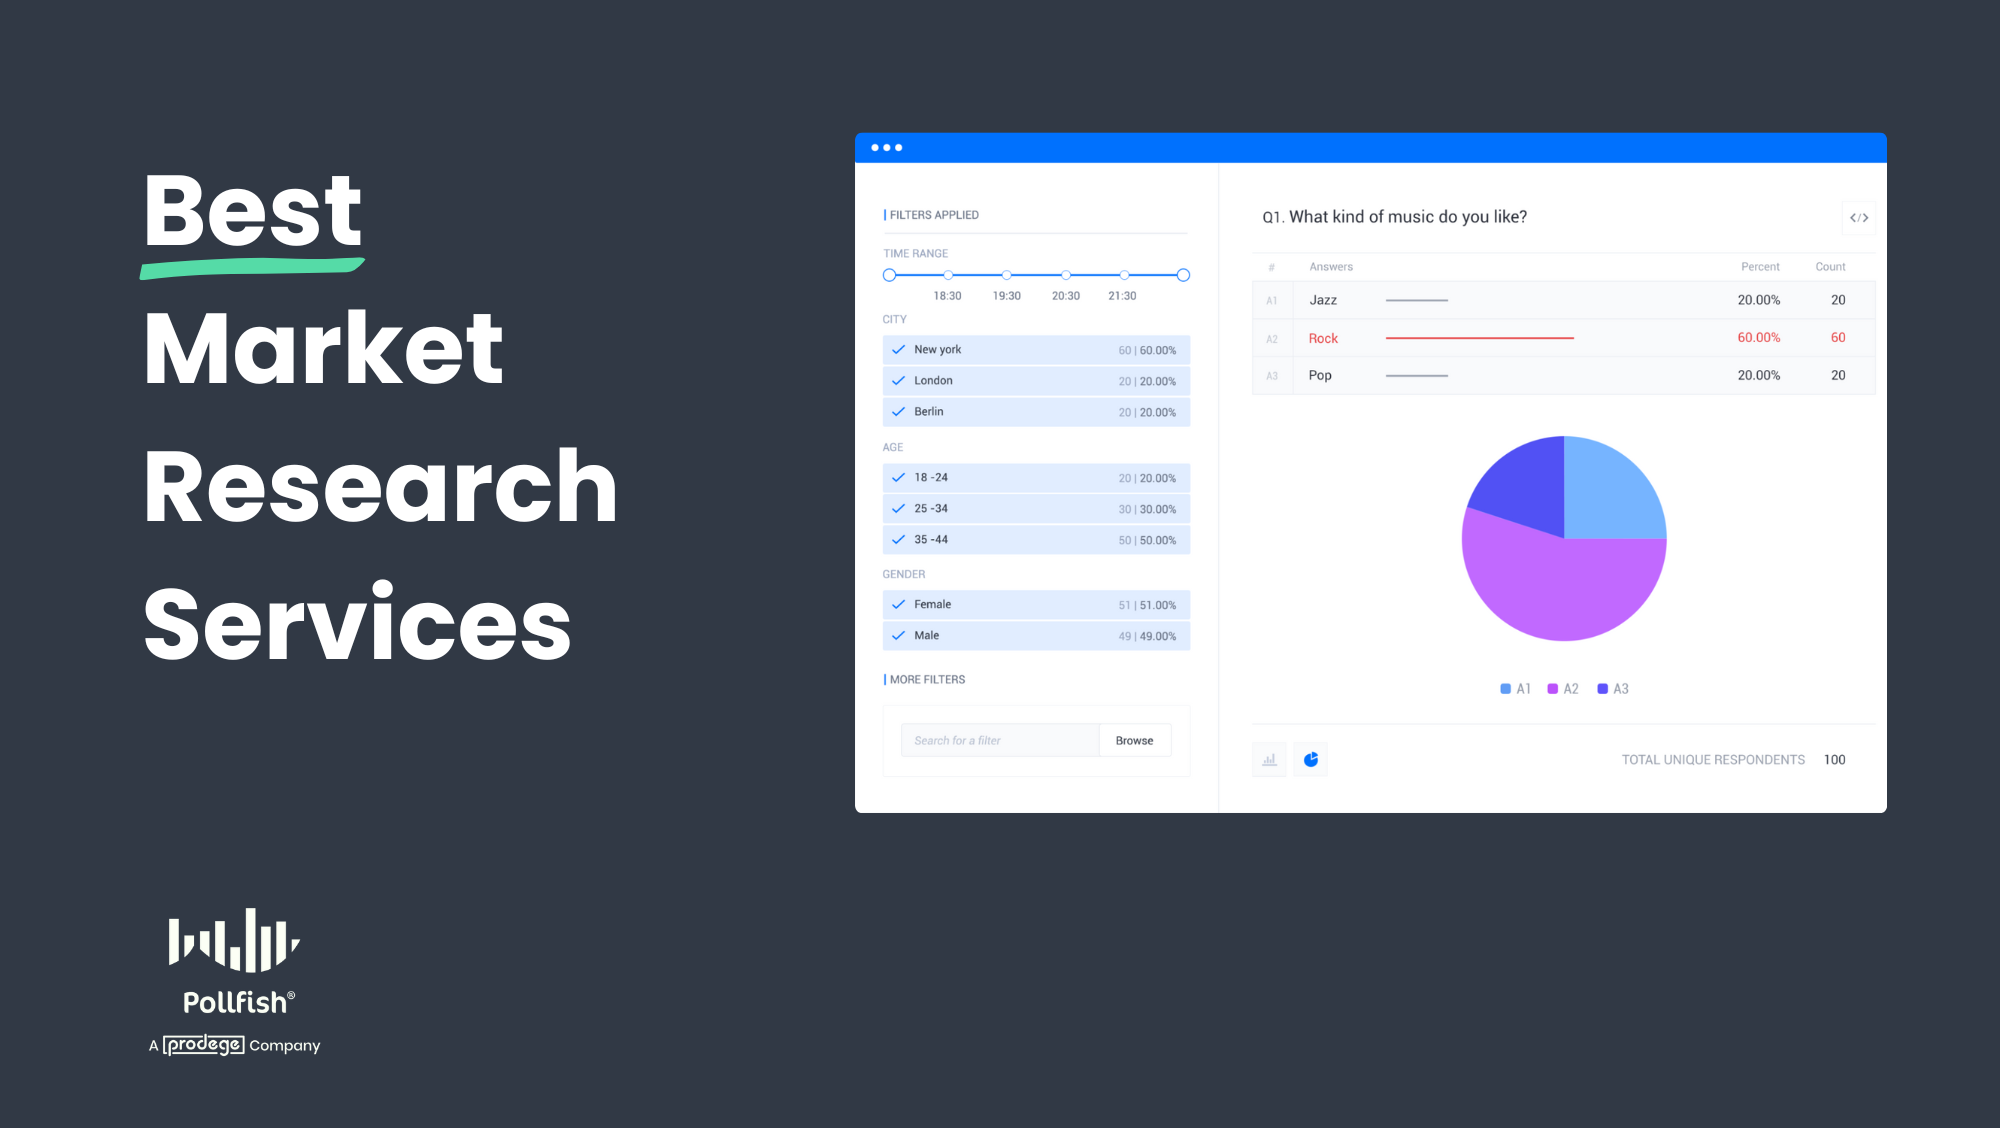 Companies turn to market research services to free up their time and leverage specialized expertise because:
- Programming surveys is often more time-consuming than anticipated. We recommend this guideline: if programming your survey would take more than 30 minutes, consider delegating it to a market research service instead. This frees up your time for higher-value work.
- Market research firms bring deep expertise across multiple areas. This includes survey programming, sample and fielding, data analysis & visualization, reporting, and more. Also, while you may excel in certain areas, partnering with a market research service allows you to leverage their expertise in other critical domains where you may have less experience.
There are different types of market research services depending on your needs:
- For high-quality services at a reasonable cost, consider options like Prodege (our own service), Qualtrics, SurveyMonkey, and SG Analytics.
- For more consultative, high-touch engagements — typically at a higher price point — firms like Kantar and Ipsos are strong choices.
- Looking for niche services? MarketResearch.com offers high-quality market research reports, while federal, state, or local agencies might explore GSA.
Next, we'll dive deeper into each of these options, starting with our own market research service, Prodege.
Table of Contents
1. Prodege (Pollfish’s Parent Company)
Up next, we'll focus on Prodege's full-service market research offering. However, it's important to note that Prodege operates as both a full-service research provider and a technology company. We've built and acquired several proprietary market research platforms over the years, including Pollfish — a leading DIY survey tool for companies who prefer to manage their own research projects.
Below, we’ll cover:
- How Prodege’s assisted service for market research works
- Key benefits of choosing Prodege over other market research services, namely:
- Dedicated specialists for each project instead of spreading one person too thin
- Higher data quality through Prodege’s owned and operated audience panels
- Prodege's proprietary tech platforms, such as Pollfish, increase speed, efficiency, and cost savings for clients
How Prodege’s Done-for-You Market Research Service Works
Choose the level of support that fits your needs
You have the flexibility to choose between an end-to-end service option, where we handle the entire process from start to finish, or select specific areas you need assistance with, such as:
- Research design: Our team of market research experts can advise on the type of research needed to achieve your objectives and draft the survey.
- Survey programming: We handle complex survey logic with ease and create engaging surveys optimized for desktop and mobile.
- Sample & fielding: We leverage Prodege's proprietary respondent network to precisely reach your target audience, manage quota fulfillment, and ensure high-quality data collection.
- Data processing & analysis: Our Insights Builder platform automatically visualizes your data in exportable, editable PowerPoint graphics so you can spend your time on the insights instead of the visuals, saving you countless hours. Traditional crosstabs with full stat testing are also available.
- Reporting: We create polished, visually engaging presentations ready for sharing with stakeholders.
Beyond quantitative surveys, we can also handle your qualitative research needs, including online focus groups and one-on-one interviews. Here’s a customer testimonial from Remesh:
“Working with Prodege has allowed us to provide quality sample and a smooth recruitment process from beginning to end for our large-scale qual sessions. We can always count on the team for fast recruitment programming, excellent screening and quota delivery, low incidence rate audiences, and timely turnaround for all our projects. The customer service of their project management team is unmatched.”
Dedicated Specialists for Each Project Instead of Spreading One Person Too Thin
At industry conferences, the most common feedback we hear is, "your team goes above and beyond" — a reputation we've earned by putting dedicated specialists behind each project instead of spreading one person too thin.
Each project typically includes both a sample manager and a project manager, with additional specialized roles added based on your specific service needs.
This approach means:
- Reliable follow-through, since we have the dedicated resources to deliver on every commitment.
- Exceptional responsiveness when you have questions or need updates.
- Expert knowledge across all aspects of your research.
Higher Data Quality Through Prodege’s Owned and Operated Audience Panels
Survey Fraud and Bots: A Growing Industry Challenge
Survey fraud and bot responses have become a major problem across the market research industry, with incidents increasing dramatically since the pandemic began.
Why Is This Important?
Data quality is arguably the most important consideration when choosing a market research company. Even the most expertly designed survey becomes unreliable if responses are low quality, and business decisions based on flawed data can be extremely costly.
Our Solution: First-Party Audience Data
Unlike many research firms that purchase respondents from third-party panel providers with unknown quality standards, Prodege owns and operates its own first-party audience networks.
This ensures authentic, reliable responses. For example, through one of our flagship communities, Swagbucks, we maintain rigorous quality standards, including:
- 30-day evaluation period: New members can only participate in internal surveys (not client-facing ones) for their first 30 days while we closely monitor their response quality. They gain access to client surveys only after proving they provide consistently high-quality, thoughtful answers.
- Identity verification through purchase receipts: Members earn rewards through multiple activities beyond surveys, including uploading purchase receipts. Bots cannot replicate this behavior, allowing us to confirm that respondents are real humans while also validating the accuracy of their self-reported preferences and behaviors. For instance, if someone claims to be a dog owner but their receipts show consistent cat food purchases and cat litter with no dog-related products, we may flag this inconsistency for review.
- Opt-in survey participation: While many 3rd-party panels inundate panelists with aggressive email and text campaigns to drive survey participation, we take a different approach. Within our dashboard — which features games, videos, and other engaging activities to earn rewards — surveys become just one appealing option among many that panelists can naturally navigate to on their own accord when they feel ready and motivated to participate, resulting in higher-quality responses.
- Trust quality scoring: Members who consistently provide high-quality responses unlock increased earning opportunities, creating strong incentives for thoughtful participation.
- Advanced anti-fraud procedures: These include unique user IDs, anti-VPN measures, trap questions, speeding prevention, straight-lining detection, manual human review of open-text responses, and the list goes on.
These examples highlight just a few of our comprehensive data quality measures.
In short, data integrity is fundamental to our mission, and Prodege is recognized industry-wide as the gold standard for research data quality.
Prodege's Tech Platforms Increase Speed, Efficiency & Cost Savings for Clients
Prodege is a technology company that has acquired multiple proprietary platforms to deliver faster, higher-quality services at lower costs — advantages we pass directly to our clients.
A prime example is Insights Builder (a powerful data analysis and visualization tool), which allows us to manipulate complex survey data, create sophisticated graphs, perform statistical testing, and more — all within minutes directly on our platform:
Without Insights Builder, these same tasks would require hours of manual work in other external tools, significantly increasing both project timelines and costs.
Below is a customer testimonial from BuzzFeed regarding our data visualization technology.
Furthermore (as previously mentioned), Prodege owns and operates its own audience panels instead of purchasing from third-party providers. This internal control makes a substantial difference in terms of cost, speed of delivery, and most crucially, data quality.
In addition, Prodege owns and operates Pollfish (a leading DIY market research survey platform) for companies who prefer to manage their own research projects. We explore Pollfish capabilities in our article on the best survey software for market research.
Interested in Learning More?
We invite you to:
- Book an introductory call
- Explore Prodege’s case studies
- Explore Pollfish’s DIY survey platform
- Visit Prodege’s site
2. Qualtrics
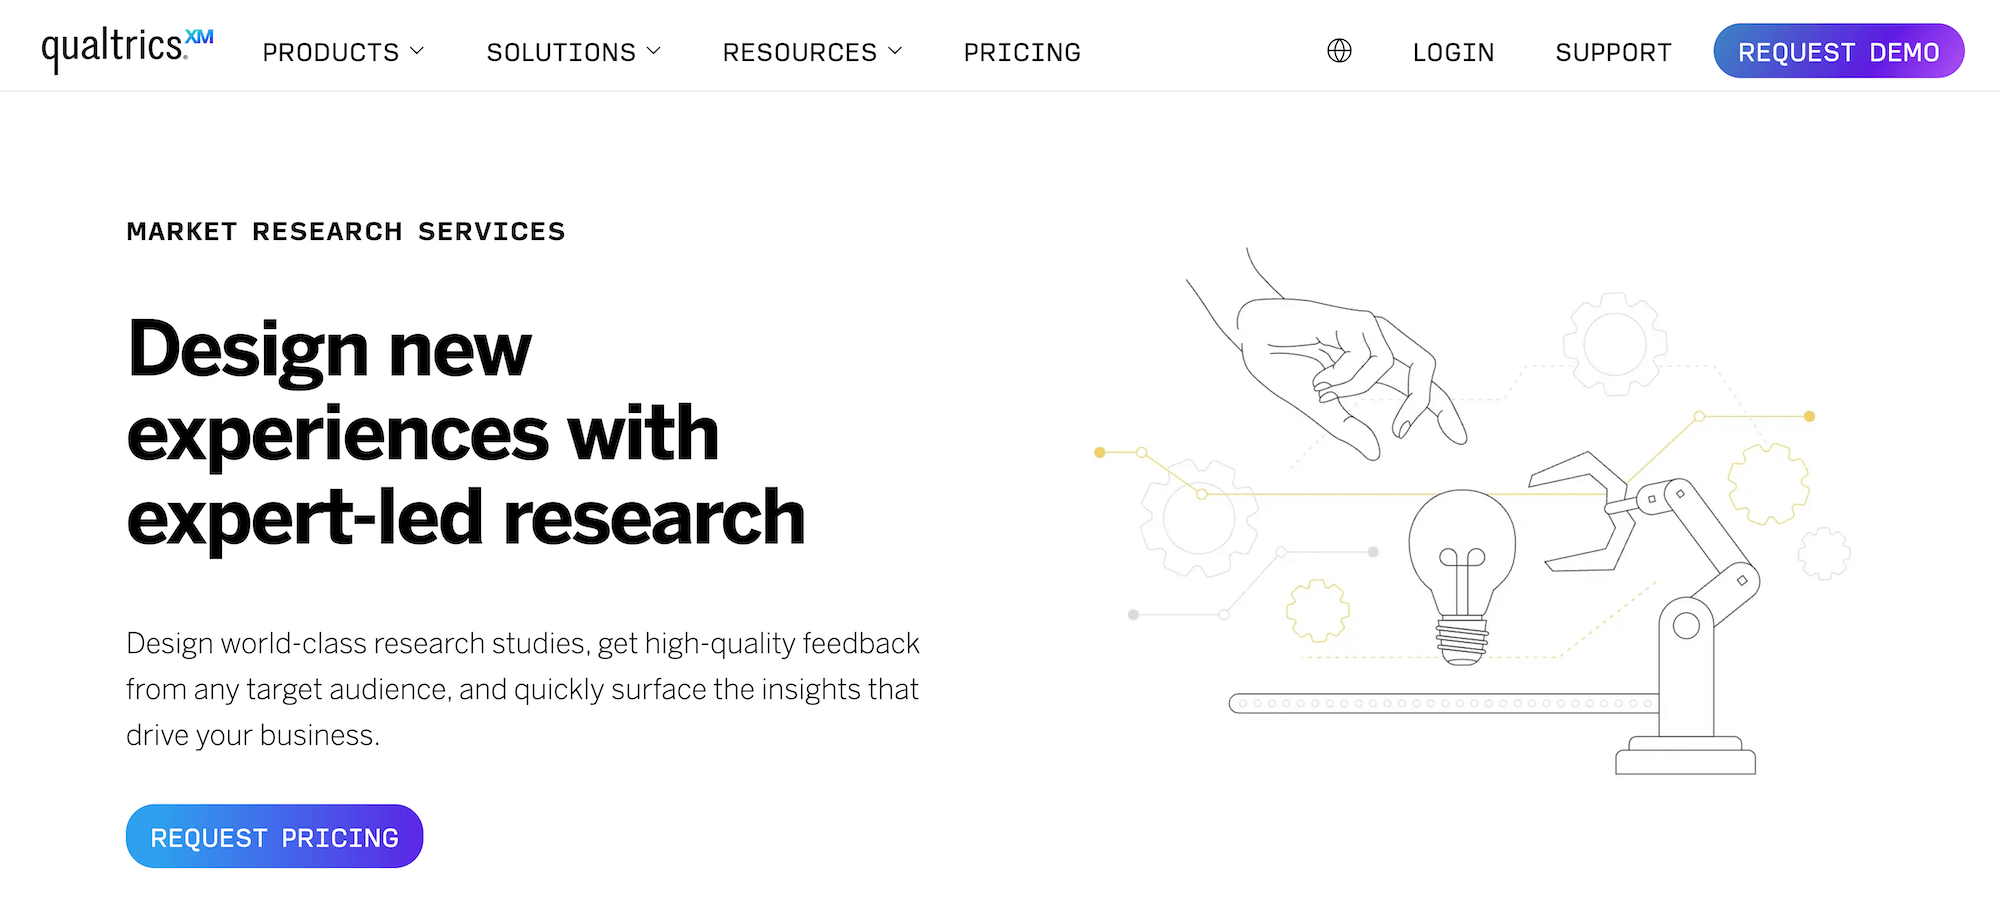
Qualtrics’ market research services can support you across multiple areas, including:
Design & Programming
- Survey methodology
- Survey design
- Programming
- Translations
Sample and Fielding
- Panel/sample recruitment
- Project Management
- List distribution
- Incentive distribution
- IHUT Studies
- Focus Groups
- Computer Moderation
Data Processing
- Data Weighting
- Open-ended Coding
- Data Cleaning
- Tabulations (stats testing)
Analysis & Reporting
- Conjoint / MaxDiff
- Regression Analysis
- Segmentation Analysis
- TURF Analysis
- Pricing Analysis
- Key Driver Analysis
- Perceptual Mapping
- Reporting
3. SurveyMonkey
SurveyMonkey's Professional Services team can support you across multiple areas, including:
- Customer Experience (CX) Services (e.g., Voice of Customer Programs)
- Survey Design and Programming
- Real-Time Survey Results
- Survey Translations
- Data-Driven Reporting (e.g., available as a one-pager, executive summary, or comprehensive full report with actionable insights for improved decision-making)
4. SG Analytics
SG Analytics’ market research services can optimize and support you across multiple areas, including:
They serve various industries, including BFSI, Capital Market, TMT, and others.
Some of their market research solutions include market segmentation, product development, UAT studies, concept testing, competitor analysis, ad effectiveness, pricing strategy, and more.
5. Kantar
Kantar specializes in serving larger enterprise organizations. They offer a variety of solutions that can help you make more informed decisions and gauge market opportunities, including:
- Custom Research Services
- Kantar's Consulting Practice
- Brand Strategy and Guidance
- Creative Testing and Optimisation
- Media Effectiveness
- Social Media Analytics
- Innovation and Product Development
- Customer Experience
- Kantar BrandZ
- Sustainability
- Shopper and Consumer Behavior
6. Ipsos
Ipsos specializes in serving larger enterprise organizations. They offer a variety of capabilities, including:
- Online Communities and Panels (comprehensive demographics coverage)
- Omnibus
- Ipsos UU - Qualitative Research
- Ipsos Synthesio
- Ipsos.Digital Platform
- Global Science Organization
- Total Operations
7. MarketResearch.com
MarketResearch.com lets you browse their in-depth market research reports and industry analysis by category:
- Consumer Goods
- Food & Beverage
- Heavy Industry
- Service Industries
- Public Sector
- Life Sciences
- Technology & Media
- Marketing & Market Research
- Reports by Country
- Company Reports
They also have other reports that provide valuable insights, which can help with benchmarking, forecasting, and more.
8. GSA
GSA's MRAS (Market Research as a Service) provides market data to federal, state, and local agencies at no cost. As they collect data, they take into account RFIs (FAR Part 10 compliant Requests for Information), sources sought, industry days, and more.
To learn more about GSA’s MRAS, see this brief introductory video.
Interested in Learning More About Prodege’s Market Research Services?
We invite you to:

6 Best Suzy Competitors & Alternatives in 2025 (Key Factors)
6 Best Suzy Competitors & Alternatives in 2025 (Key Factors)

Suzy is a popular market research platform, earning positive reviews on sites like G2. However, some users have reported challenges in certain areas:
🚫 The audience isn’t always diverse enough, making it hard to reach specific groups.
Several reviewers have mentioned that the sample can skew more heavily towards females and millennials, falling short when it comes to Gen Z, males, various ethnic groups, and other key demographics.
🚫 Some users have expressed difficulty trusting the survey data.
Without a clear understanding of where respondents come from and how they are vetted, some users have doubts about the accuracy and reliability of their survey answers.
🚫 Pricing can be restrictive for many companies.
Suzy uses a subscription-based pricing structure where costs are determined by the volume of questions asked. For many companies, a pay-per-response pricing model could be more economical and better suited to their needs compared to Suzy's approach.
🚫 Some users feel Suzy’s built-in data analysis features are limiting.
In some cases, users find themselves having to export the data to external tools like Google Sheets in order to parse it by the specific metrics they require.
Based on the above feedback and drawing from our first-hand experience helping companies transition from Suzy to our survey platform, we've put together this comprehensive overview. First, we'll present our solution, Pollfish, and then delve into other Suzy alternatives.
Best Suzy Competitors & Alternatives
1. Pollfish
Pollfish, our survey-focused DIY platform for market research, is a popular alternative to Suzy for several reasons:
✅ Diverse respondent pool for reaching broad and niche audiences.
Through our parent company, Prodege (a renowned market research giant and the largest single panel owner in the world), you'll gain access to over 100 million respondents. This vast pool allows you to target any demographic you need, whether it's specific age groups, gender, ethnicities, or other criteria. Additionally, you can target based on behavioral filters (such as products purchased, stores visited, etc.), as we'll cover in more detail.
✅ Rigorous audience quality control for reliable data.
We employ several strict processes to ensure the integrity of your survey responses. These include a thorough 30-day evaluation period for new panelists, assigning trust scores to each respondent based on the quality of their answers, among other measures. We'll provide a detailed breakdown of how these processes work. By being transparent about our audience quality control measures, we aim to give you complete confidence in the insights you gather through our platform.
✅ Transparent pay-per-response pricing model.
At Pollfish, we charge a flat fee per response, starting at $0.95 each, with discounts available for high-volume users. Our pricing is completely transparent — you can see the total cost update in real-time as you build your survey. There are no additional costs, such as subscription fees, base charges, or hidden fees, making the per-response price the only expense you'll incur. This transparency allows you to plan your research budget effectively and confidently.
✅ Advanced built-in data analysis functionality.
Effortlessly segment your data using multiple variables and create custom-branded charts and graphs, all without ever leaving Pollfish. You'll save a significant amount of time and effort by eliminating the need to export data to spreadsheets or other external tools for analysis.
Up next, we’ll explore each of these areas in more depth.
Diverse Respondent Pool for Reaching Broad and Niche Audiences
As we've mentioned, Pollfish, powered by our parent company Prodege (the world's largest single-panel owner), offers access to an exceptionally vast pool of over 100 million respondents across 125+ countries. This extensive reach ensures you can effectively target even traditionally hard-to-reach groups, such as Gen Z, males, particular ethnic groups, and others, without limitations.
What sets Pollfish apart is not just the sheer size of our respondent pool, but also the wide range of targeting options available:
❇️ Choose from 50+ targeting filters in 6 key categories: Demographics, Geographic Criteria, Consumer Lifestyle, Employment & Occupation, Behavioral Data, and Media.
For example, an outdoor equipment company might leverage Pollfish to survey males and females aged 29–44 (Millennials) and 45–60 (Gen X), who live in Seattle, have a household income exceeding $200,000, and have recently made an in-store purchase of a high-end hiking or camping product (e.g., tent, backpack, sleeping bag).
❇️ Reach your precise target audience based on specific products purchased or stores visited.
Whether you need to survey recent buyers of Ben & Jerry's or Häagen-Dazs, or frequent shoppers at Walmart or Target, and more, we can identify and target these individuals with high precision.
- What sets Pollfish apart is that we gather this information using self-uploaded receipts from our panelists, who are rewarded for their participation. By relying on actual receipt data instead of potentially misrepresented self-reported information, Pollfish ensures significantly higher data accuracy than other platforms.
- Conduct global research with ease. Reach respondents in over 160 countries and create multilingual surveys in more than 50 natively supported languages.
These are just a few examples of the extensive targeting capabilities Pollfish offers. If you have any questions about your specific audience needs, we invite you to reach out.
Rigorous Audience Quality Control for Reliable Data
At Pollfish, data quality is our top priority. We understand that even a perfectly designed survey can yield flawed results if the respondents are bots or real people providing rushed, low-quality responses. That's why we have invested significant time and effort into developing robust data quality measures that are at the core of our company's DNA.
Our commitment to data quality is what sets us apart in the industry. Here are some key aspects of our approach:
❇️ Diverse earning activities encourage optional survey participation, improving response quality.
When members join our panel communities (such as Swagbucks), they access a dashboard offering several activities to earn rewards. These options include playing games, watching content, uploading purchase receipts, and more. While surveys are another way to earn rewards, they are presented as just one more choice that members can optionally select via the dashboard.
The word "optionally" is crucial because, unlike many other providers, we don't inundate our members with constant text messages and emails urging them to complete surveys. Such an approach can lead to survey fatigue and lower-quality responses. Instead, our members can participate in surveys at their own pace and on their own terms (without feeling pressured). This fosters more thoughtful, engaged, and higher-quality answers.
❇️ Members undergo a 30-day evaluation period before they can fill out client surveys.
Before new members can participate in client surveys, they must complete a mandatory 30-day evaluation period. During this time, they fill out internal profiling surveys, and we meticulously track their response quality.
Only those who consistently provide high-quality responses are allowed to participate in client surveys. This rigorous screening process sets us apart from providers who may be short on respondents and accept most sign-ups without thorough testing.
❇️ Each member of our community has a trust score, which increases response quality.
Each community member has a trust score that directly impacts their earning opportunities. Surveys are a significant component of this score, and members are aware that we track the quality of their responses through manual and automated means. This significantly incentivizes members to provide thoughtful, high-quality answers.
❇️ We employ a range of anti-fraud measures for each survey response, including:
- Human review of text-based responses
- Unique identifiers to eliminate duplicate responses
- Technical consistency checks to ensure the respondents' carrier and targeting information align
- Carefully designed trap questions
- Minimum time limits for each question to prevent speeding
- Detection and removal of straight-lining (consistently selecting the same answer)
- Anti-VPN measures
This is just the tip of the iceberg. With Pollfish, you can confidently reach your target audience, no matter how specific or hard-to-reach they may be, while ensuring the highest level of data accuracy and quality.
Transparent Pay-per-Response Pricing Model
At Pollfish, our pay-per-response pricing model is designed to be cost-effective and give you complete control over your research costs:
❇️ No long-term commitments or minimum spend requirements.
With Pollfish, you have the flexibility to run surveys as often or as rarely as your research needs dictate. You only pay for the responses you receive, and you're not locked into long-term contracts.
❇️ Unlimited team members at no extra cost.
Your entire team can access Pollfish to create surveys, view results, and generate reports, all under a single account at no additional cost per user. There's no need to worry about individual license fees or seat restrictions. Plus, if your organization has multiple teams using Pollfish, each with their dedicated dashboard, you can effortlessly switch between them in just a few clicks.
❇️ Transparent pricing displayed as you build your survey.
As shown in the above photo, let's say you start with the base cost of $0.95 per response, and add two additional audience filters, such as:
- US household income between $75,000–$99,999.
- Type of home is a rented apartment.
Each of those filters would add $0.55 to the per-response cost. The total cost per response would now be $2.05 ($0.95 base + $0.55 + $0.55).
If you set your desired number of responses to 700, the total cost for your survey would be clearly displayed as $1,435 before you confirm your purchase.
You’ll see the full price upfront with no hidden fees or additional charges. With Pollfish, the price you see is what you pay.
Advanced Built-In Data Analysis Functionality
With Pollfish, you can effortlessly segment your survey data, hone in on specific subgroups, and create visually appealing charts in your brand's colors — all within a single, intuitive platform. There's no need to rely on external tools like Excel or Google Sheets.
❇️ Automatic Chart Generation
Pollfish intelligently generates the most appropriate chart types for each survey answer, such as bar graphs, pie charts, tables, and more. This saves you time and ensures your data is presented in a clear, easy-to-understand format.
❇️ Targeted Insights through Filtering
Use Pollfish's filtering capabilities to hone in on subsets of your data based on specific survey responses and audience attributes. For instance:
- Filter by survey responses: Isolate and examine data from respondents who provided particular answers, such as those who indicated they are "highly dissatisfied" with pricing, to understand their perspectives better.
- Filter by audience segments: Focus on specific demographic segments, like Gen Z, while excluding other age groups, to identify unique trends and preferences within that cohort.
Please note: The header in the illustration above includes the logo for Proedge, Pollfish's parent company. Proedge offers done-for-you market research services and can help with survey programming, fielding and sample, data processing, and reporting.
❇️ Multi-Variable Analysis and Visualization
With Pollfish's advanced Insights Builder, you can create compelling visualizations that incorporate several variables simultaneously, without needing external tools.
Say you want to gauge consumer attitudes toward a new streaming service. You could create one comprehensive chart showing likelihood to subscribe (variable 1), broken down by:
- Age group (variable 2)
- Household income (variable 3)
- Marital status (variable 4)
With just a few clicks, Pollfish will generate this multi-dimensional visualization, optionally with statistical significance testing to highlight key differences between groups. You can even customize the chart with your own brand colors.
❇️ Statistical Significance Testing
In testing product name concepts for a new home appliance, Pollfish might shade the "EcoSmart" name in dark green with an "A" label, while "GreenTech" appears in a lighter shade with a "B" label, showing that the EcoSmart name generates significantly higher memorability and brand affinity scores among target consumers.
❇️ Build a Presentation Deck within Pollfish
Create presentation slides directly within Pollfish, just as you would with PowerPoint, even while your survey is still actively collecting responses. This feature lets you have a nearly finalized report ready by the time your survey concludes, giving you a valuable head start. Once you've created your presentation within Pollfish, you can easily export it as a fully editable PowerPoint file (.pptx), allowing you to make any additional adjustments.
❇️ Flexible Export Options
Export your survey results and visualizations in various formats, including PDF, Excel, Crosstabs, and SPSS. (Click here for more info.).
The data analysis capabilities we've discussed are merely a fraction of what Pollfish has to offer. No matter how complex your data analysis needs may be, Pollfish is well-equipped to handle them. If you have any questions about your specific requirements, please don't hesitate to reach out.
Interested in Trying Out Pollfish?
We invite you to:
- Sign up for a free account, which you can begin using immediately to launch DIY surveys.
- Book a demo call, where our team can answer your questions and provide guidance on making the most of Pollfish.
- Inquire about our full-service market research services, where we'll collaborate to understand your unique requirements and manage the complete survey process from beginning to end. This option is ideal if you're short on time or looking for additional expertise.
2. Qualtrics
Qualtrics is a Suzy alternative that’s best known for its survey functionality. Its pricing structure is best suited for enterprise companies, and we cover what differentiates Pollfish in our post on the best Qualtrics alternatives.
Qualtrics categorizes its features into three categories:
1. Customer Experience
- Voice of Customer
- Omnichannel Experience Management
- Digital Experience Analytics
- Website & App Feedback
- Location Experience Hub
- Online Reputation Management
- Contact Center Analytics
- Quality Management & Compliance
- Agent Coaching
- Edge Instant Insights
2. Employee Experience
- Employee Engagement
- Employee Pulse
- Employee Research
- Candidate Experience Management
- Employee Onboarding & Exit
- 360 Development Feedback
- Employee Retention Analytics
- Continuous Employee Listening
3. Strategy & Research
- Strategic Market Research
- Product Research
- Brand and Communication Research
- User Experience Research
- Edge Audiences
3. Attest
Attest is another Suzy competitor that is best geared for enterprise companies. It’s a solid research solution used by marketing, insights, brand, and product teams to run end-to-end surveys.
Some of Attest’s key use cases include:
- Brand tracking
- Consumer profiling
- Market analysis
- New product development
- Multi-market research
- Creative testing
- Concept testing
- Campaign tracking
- Competitor analysis
- Quant & qual insights
- Seasonal research
4. SurveyMonkey
SurveyMonkey is an alternative to Suzy that is best suited for simpler survey needs. Some of its key survey-related features include:
- SurveyMonkey Genius for AI-powered survey creation
- Customizable survey templates
- Survey branching and skip logic
- Response quotas
- A/B testing for better decision making
- Survey branding and theme customization options
- Custom URL survey links
- Multiple survey distribution channels (email, web link, social media)
- Real-time results tracking
- Real-time insights
- Text analysis tools for open-ended responses
- Integrations with 100+ platforms
5. Alchemer
Alchemer is a Suzy competitor and a great market research tool that offers various features, including:
- Market research surveys
- Real-time, in-app customer feedback
- Brand health tracking and consumer insights
- Text sentiment analysis
It can help you make better data-driven decisions and offers solutions by industry, including Government, Education, Non-Profit, Financial Services, Food & Beverage, Retail, and Software.
6. Forsta
Forsta offers quantitative and qualitative research features for understanding consumer behavior, including:
- Market research surveys
- Panel management
- Online focus groups
- Digital diaries & communities
- Social listening
- Research automation
- Text analytics
- Voice sentiment analysis
Interested in Trying Out Pollfish?
We invite you to: