Constant Sum Question: A New Matrix Question Type to Customize Your Survey
We’re thrilled to offer researchers yet another new question type to power their surveys: the constant sum question.
This can exist as a Matrix question type on the Pollfish market research platform. As such, this is an addition to another Matrix question we offer: the Bipolar Matrix question type.
As you know, surveys are a great tool to conduct both qualitative market research and quantitative market research. But now, with this new question type, you can create questions with quantitative elements.
That’s because constant sum questions enable respondents to enter numeric data, wherein each numeric entry is summed up and displayed to the respondent.
You can use this question type for a consumer analysis, along with researching everyone in your target market: donors, students, employees, partners and more.
This article explains what a constant sum question is, its use cases, importance, how to create one on Pollfish and more.
What is a Constant Sum Question?
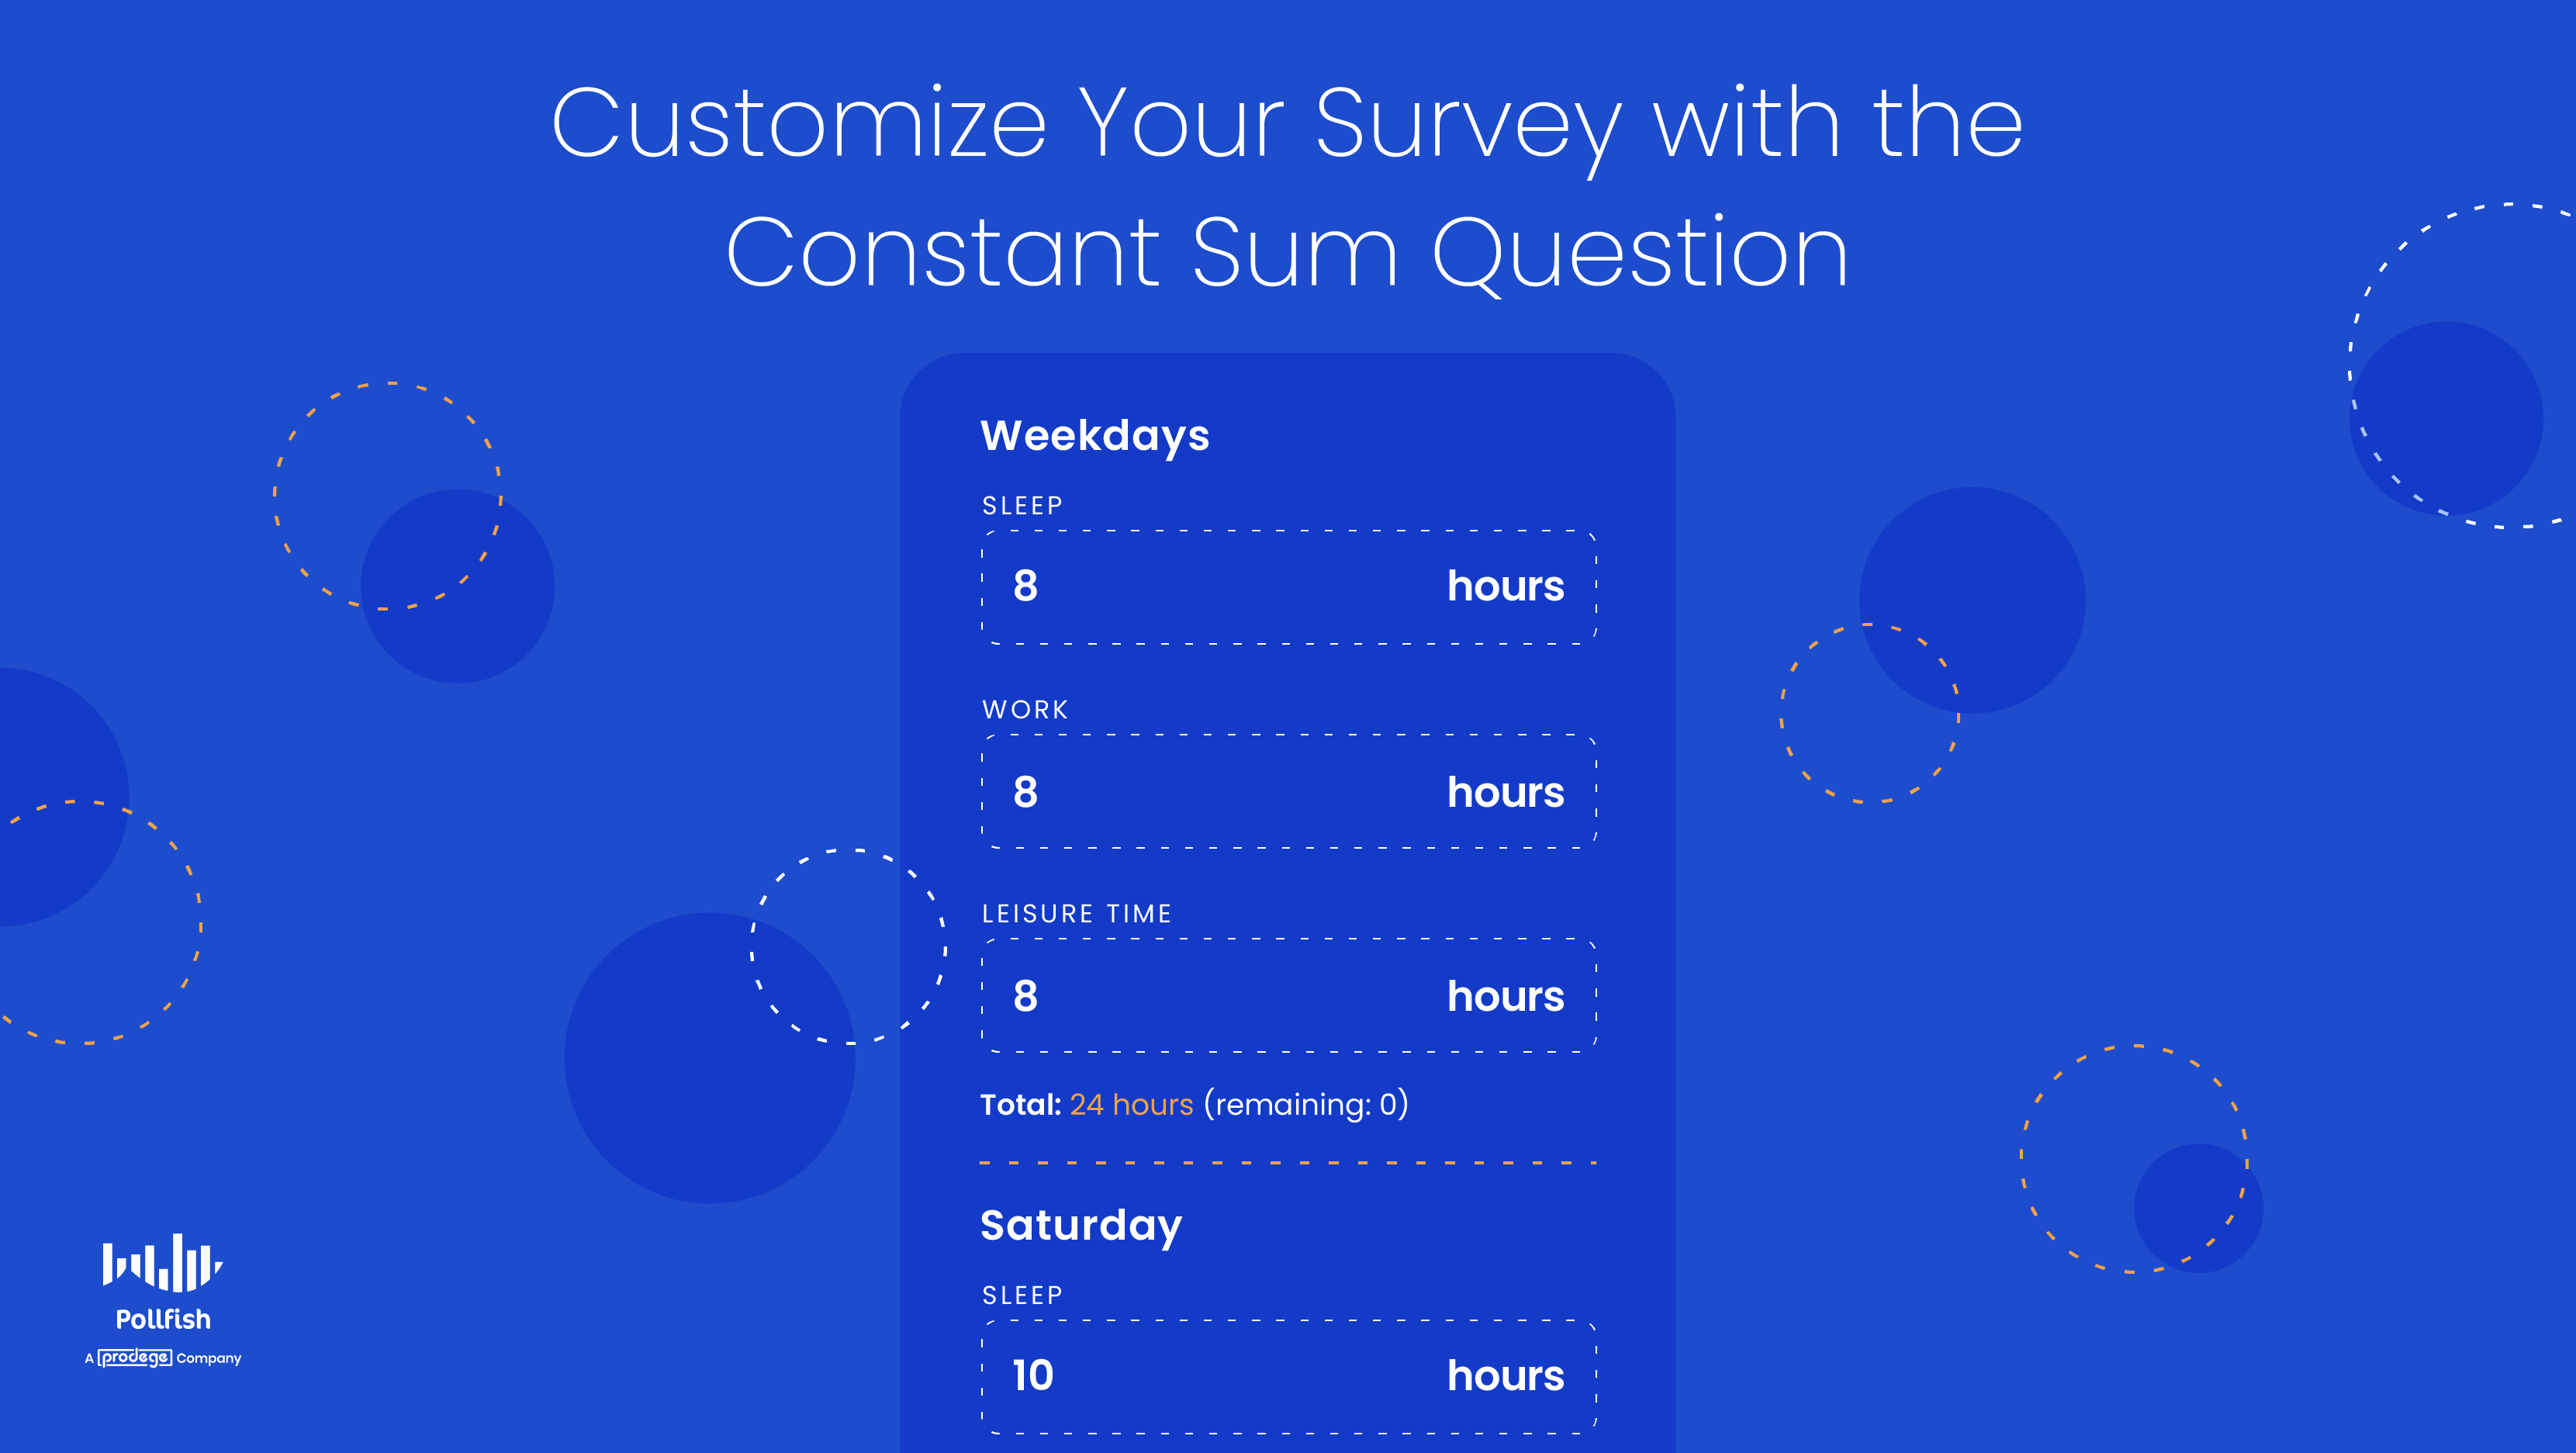
A constant sum question is used in a market research survey; it allows respondents to assign a specific number of points to all the answer options in the question.
Thus, this is a multiple-choice question, one that requires respondents to enter a numeric value for all choices per question.
The type & total of these points can be defined by the researcher while designing the survey. When these points are defined, respondents won’t be able to answer with values that exceed the maximum points allowed.
The points can take whichever unit you wish to study, such as currency, hours, frequency, etc.
This question type allows you to calculate the numerical aspects of customers’ decisions and everyday lives, allowing you to better understand their customer buying journey and virtually all else.
Let’s delve further into the usage of this question type.
Constant Sum Question Use Cases
The constant sum question type gives an understanding of how your respondents value each answer option per question.
These options revolve around a specific topic and inquiry, such as how many times within a certain time period customers buy certain products, or how they rate particular products.
Therefore, you can apply this question to a wide variety of research. The following lists key use cases of this kind of question. This is not exhaustive, as you can ask respondents to assign value to essentially all topics and issues.
- The dollar (or other currency) amount spent
- On specific items
- On certain days
- On budgets
- Amount of time
- Taking part in particular habits
- Working on a project
- Leisure time
- Taking care of responsibilities
- Percentages
- Allocating portions to various activities
- Viewpoints
- Inclinations
- Habits
- Rating systems
- Scales (1-10, etc) on products and services
- Ratings on customer service
- Easiness of a product, school or work assignments
- Ratings on overall customer satisfaction
The Importance of the Constant Sum Question
This kind of question is important for various reasons.
First off, it is useful for product research. If customers feel that certain features of a product or service are more important than others, they will allot more points to those features.
Thus, researchers will get a clear indication of the products (and product features) that customers are satisfied with and not.
Using a constant sum scale is also a great way to create differentiation within a data set. It helps you determine which factors are important and which are not for your target market sample.
They are especially helpful in cases where many factors are critical and overlap in some sense. Thus, studying many factors is no longer a hindrance: you can just create an answer option for each factor.
The respondents will assign it a point or rating so you can see the nuances of each factor, especially when it comes to how your customers feel about them.
As such, this question allows you to study multiple aspects easily, as the data this question yields is straightforward and to the point.
This question is also important in a case where you seek to get purely quantitative data. Again, this is useful when dealing with larger sets of answer options. In this case, open-ended questions and other qualitative questions won’t be useful.
Additionally, this question type is especially convenient when you don’t want to form individual questions on a specific aspect.
This would require answer choices unique to the aspect in question, whereas, in a constant sum question, you can fill in various aspects per question.
You can see the sentiments on each aspect displayed in a simple numerical format. This is useful for maintaining a shorter survey, which is a common survey best practice.
In all, this type of question provides convenience for your study and a good UX for your respondents.
Examples of the Constant Sum Question
We dove into the various use cases of this question and now we’ll walk you through specific examples.
Example 1:
Ask respondents to allocate 100 points on the expenditures of their surplus goods, AKA, non-essential items. You can create your own point system or use a currency.
Provide a list of options and ask them to assign the points in order of importance.
Let’s say they spend $20 on movies, $70 on gadgets, $10 on miscellaneous expenses. With the constant sum question, you’ll find out which groceries are the most important for the respondents, as well as which they spend the most and least on.
Example 2:
Ask respondents their views on a particular digital experience with your business. Your answer options can include emails, customer service sessions, finding what they need on your site and more.
You can customize your scale to your liking. As such, you can use points via a scale of 100, or 10. You can also use percentages, especially when talking about the time spent on each.
It would be like this: rate the time you spent on the digital experiences with our company: viewing the homepage – 30%, reading a blog post – 20%, searching for products – 40%, speaking with a support rep via chat – 10%.
They can also rate how they viewed each experience; this would require a scale of 1-10, or 100, depending on researcher preferences.
Example 3:
You can discover how well your customers know and feel about certain brands, especially useful if they are your competitors.
As such, you can ask them to rate how they feel about each brand along with how much time they’ve spent engaging with it.
This can appear as such: rate how much you’ve engaged with each brand, which can include buying from them, viewing their items, reading their content, etc.: Macy’s- 30%, Old Navy -15%, Marshalls – 45%, Burlington Coat Factory – 10%.
How to Use the Constant Sum Question on Pollfish
Creating a constant sum question on the Pollfsih platform is easy and straightforward.
For respondents, it’s as simple as allocating a certain point to each answer option. See the section above with examples of how respondents can answer the question.
For researchers, it involves implementing the question in the questionnaire section, along with adding and customizing acceptance criteria.
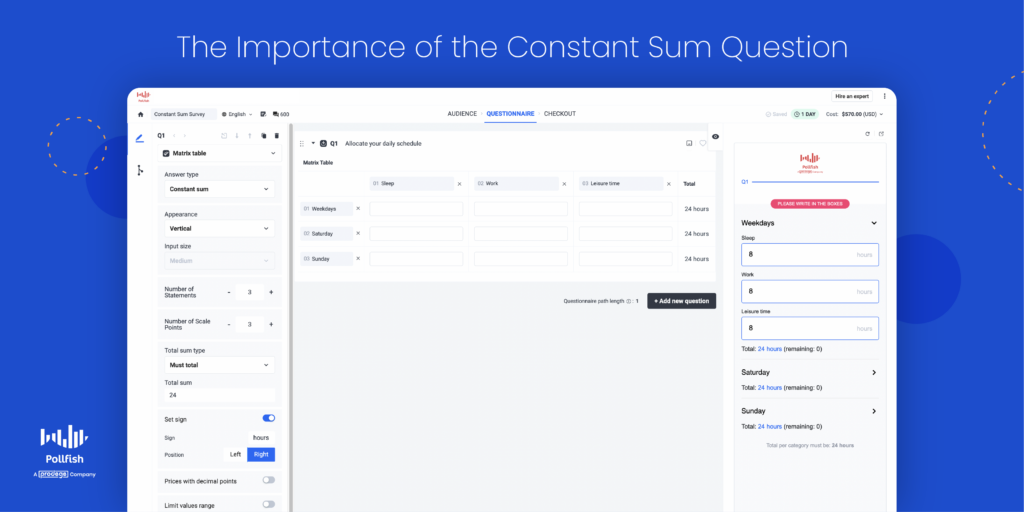
Here is how to add it to your questionnaire:
- Go to the questionnaire section of the survey after creating a new one.
- Select a Matrix question and then the Answer type: Constant Sum.
- You can lift the Must total validation and change it to Continuous Sum.
- There are 2 appearances as well.
- You can add a sign (if you seek) and select if you accept decimals or not at responses.

 Create the survey you want
The Pollfish team is constantly working to improve your survey experience, so you can expect us to continue updating and upgrading our platform with more features.
With our vast array of question types, you can form any survey and any research campaign.
Our research platform is optimized for both the respondent and the researcher. Thus, it is a win for all parties involved.
Researchers can reap a wide breadth of information on their respondents and leverage a wide pool of insights in their survey results dashboard.
Pollfish also provides artificial intelligence and machine learning to remove low-quality data and a broad range of survey and question types to customize your surveys.
In addition, there’s the advanced skip logic feature, which routes respondents to relevant follow-up questions based on their previous answers.
With a research platform containing all of these capabilities, you’ll be able to set up any survey you want, study any group based on demographics and psychographics alike and reap high-quality data.