How to Benefit from Pollfish A/B Test Results & Exports
There are various ways researchers can benefit from Pollfish A/B test results and exports, as the Pollfish platform supports different A/B testing capabilities. These include both monadic A/B testing and sequential A/B testing.
At Pollfish, we’re thrilled to offer product features that exist outside the span of surveys alone, allowing our platform to deliver a truly all-encompassing market research experience. As you know, there are all kinds of market research techniques, which include both primary and secondary market research.
You can form primary market research campaigns via surveying your target market, or by creating A/B tests on any topic of your choice, whether it is for an ad campaign or product development.
It is therefore no surprise that 77% of companies use A/B testing on their website and 71% of companies do so monthly.
This article explains how to use and benefit from A/B testing results and exports on the Pollfish platform.
A/B Testing Results Dashboard
Both the Monadic and Sequential A/B testing results are displayed in separate blocks in the Pollfish dashboard. There, researchers can preview the contents of each A/B testing campaign.
You can use concept shortcuts to filter the results page, isolating the concepts’ audience, along with the question information you seek. While navigating down the questions included in the A/B test, the concept shortcuts remain sticky so that you can access their content easily.
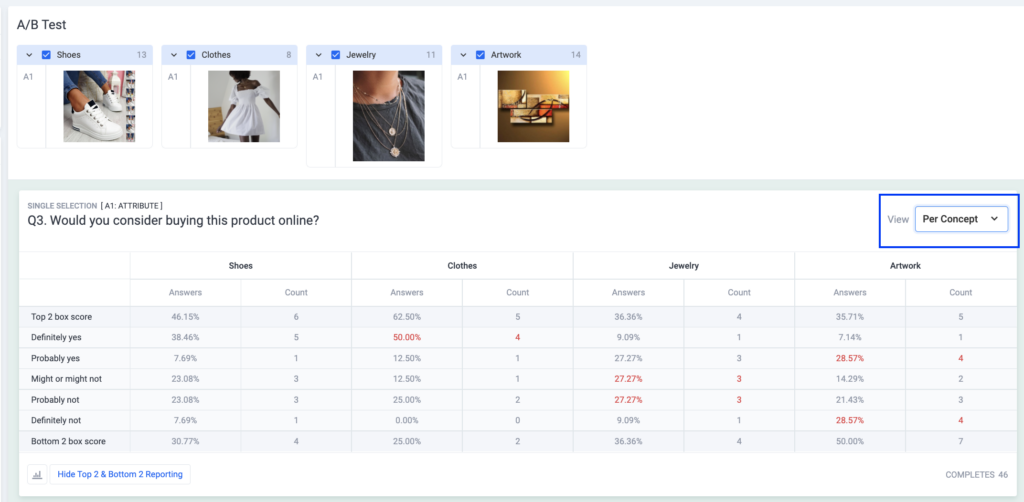
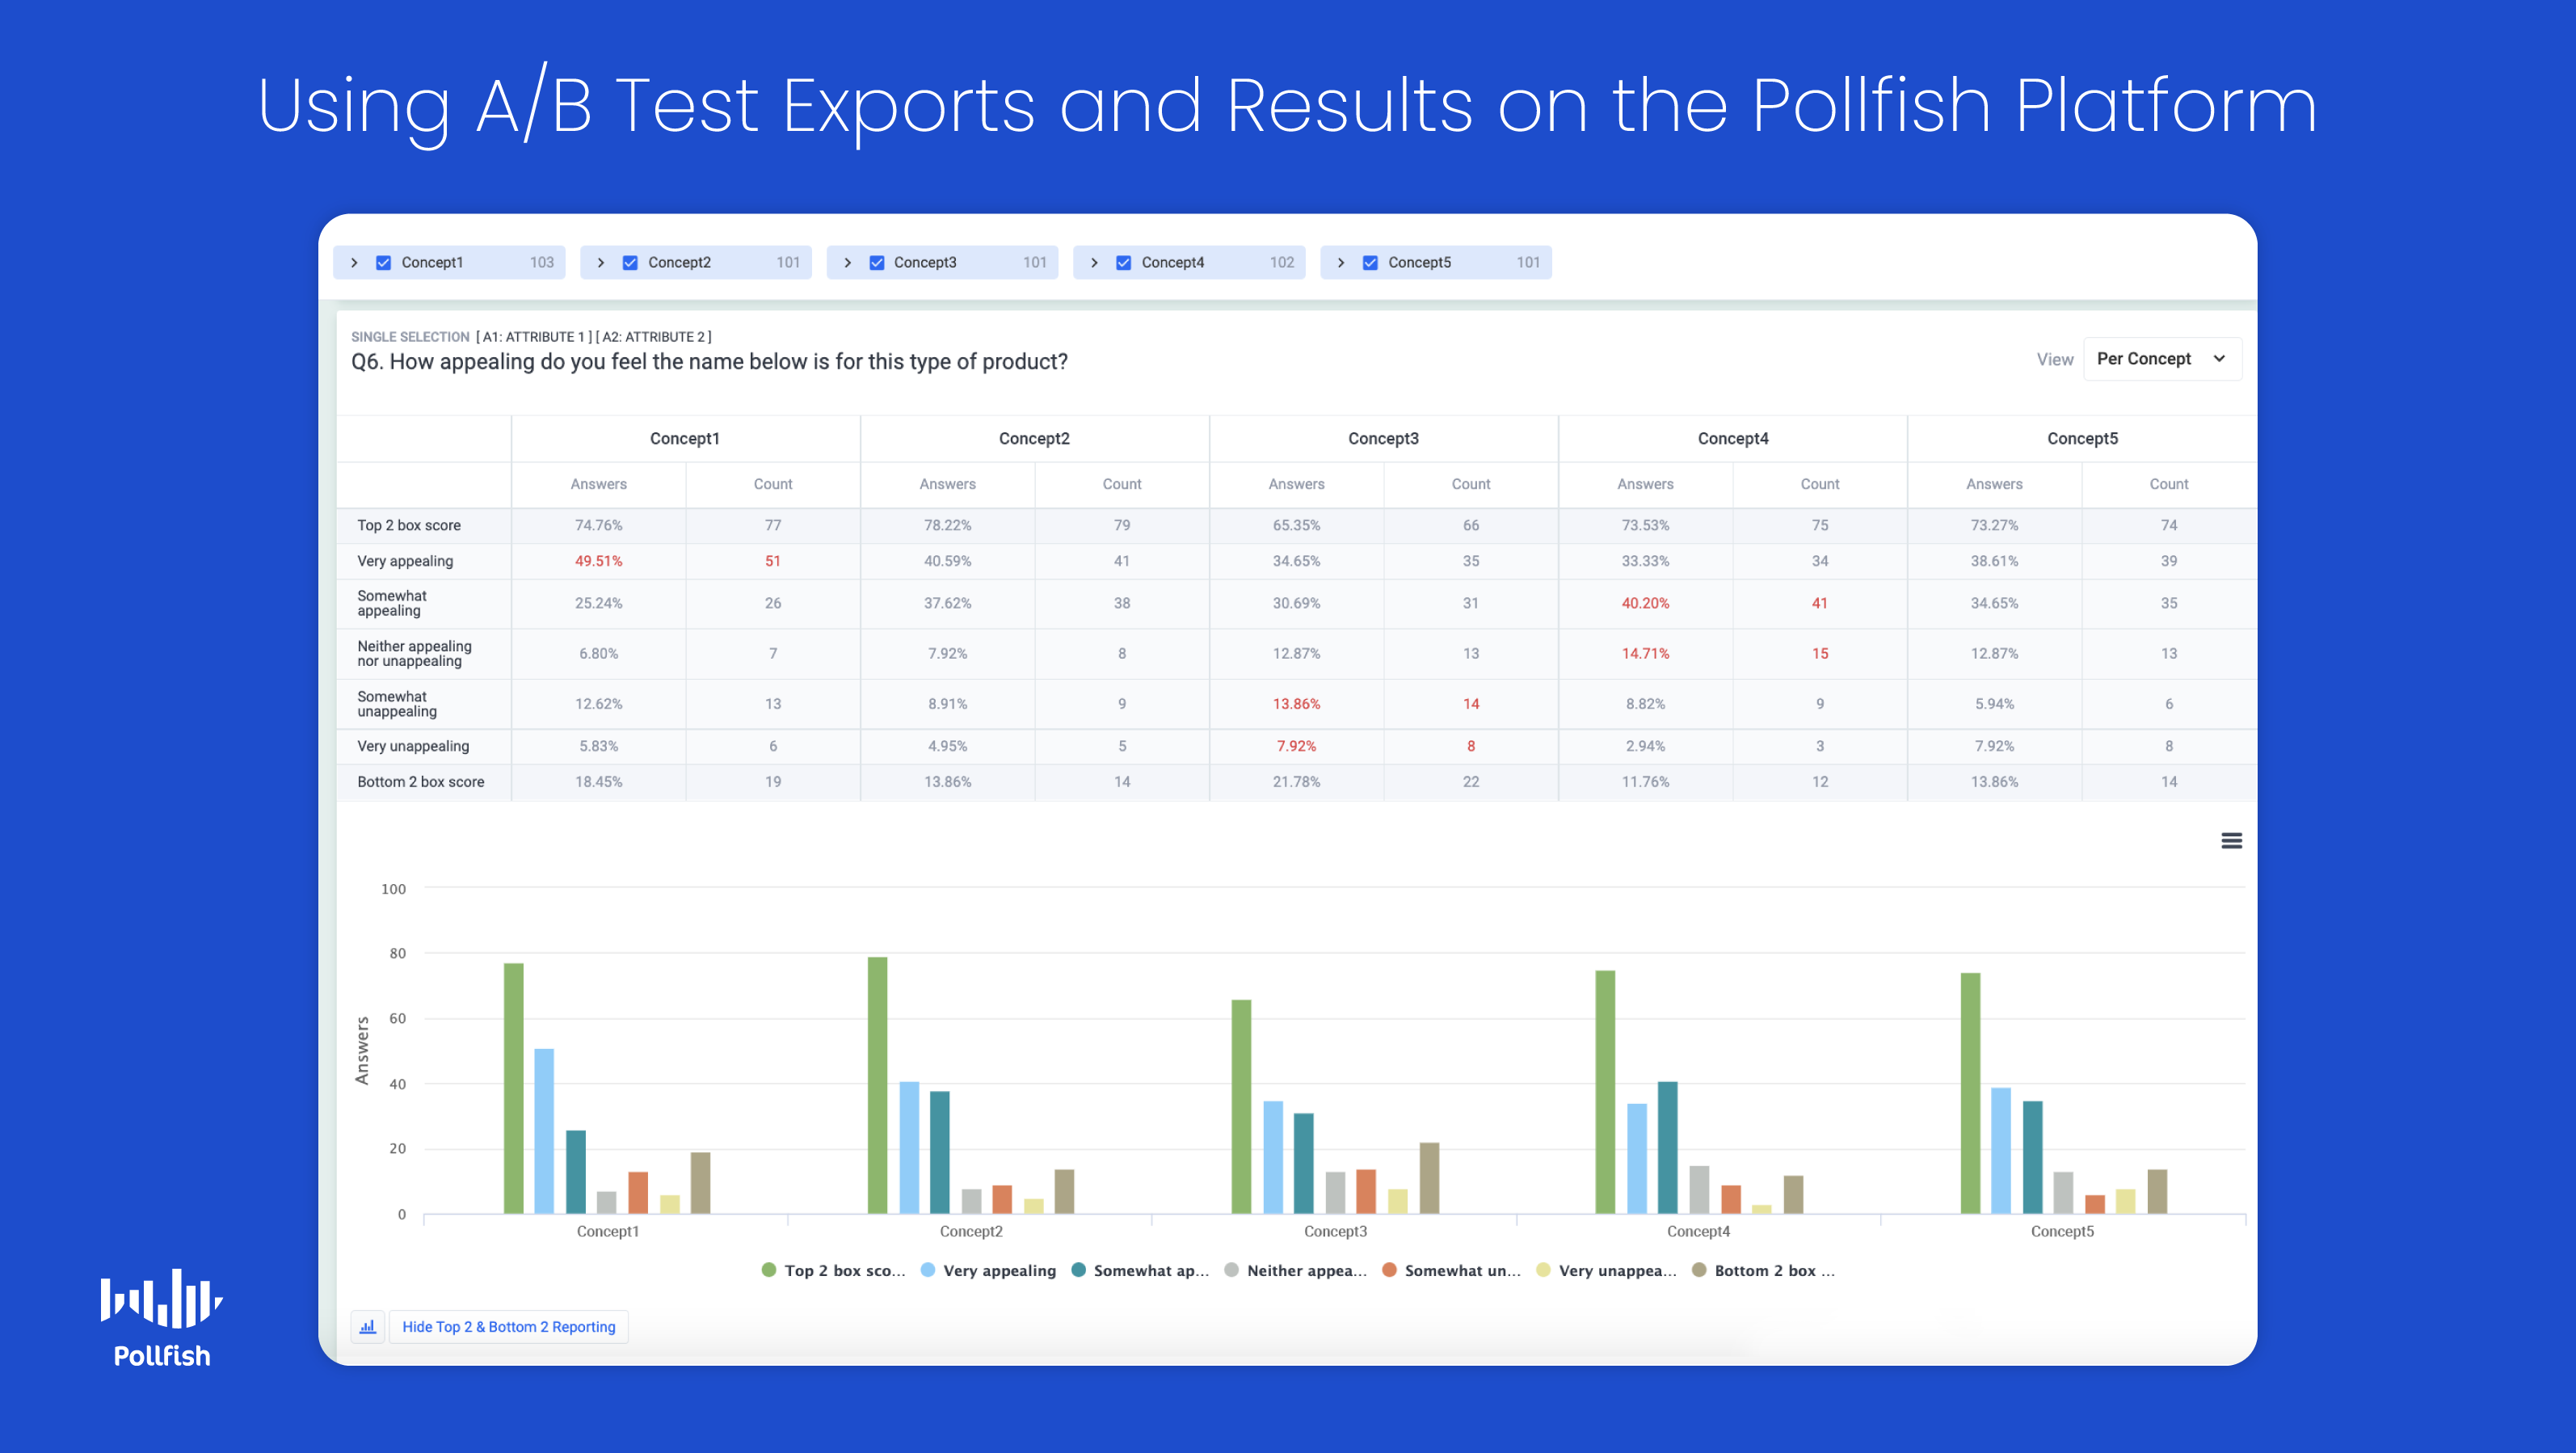
Each question included in a Monadic or Sequential A/B test is presented with concept attributes that accompany the question. You can switch the view of the question results, between concept-focused or answer-focused tables, wherever applicable.
To assist you in simplifying the results of Likert scale questions, our report comes from the Top 2 Box score and Bottom 2 Box scores, which are at the Single selection and Matrix Single selection questions. These are in both the tables and the charts.
The Top 2 Box score is the sum of the number of responses that originate from the first two answers, whereas the Bottom 2 Box score is the sum of the number of responses that are derived from the last 2 answers.
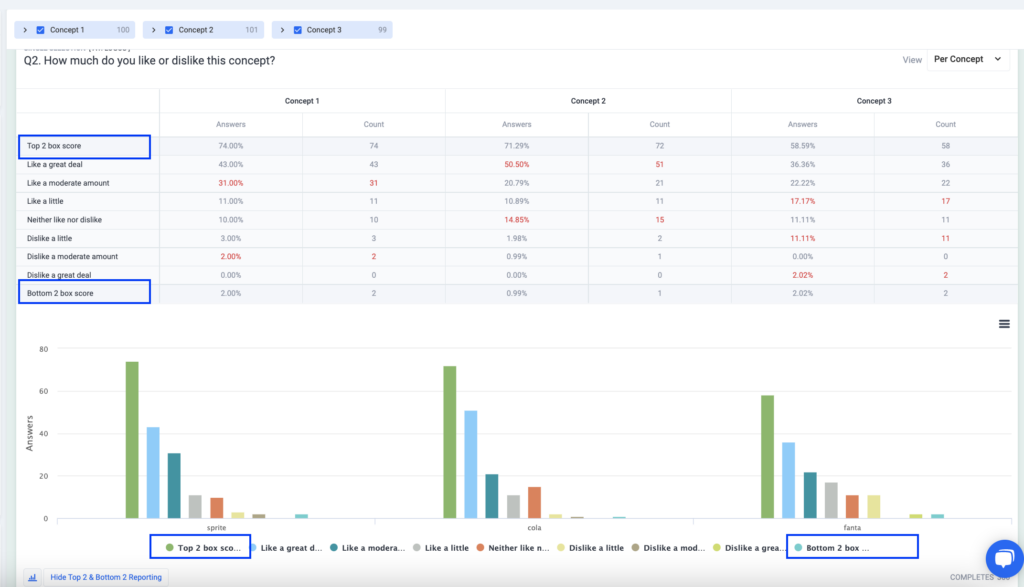
Slider and numeric open-ended questions are presented with a box plot diagram, per concept.
A boxplot is a standardized way of displaying the distribution of data based on a five-number summary (“minimum”, first quartile (Q1), median, third quartile (Q3), and “maximum”). It shows you about your outliers and what their values are.
It can also reveal if your data is symmetrical, how tightly your data is grouped, along with if and how your data is skewed.

A/B Testing Exports
All A/B test exports come through with concepts’ information.
Concept information is included in the form of PDF, Excel, CSV and SPSS exports. In the near future, Pollfish will include concepts in an export of Crosstabs.
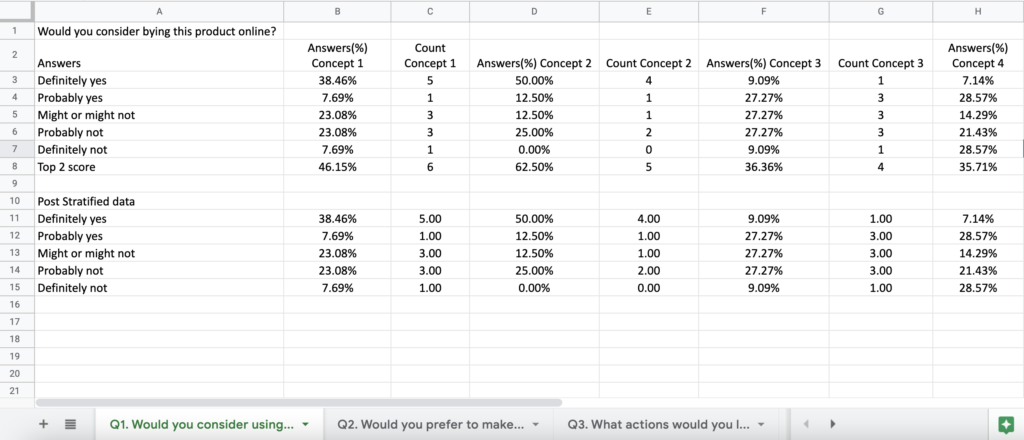
Recently, Pollfish has added a new type of Excel export, the Comparison export, in which you can view and compare statistics on different questions for all the concepts side by side. This file is available once the A/B test gets completed, and is offered with post stratified data if applicable.
The Top 2 Box score is also available in the exports section for Single and Matrix Single selection questions.
If you have an Elite plan and use a BQ integration, you will receive the concepts’ information for each response, from the data you export.
Driving the Best A/B Testing Campaigns
A/B testing campaigns help drive the success of all kinds of business campaigns, whether they are product, ad, or topically focused. In order to reap the benefits of A/B tests, you’ll need a platform that offers optimal A/B test exports and results.
You’ll also need to refer to other considerations when choosing a strong online market research platform. These include selecting a top-tier mobile-first platform, as the mobile space continues to dominate and no one wants to participate in research campaigns on a poorly constructed mobile environment.
Your market research platform should also offer artificial intelligence and machine learning to disqualify low-quality data and offer a broad range of survey and question types.
Additionally, it should also allow you to reach anyone. As such, you’ll need a platform with a reach to millions of consumers, along with one that offers the Distribution Link feature. This feature will allow you to send your survey to specific consumers, instead of solely deploying them across a vast network.
With a market research platform that offers all of these offerings, you’ll be able to continuously measure and improve on a wide variety of business campaigns, including sales and marketing and beyond.