
How to Leverage Data from Conjoint Analysis Exports
How to Leverage Data from Conjoint Analysis Exports

Let’s take another critical dive into conjoint analysis, a super informative market research feature that we released last year.
As you know, a Conjoint Analysis is a kind of tool and research technique that enables you to measure the value that consumers place on the individual features of a product or service.
This kind of analysis is particularly beneficial for product and pricing research, as it unveils a plethora of consumer preferences. You can then use this information to optimize your products and services.
In this article, we specifically focus on Conjoint Analysis exports on the Pollfish platform.
The Polfish market research platform generates optimized Excel, CSV and SPSS files that contain raw data, which you can use to form your own analyses and import the data from the tool to other software.
If you want to run your own Conjoint Analysis to compute and understand part-worth importance, you’ll need to use its export, as it contains raw data from your Conjoint Analysis.
This article teaches you how to do so.
1. How does Pollfish generate the Conjoint Analysis design?
The conceptual model of a conjoint analysis is pretty straightforward; it suggests that the utility of a multi-attributed product can be broken down into specific contributions of each attribute and their interactions.
The approach is easy to implement if the number of attributes is small. However, problems arise because of the large number of possible hypothetical alternatives for a given product.
For practical reasons, only a subset of possible alternatives is chosen for the study. To that end, experimental design methods exist for selecting good subsets of product configurations for performing the analysis.
Respondents will see a subset of possible options to choose from, which depends on the number of attributes and levels defined.
In order to do this, the Pollfish Conjoint algorithm first creates an orthogonal design of the alternatives (product bundles) that are formed by combining the levels of the attributes.
In the case that all possible combinations are more than 20, the total number of alternatives gets reduced using d and g optimality criteria.
Then choice sets are created, containing an upper limit of 5 alternatives each. The algorithms that we are using ensure the d-optimality of the choice-set design.
Finally, choice sets are assigned to blocks. One block cannot contain more than 30 choice sets.
The goal for our Pollfish Conjoint algorithm is to ensure that each level in each attribute appears the same number of times and that each alternative appears the same number of times in the design, so that the results have 0 bias and variance.
Each respondent gets assigned to only one block randomly. Blocks are distributed evenly to the audience, so that every choice set in the design is seen by the same number of respondents.
2. How is the Conjoint Analysis design distributed? Via the Pollfish algorithm based on Block Designs
A problem that usually arises when the choice-set design is ready to be administered to a target population is that the number of choice sets in the design may be too large for an individual to assess.
In these cases, a common technique is to partition the choice sets into blocks of equal size, in principle much smaller than the size of the original design, and then administer the blocks to the population.
That way, each individual would have to assess only the choice sets of one block, while collectively the population would assess all the choice sets of interest. However, in order for this partitioning to make sense, some constraints must be satisfied.
Each choice set should be evaluated by the same number of users. That means that each choice set should appear the same number of times into the blocks. Note that it is not necessary for a choice set to appear in all blocks. To that end, we may need to replicate the choice sets in order to always be able to divide them into blocks.
Formally speaking, the following equation should be satisfied: vr=bk
where v is the number of choice sets, and r is the replication factor of each choice set, is the number of blocks and is the size of each block, that is, how many choice sets each individual should see. Thus, given a choice-set design of size, we have to find the three smallest numbers () satisfying the above equality. Given these numbers, we can safely partition choice sets into blocks.
3. Understanding the Excel structure
The Excel (CSV and SPSS) file is a complementary feature of the visualized results at the Pollfish dashboard. It contains all responses given by each respondent of the survey. Graphs on the results page are based on these individuals' responses.
To take advantage of the Excel for a Conjoint Analysis or MaxDiff Analysis survey, visit the results page of a completed one, select “Export results” and choose “Excel” as your export option. You will be sent an email that notifies you when your export is complete. Open the document in Excel or Google Sheets to get started.
The Excel sheet will include the following two (among the other tabs):
- Experimental design tab: This tab contains the Conjoint or MaxDiff’s design, as generated by the Pollfish Conjoint algorithm.
- Individuals tab: This tab contains the selections given to the questions of the survey by each respondent.
For the case of the CSV and the SPSS, the experimental design comes in a separate file.

A. The Εxperimental Design Tab
Let’s assume that we have a Conjoint Analysis survey with the following attributes and levels, describing alternatives of detergents:

In the Excel tab, each component is listed in a column and has a unique ID. Blocks, their containing choice sets and alternatives(or “Concepts”) have their own IDs, as the following screen depicts.

For the specific example, the Pollfish algorithm will generate a design of 4 blocks of 5 choice sets each.


Each choice set contains 5 alternatives (or “Concepts”). Each row represents a generated alternative (or “Concept”), whose containing attribute levels’ columns are located after the “Concept” column (in our example of detergents Conjoint test, the attributes were 4: Type, Perfume, Quantity and Price).

The settings for the number of choice sets and the number of alternatives, are also displayed in the questionnaire while preparing the Conjoint survey:

B. Conjoint selections at the Individuals tab
Each respondent gets only one of the generated blocks. The blocks are evenly distributed across the sample, hence, a block may be received from many respondents.
In our example, from the 120 total sample, each group of 30 respondents will get one of the 4 blocks:
- 30 respondents receive the block with ID 257
- 30 respondents receive the block with ID 258
- 30 respondents receive the block with ID 259
- And 30 respondents receive the block with ID 260
At the Individuals tab, each row represents the responses given to the questions by a single respondent. Data related to the Conjoint Analysis are placed among the other questions contained in the survey and start with the column named “Block” which holds the block ID the respondent received.
Then the choice-set ID columns follow along with the selected alternative (or Concept) ID columns. The choice-set columns are ordered according to the order the respondent received them.
So, ChoiceSet0 ID holds the first choice-set ID the respondent got. Selected Concept 0 ID holds the respondent’s selected alternative ID(or Concept) in the first choice set and so forth until selections for all choice sets are provided in the tab.

C. Correlate the data at both tabs for further analysis
You do so by combining the following:
- the data from the Experimental design tab, which holds the content for each block and their included choice-sets
- the data from the Individuals tab, which hold the selections per respondent
You can then proceed by then analyzing the data in a different system.

How to Analyze the Conjoint Analysis Feature on the Pollfish Platform
How to Analyze the Conjoint Analysis Feature on the Pollfish Platform

We covered the critical question of what is conjoint analysis, explaining its utility, especially in the product development and customer development space. A previous article has also discussed how to build a Conjoint Analysis survey on the Pollfsh online survey platform.
With those insights in mind, it’s crucial to learn how to analyze the Conjoint Analysis feature, which is choice-based on the Polfish platform. You can do so by familiarizing yourself with its different data visualizations, which adequately provide data for decision making.
This article expounds on how to analyze a conjoint analysis feature on the Pollfish market research platform.
Generating Insights from the Conjoint Analysis in Your Dashboard
You can easily generate the insights you’ll need to understand your conjoint analysis in the Pollfish dashboard. To access this feature, simply visit your survey results page and remain on the Conjoint Analysis block. No visualizations will appear until you have collected four responses.
In the Conjoint Analysis block, you will see three graphs: the Attribute importance chart, the Level Utilities chart and the Distribution of Level Preferences chart and a Ranked list of product alternatives as preferred by customers.
Check out this preview of the results page:
https://www.loom.com/share/745f0240ef1c4b879c6e9bc5db6db3a7
The Attribute Relative Importance Graph
This graph displays the influence an attribute has when the respondent selects their preferred alternative. The higher the percentage, the more influential it is in the decision-making process of the potential consumers.
Assuming a survey with 3 attributes tested and None of the above options enabled, the Brand is the most influential attribute relative to the Colour and Price which is the least influential attribute (as displayed below).
This chart shows how strongly the variations of attributes affect customers' choice, but only for the levels that you chose in the design.

Level Utilities
This allows you to dive deeper to understand what specific levels within an attribute drive customers' choice. Each graph displays the measurement of preference for the levels of an attribute. Level utilities are calculated based on the average preference scores for each level. The higher the percentage, the higher the influence of the level at the customer's decision to select a product alternative.


Distribution of Level Preferences Graph
This visualization displays the measurement of the probability that a level would be selected over another, if all other attributes were held constant. The higher the percentage a level has, the higher it was preferred within the levels of the attribute by respondents.

Willingness to pay
Willingness to pay is the maximum price a customer is willing to pay for a product or service (ie. how much users are ready to pay for an upgrade from level A to level B, in addition to the price they are already paying now).
Each attribute has its own chart, where values represent monetary values. By using the chart and selecting a different baseline level, you can compare how much respondents are willing to pay for an upgrade or a downgrade to another level.
Willingness to pay is a chart available only for Conjoint surveys containing an attribute of Price type.
In the example below, the baseline level for “Perfume” attribute is set to “Floral”. From the graph, we can understand that users are willing to pay $2.05 more for “Lavender”, whereas for the “Green Citrus” they are willing to pay $0.77 less than for “Floral”.

You can change the baseline level for the specific attribute to “Ocean” to compare how this performs against the other levels, by clicking on the relevant bar. This will convert “Ocean” to the baseline level, where we can see that users are willing to pay more only for the “Free of perfume”, whereas for all other levels of “Perfume” they are willing to pay less than they would for “Floral”.

Ranked List of Product Alternatives
This table displays how the product alternatives are ranked, based on the level utilities. The first ones are the most preferred among the respondents.

You can apply the results of the Conjoint Analysis feature through filters. Just use the filters with the selected demographic criteria and to the rest of the demographics gathered.
The information in the graphs gets recalculated to provide insights only for the filtered audience, as long as there are at least four remaining responses. Post-stratification is not available on the Conjoint Analysis feature.


What is Conjoint Analysis and Why It’s Crucial for Market Research
What is Conjoint Analysis and Why It’s Crucial for Market Research
Let’s dive into the market research method called "conjoint analysis," as the Pollfish platform continues expanding its features and capabilities. This is excellent news for researchers, given that they can now apply the conjoint analysis research approach in different survey research endeavors.
One of many market research techniques, this new feature allows researchers to measure the value that consumers place on various aspects of a product or service. By studying how your customers perceive the makeup of your offerings, you’ll understand the distinct advantages and shortcomings within their features.
In addition, by applying this research method, you can uncover your consumer preferences to better innovate, design and price your product or service. That’s because conjoint analysis allows you to understand how consumers make complex choices in real-world scenarios.
This article explains what is conjoint analysis, how it can be applied, its benefits and how to use the conjoint analysis feature in the Pollfish platform. While this research method comes in different varieties, this piece focuses on choice-based conjoint analysis.
What is Conjoint Analysis
Conjoint analysis is a kind of quantitative market research for measuring the value that consumers place on the features of a product or service. A survey-based research method, this commonly used approach merges real-life situations and statistical techniques to understand market decisions.
A kind of statistical analysis, this method helps businesses understand how customers evaluate both components and features of their products and services. This method is based on the principle that any commodity can be broken down into a set of attributes, each of which impacts how users perceive the value of an offering.
Conjoint analysis is especially useful for product and pricing research, as it unearths a wealth of consumer preferences and leverages that information to optimize the products and services in question.
It does so by allowing researchers to make important business decisions concerning their products and services, such as the following:
- Select product features
- Assess consumers’ sensitivity to price
- Forecast market shares
- Understand the demand for certain features or components
- Predict the adoption of new products or services
The conjoint analysis method breaks a product or service down by its various components; these are called attributes and levels. Researchers can test different combinations of the components to identify consumer preferences.
The objective of conjoint analysis is to conclude what combination of a limited number of attributes is most influential on respondents’ choice or decision making. A controlled set of products or services is shown to respondents.
Then, researchers analyze how the respondents make choices from these products, which allows them to determine the implicit valuation of the individual components making up the product or service.
These implicit valuations (utilities or part-worths) can be used to create market models for estimating market share, revenue and even profitability of new product designs.
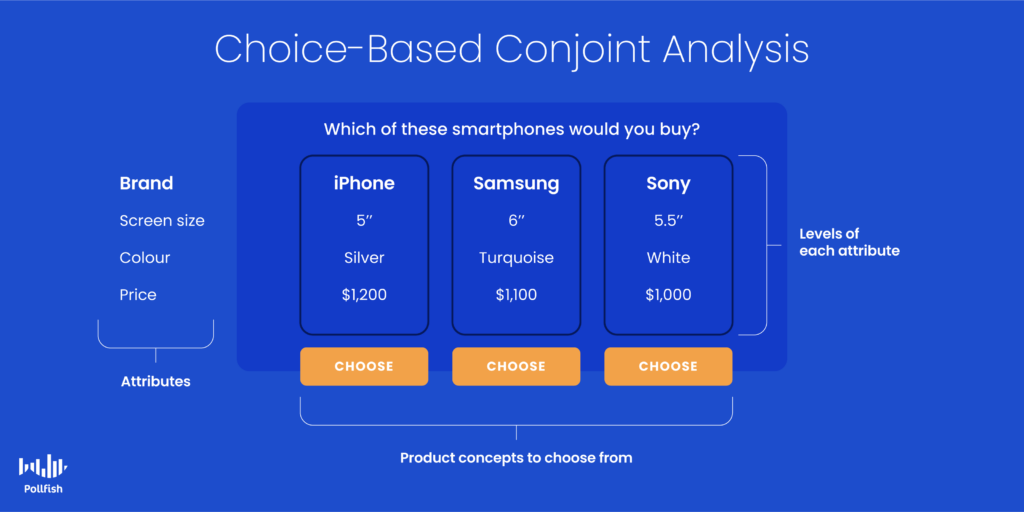
Choice-Based Conjoint Analysis
Currently, Pollfish is offering choice-based conjoint analysis in our online survey platform. You can add this popular form of research to an Elite account.
Other types of conjoint analysis involve asking respondents to rate or rank items. Asking responders to choose a product to buy provides insights specifically on whether they would buy it or not.
As such, choice-based conjoint analysis may be more useful for campaigns that seek to uncover consumer buying preferences, in regard to specific products. The insight you gain can also be used to predict whether consumers will buy from a competitor.
This is how choice-based conjoint analysis works:
Survey respondents are shown a series of options and asked to select the one they are most likely to purchase or use.
A respondent will see alternatives included in choice sets that are repeated.
The Importance of Conjoint Analysis
This kind of analysis is important for a variety of reasons.
First off, its main purpose enables researchers to understand which product or service features their customers prefer over others. As such, you’ll understand the main contributors behind consumer purchasing decisions, as well as the most off-putting attributes that prevent them from buying.
With this information in tow, you can make more informed decisions about pricing, product development, sales and marketing activities. You will be able to optimize your product, its promotional activities, accentuating the proper features and more. You’ll also be made aware of the attributes that repel consumers, which is essential for optimization.
By optimizing your product, its pricing and the marketing activities surrounding it, you’ll increase revenue, foster repeat purchases and strengthen consumer loyalty. All of these outcomes are highly sought-after and necessary for the success of your business.
Conjoint analysis offers the convenience of being able to break down utility to consumers at individual levels, as well as to aggregate all of their responses.
This analysis can also be employed as an exclusive focus on product features and attributes regardless of price or brand name. This allows you to enable the calculation of utility on an individual basis and in regard to specific features that you intend to evaluate.
It can also be used to measure the value of brands in comparison to competing brands, thereby measuring the brand equity of each brand. The information you reap shows you how strong a particular brand is in comparison to a specific product or price.
Consequently, it helps businesses make decisions based on their own brand value in their market. This is important, as having a popular brand is not always enough, as price fluctuations and new features could impact demand.
This research technique also offers straightforward experimentation with varying factors, such as price, capabilities, color and other attributes. As such, it allows you to create a product profile, which you can change to form additional profiles for varying attributes. This is key to do before launching a new product.
Conjoint analysis is also important, as it can be used across different industries for virtually all types of products and services, such as consumer goods, electrical items, insurance plans, housing, luxury goods, and travel.
As a result, you can apply it to different instances if you seek to discover what type of product consumers are most likely to buy, along with what they appreciate the most — and least, about a product. Aside from marketing and advertising campaigns, this is also useful for product management.
Businesses of all sizes can benefit from conducting conjoint analysis, including local establishments, such as grocery stores and restaurants. More importantly, the scope of this kind of analysis is not limited to profit motives only. This means charities and educational institutions can also benefit from conjoint analysis, such as for using it to determine donor preferences.
All in all, conjoint analysis is essential for examining how consumers and other respondents rate and perceive the attributes of a product, service or experience.
Optimizing Product Campaigns and Beyond
Performing a conjoint analysis is critical for optimizing your product and concept campaigns. All brands should conduct it at multiple stages of your product’s life cycle. Conjoint analyses can break down a large number of attributes into smaller bundles for evaluations and comparisons.
As such, you should opt for a strong online survey platform to easily create and deploy conjoint analysis to your target population.
You should use a mobile-first platform since mobile dominates the digital space and no one wants to take surveys in a mobile environment that’s not adept for mobile devices.
Your online survey platform should also offer artificial intelligence and machine learning to remove low-quality data, disqualify low-quality data and offer a broad range of survey and question types.
The survey platform should offer advanced skip logic to route respondents to relevant follow-up questions based on their previous answers.
It should also allow you to survey any employee. As such, you’ll need a platform with a reach to millions of users, along with one that offers the Distribution Link feature. This feature will allow you to send your survey to specific respondents, instead of only deploying them across a vast network.
With an online survey platform with all of these capabilities, you’ll be able to set up an insightful conjoint analysis and understand your consumer, or other key actors’ preferences.

How to Build a Conjoint Analysis Survey on the Pollfish Platform
How to Build a Conjoint Analysis Survey on the Pollfish Platform

We explained what is Conjoint Analysis in a recent article, which includes the purpose of such an analysis, how it exists in the Pollfish platform, its importance in market research, particularly in product development and more.
In the Pollfish online survey platform, we offer a choice-based conjoint analysis, which works differently than ranking and rating items. Instead, the choice-based version asks respondents specifically if they would buy a certain product or not.
As such, this version shows survey respondents a series of options and asks them to select the one they are most likely to purchase or use.
The respondent will see alternatives included in choice sets that are repeated. Let’s learn how to use the Conjoint Analysis tool on Pollfish
This article guides you through the process of building a conjoint analysis on the Pollfish platform.
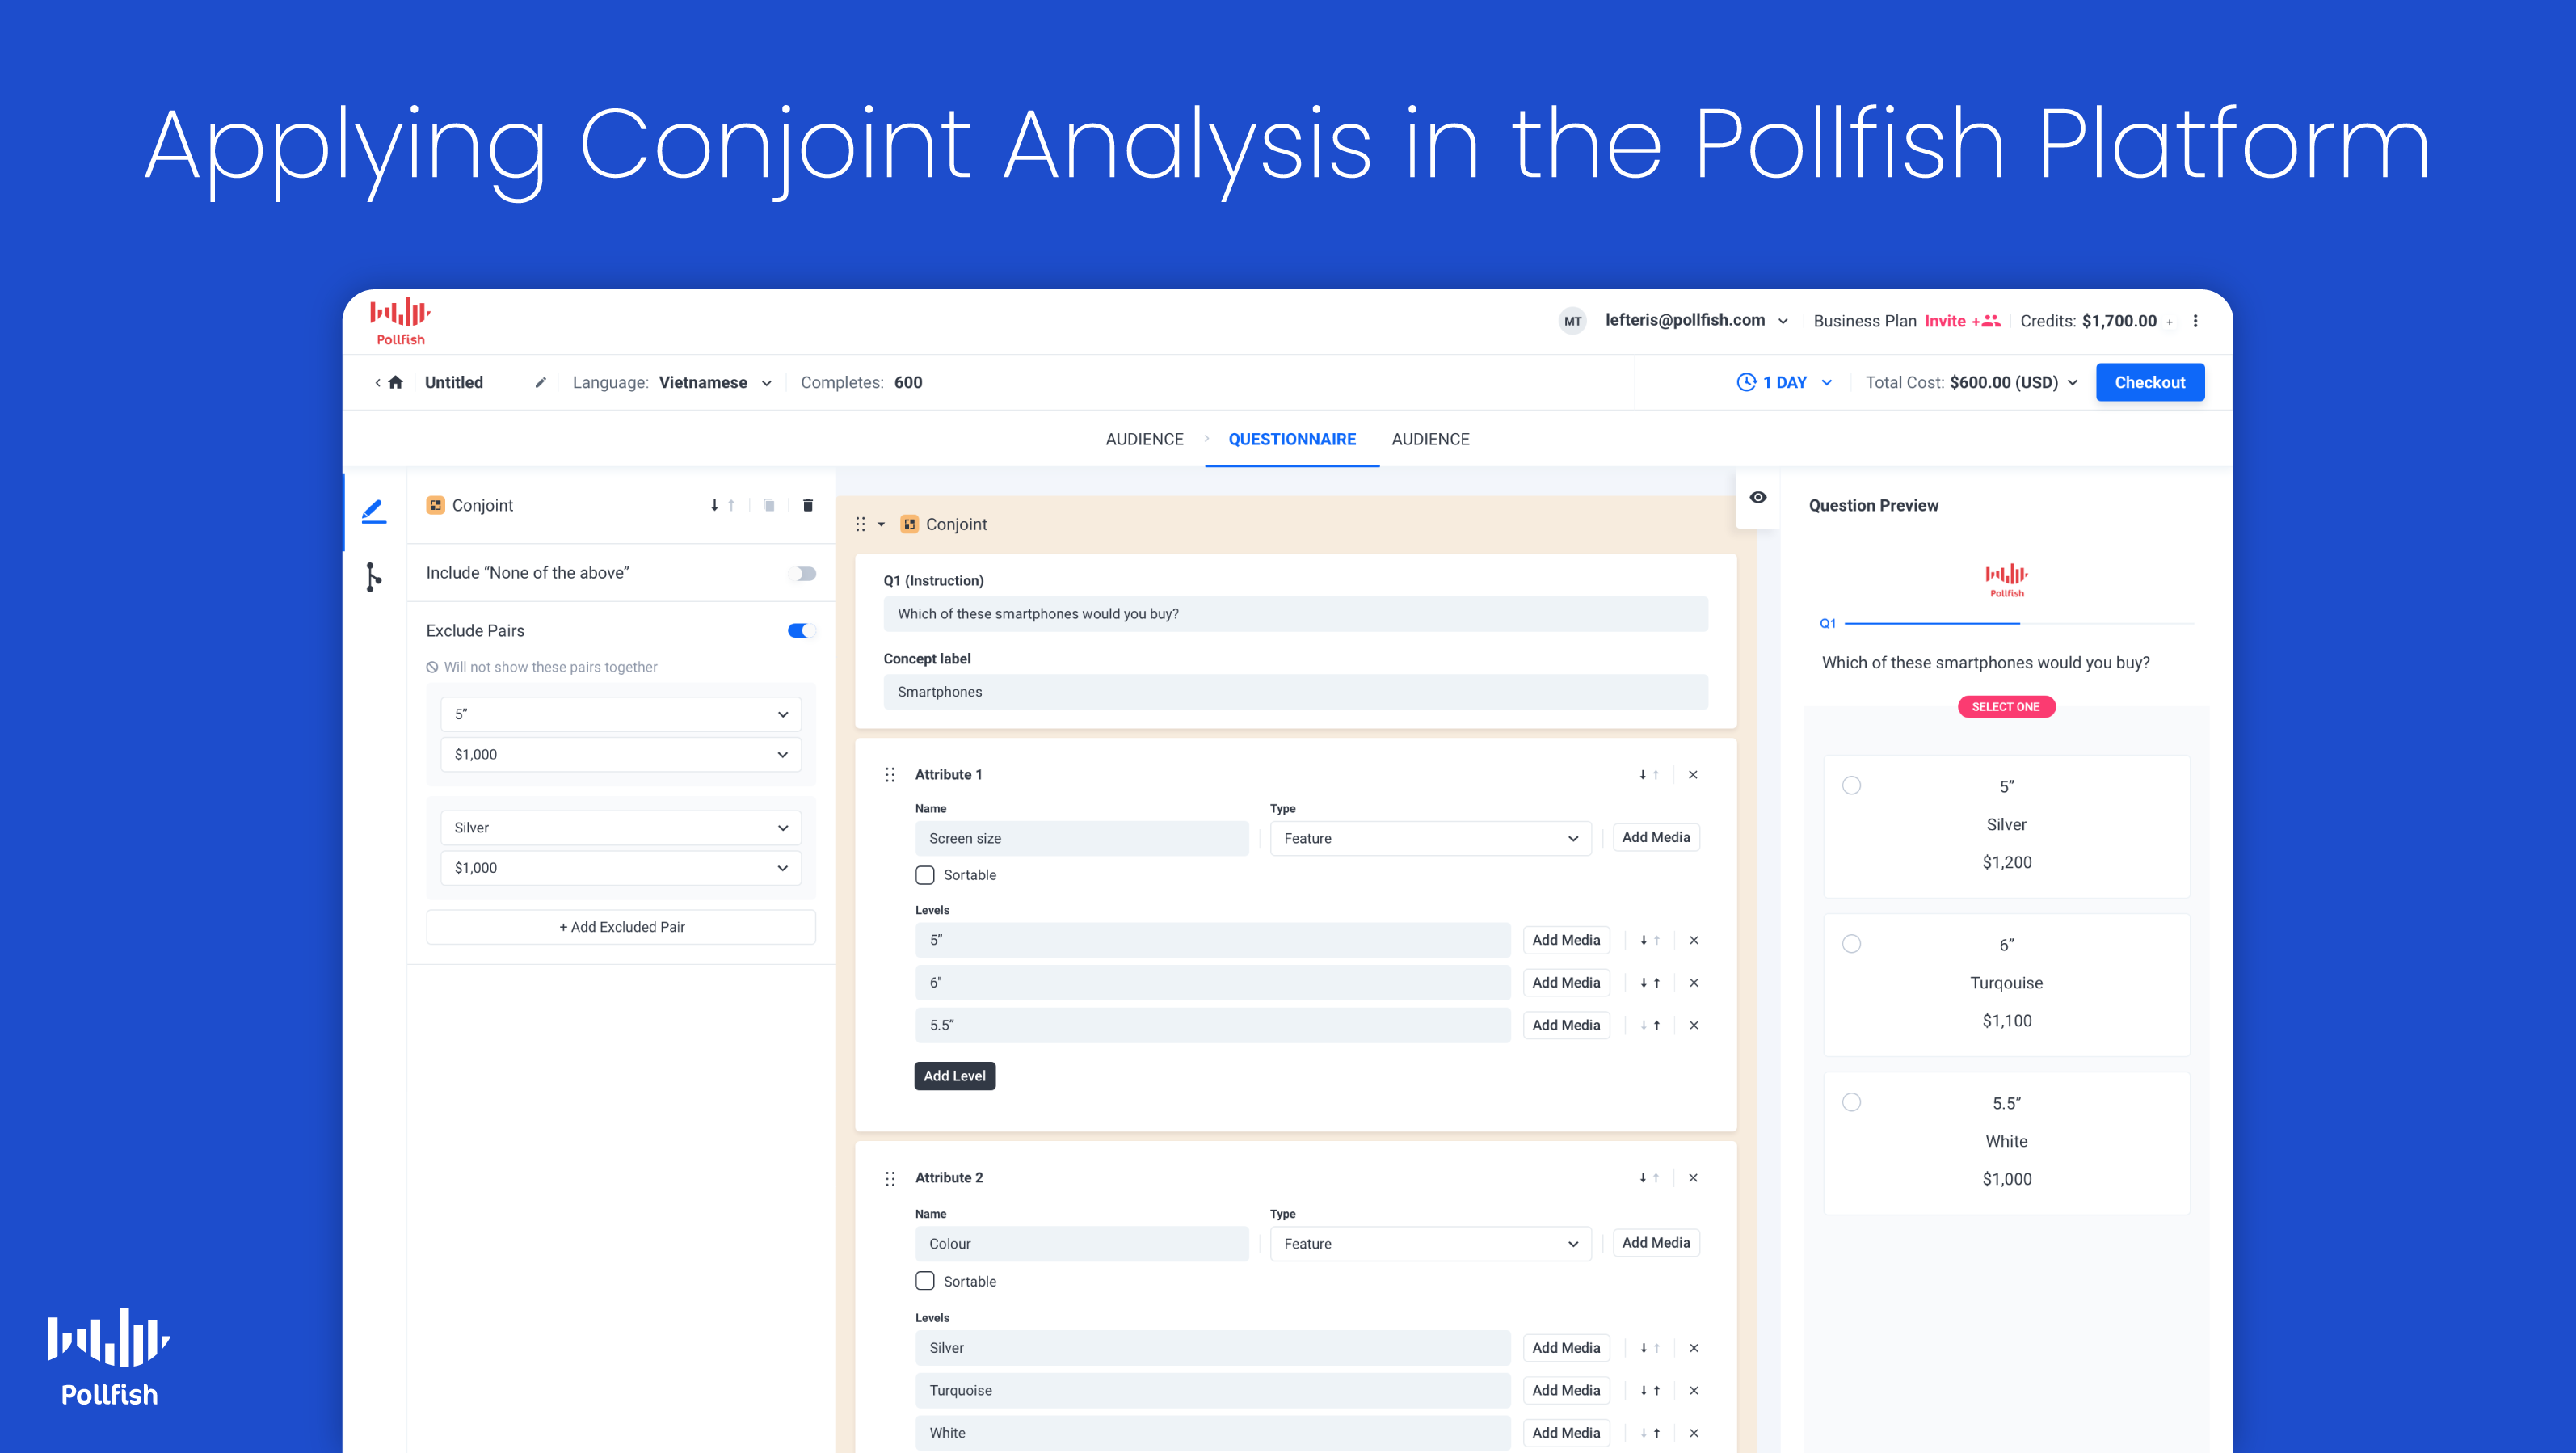
How to Build a Regular Conjoint Analysis Survey
Follow the instructions below to easily access and utilize this new feature.
- Open the Pollfish dashboard and hit “Create a new survey.”
- Add the conjoint method to your survey.
- At the question types option at the panel, there is a new method called Conjoint. Select it.


- At the question types option at the panel, there is a new method called Conjoint. Select it.
- Add the instructions.
- At the block displayed, provide instructions for the respondent on how to respond to the question text. Conjoint is presented as a repeated single selection question with different sets of product alternatives each time, so that the respondent selects one of them.


- At the block displayed, provide instructions for the respondent on how to respond to the question text. Conjoint is presented as a repeated single selection question with different sets of product alternatives each time, so that the respondent selects one of them.
- Add attributes and levels.
- Attributes are the different characteristics that a product comprises, such as the shape, type, quantity, etc.
- Attributes can be categorized as Features by default. If you need to specify price attributes, use the Price type, so that the analysis includes the Willingness to Pay graph. When using a Price type attribute, we suggest the following: none of the levels of price is zero and if there are more than two levels, they should have approximately equal gaps between them.
- Levels are the values that each attribute can take. For example, the perfume attribute can have levels of floral, green citrus, lavender, etc. Product alternatives are constructed from level combinations of each attribute included in the Conjoint Analysis feature.


- You can add the price levels formatted with a currency symbol or text that is displayed at the Conjoint question, while the plain numbers displayed at the “Just the number” fields will be used for the analysis.

- Heed the following restrictions and advice on attributes and levels.
- A conjoint experiment should have at least 2 attributes.
- Each attribute should have at least 2 levels.
- Use a maximum of 6-7 attributes. We recommend displaying no more than these in your conjoint question; any more and respondents will have difficulty in weighing the different options available.
- It is suggested that when using a Price attribute, the levels are linear so that Marginal Willingness to Pay is not biased.
- Prohibit particular level pairs.
- By default, all attribute levels have an equal likelihood of displaying together. This means that some product alternatives that will display in the conjoint question are not realistic. For example, sometimes a product will be shown with all the best features and at the lowest price.
- In order to prohibit such alternatives, you can use the “exclude combinations” setting. We advise prohibited pairs to be no more than 4.

- Enable none of the above.
- By default, the “none of the above” option is disabled.
- However, if you select to enable this option, this is visible on mobile every time a respondent views a choice set of alternatives (as a last choice under the alternatives).

- Access the preview.
- In order to preview a survey that contains a Conjoint question, you should click on the “Generate preview” button at the questionnaire tab while editing your Conjoint.
- By clicking the “Generate preview” button, your Conjoint attributes and levels are used to “feed” the Conjoint Design of Experiments algorithm and you will preview the actual Conjoint question that respondents will get.
- In the case that the survey contains any other questions, these will be included in the survey preview flow.
- Additionally, the Total Cost gets updated, including Conjoint costs, the survey’s path length gets updated and the number of alternatives per choice set and a number of choice sets are displayed (as determined by the Conjoint Design of Experiments algorithm).
- Every time the number of attributes and levels changes, or excluded pairs are altered, you have to click on the “Generate preview” button, to preview the new Conjoint question and get informed about the cost.


- Set the alternatives that each choice set contains and the number of choices that the respondents view.
- After you use the Conjoint Design of experiments, you can view how many times the Conjoint questions/ choice sets will be repeated and how many alternatives each choice set contains, as determined by the Conjoint Design of Experiments algorithm. Conjoint algorithms automatically decide the number of choice sets that each respondent will see in order to guarantee that all alternatives are displayed the same number of times to respondents.
- Add additional content
- Once your Conjoint question is set up, you are free to edit the rest of the survey in the questionnaire tab. You can add questions or question groups before and after the conjoint analysis question, determining survey behavior via survey logic.
- Before the conjoint question, you can add consent questions and you can add follow-up questions after the Conjoint question, as you would at a regular survey.
- Checkout
- Once you've completed setting up the Conjoint Analysis feature and any other questions, you can check out the survey. After it gets reviewed and approved, it will be live to gather responses.
- Translate your Conjoint Analysis survey.
- You can translate your specified attributes and levels, so that you can view the analysis in the language of your preference. In addition, the translation of attributes and levels is applied to the exported data at the Excel, CSV, SPSS files and at BQ.
- You can translate your specified attributes and levels, so that you can view the analysis in the language of your preference. In addition, the translation of attributes and levels is applied to the exported data at the Excel, CSV, SPSS files and at BQ.

 How to Create a Survey Link with Conjoint Analysis in Pollfish
Researchers on the Pollfish platform can use the Conjoint Analysis feature by way of a survey link and share it with your audience.
They can also duplicate a survey link that contains the Conjoint Analysis to a regular survey using the Pollfish global survey network, or you can do the opposite, duplicating a regular one to a survey link to distribute it to your own audiences via social media, email and more.