
How Pollfish Post Stratification Enables Instant Survey Weighting
How Pollfish Post Stratification Enables Instant Survey Weighting
When researchers create a survey with Pollfish, the audience they build is often somewhat different from the actual population. In an effort to ensure that your survey population is as accurate as possible, Pollfish created Post Stratification.
Post-Stratification allows users to weight their survey results with the push of a button using local census data. With this video tutorial, Ally will show you how you can add survey weighting instantly.
Video Transcription
Hi, I'm Ally from Pollfish, and today I'm going to show you an amazingly easy-to-use feature that let's you weight your survey results to the census data for the region you've surveyed.
When you launch a general population survey, oftentimes the respondents who take the survey are not reflective or representative of the actual population. Pollfish's answer to this is Post-Stratification; an easy, one-click solution that lets you weight these results. Let's get started.
Select or Run Your Survey
You can see that I am on my dashboard and I am going to choose a survey I have already completed. This is because the Post-Stratification feature is available on the Results page of your survey. If you'd like to reach specific audiences, we recommend that you set this up using Quotas on the targeting page before launch.
Weight Your Survey Results
Once you reach your results page, you will see that the actual results are what populates from your survey.
When you click Post-Stratified under View Results on the lefthand side, you can see a second data set populate under your actual results, showing you the weighted information for gender and age for that area.
Census Data Availability
Post-Stratification is available in 32 countries including the US, the UK and the EU. The data comes from the census for each country, except in the case of the US, where the data will come from state-level census data.
Income census data is available in Post-Stratification for the US when the information is sufficient.
Exploring Census-Weighted Results
You can see that in my survey, I have launched this to the UK and the US--two countries supported by our Post-Stratification algorithm. And I can toggle between the two to see the census-weighted results for each one, or I can see an aggregate group that has been correctly weighted by applying post-stratification to both at once.
Export Options
I can export these results by choosing export results from the upper-righthand corner. Post-Stratification is not currently available on the PDF export format, but it will appear as a new column in Excel, Crosstabs or SPSS exports
And that's it! If you liked this content, please like and subscribe to our YouTube channel, or check out Pollfish resources at resources.pollfish.com for more great tips.

Your Ultimate Guide To Writing Amazing Survey & Poll Questions


Contents

Section 1: Set Your Data Goals
Section 2: Question Writing 101

Section 3: Respondent Experience

Section 4: Avoid Questionnaire Bias
Your Ultimate Guide To Writing Amazing Survey & Poll Questions
Whether it is your first time creating a survey on your own, or you are a seasoned research professional, one thing is for sure: if you can’t write good survey questions, you won’t get helpful consumer insights.
But just what is a “good” survey question anyway? In this guide, we break down the four key elements that you need to master in order to write better survey questions.
A “good” survey question is:
- One that achieves your survey and data goals.
- One that is clear and direct.
- One that carefully considers user experience.
- One that is free from bias.
Throughout this guide, we will show you the tactics you can use to make sure you are delivering quality survey questions. To help you along, we will also show you what not to do, so you can easily spot the difference between a good question and one that needs some work.
For example, let’s say we want to avoid bias. Which of these is the better choice?
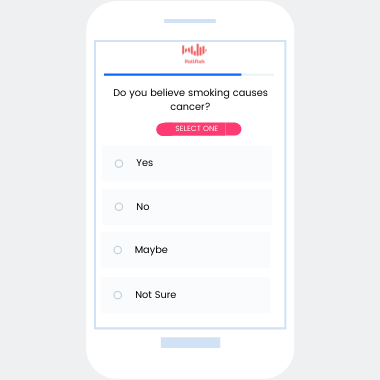
This is an example of a direct, straightforward question that has eliminated bias. Nice work!

This is an example of Prestige Bias. By letting the respondent know that an authoritative source says smoking causes cancer, you are biasing the respondent to agree with the source.
Try out these question quizzes at each section to test your knowledge as you go. Let’s get started.

Set (and Achieve) Your Survey Goals
Everyone wants to write good survey questions–they want to be clear, direct, engaging and get respondents excited about answering.
But these are not the most important reasons to take care when writing survey questions.
The reason is if you build a survey with the wrong questions or question types, you could get stuck with a bunch of data you can’t use.
That’s why it is important to set data goals in advance and tailor your survey to achieve those goals from the very beginning.
How To Set Survey Data Goals
On the surface, this may seem simple: just state what you want to learn from your respondents and go from there.
But different surveys deliver different types of data. So you need to know how you plan to use the data you get from your questions first.
For example, let’s say your goal with your survey data is to create a map so you can continuously survey consumers every month and map their responses over time.
For this to work, you will need to combine demographic data with raw numbers of respondents and their answers.
You also want to ensure that your questions are simple and not prone to shifts in understanding based on geographic location or time passing.
Knowing these data goals, which of these two questions would be better for your survey?
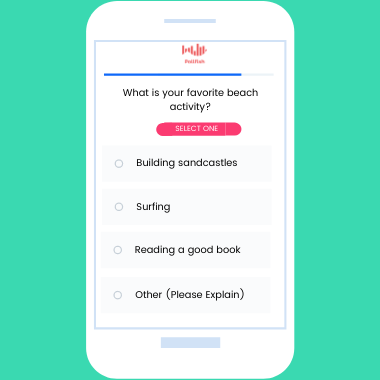
By adding a specific type of summer location, you assume that your respondents go to the beach or have been recently enough to have a favorite activity there. This will bias your survey towards people that live closer to a beach. Also, by allowing an open-ended question at the end, you will make one answer choice unusable for your map.
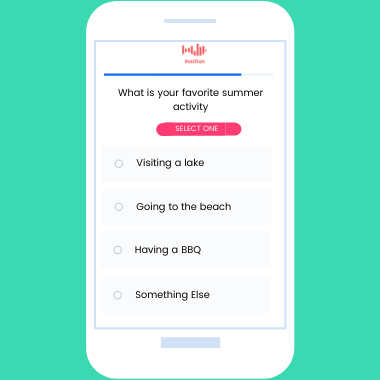
By keeping responses general, you avoid bias towards one geographic area. And by having a fully quantitative survey but also including a “Something Else” answer choice, you don’t force your respondents to give an answer that doesn’t apply to them, while still ensuring you only get data you can use for your map.
In order to discover the question types that may work best for your survey goals, check out this sample results page. Do an export of the data so you get a sense of what you will have to work with once your survey is completed.
Next, you’ll want to check with your stakeholders to ensure that you are aligned on the questions you want to get answered, how you want to use and ingest survey data and what you are hoping to be able to deliver at the end.
How To Ensure You Meet Your Goals
With Pollfish, you have 11 different question types to choose from. All of these question types deliver data slightly differently.
It’s also critical to deliver these questions in a structural order that makes sense to the respondent and reduces bias from their answers (more on that later).
Depending on your survey goals, you’ll want to choose these questions wisely to ensure you have a data set you can use.
The most important difference between survey question types is the difference between Quantitative and Qualitative research.
From Qualitative vs Quantitative survey questions
Quantitative research is about collecting information that can be expressed numerically. Researchers often use it to correlate data about specific demographics, such as Gen Z being more likely to focus on their finances than Millennials. Quantitative research is usually conducted through surveys or web analytics, often including large volumes of people to ensure trends are statistically representative.
Even when the survey audience is very large, quantitative research can be targeted towards a specific audience, usually determined by demographic information such as age, gender, geographic location.
Qualitative research focuses on personalized behavior, such as habits or motivations behind their decisions. This can be gathered through contextual inquiries or interviews to learn more about feelings, attitudes, and habits that are harder to quantify but offer important additional context to support statistical data.
When quantitative and qualitative research are paired, a complete set of data can be gathered about the target audience’s demographics, experience, attitudes, behaviors, wants and needs.
Based on this description, can you tell which is an example of a qualitative question type?
Qualitative surveys don’t have set answer choices. Instead, they allow respondents to speak in their own words about experiences with your product or service.
Qualitative survey questions allow respondents to speak in their own words about your product or service without selecting from pre-selected answer choices. You can use these questions to gain a deeper understanding about your consumers and their feelings towards your product outside of what you’d normally ask them. Feel free to ask more broad questions and let them open up.
But differences between quantitative and qualitative are not the only differences between question types. You can still gather a broader range of emotions from respondents without going to a fully qualitative survey.
Question types like matrix questions, where respondents can rank the importance of different product or service features can provide more quantifiable data while still giving a broader range of interest than a simple one-by-one ranking.
Lastly, some researchers choose to combine qualitative and quantitative research. By allowing an open-ended “other” field to single selection questions, for example, researchers collect quantifiable data, while still allowing the option for further context.
Based on your research goals, this added field can either provide needed context for deeper understanding of your audience, or create unnecessary noise that can’t be quantified and throw off the data set.
It all depends on you. So think it all the way through and have a plan in place before you begin creating your questionnaire.
Question Writing 101: Clear, Direct, Well-Tested
When writing anything, clear, direct communication should be the ultimate goal. You want to ensure that, regardless of any flowery language or interactive content features, the core of what you are trying to say is communicated loud and clear.
With survey questions, this becomes even more important.
Once you have selected your survey goals and you have a good idea of what kind of data you want to collect, the goal of your survey questionnaire is to get respondents to completely fill out your survey as accurately as possible.
Market research best practices show that it is best to let respondents decide if they want to finish your survey or not. With Pollfish, respondents can escape the survey at any time. Therefore, all responses are voluntary and of higher quality than if respondents were forced to finish the survey.
What that means for you as the researcher is you have to ensure that your questions don’t drive respondents away.
Don’t worry, Pollfish is here to help you with that. First of all, each questionnaire is reviewed by our research experts prior to launch. But you can help by following these three steps to survey question writing: be clear, be direct, and test on real people.
Be Clear
In order to get the types of answers you expect, you must ensure that your target audience will fully understand what you want from them.
What does that mean? Below are a few common mistakes researchers make when writing their first questionnaire.
Too Much Jargon
When writing for a niche audience, industry jargon can be a welcome addition. Things like common abbreviations and loaded terms help build rapport and allow you to establish a personal connection with your readers.
Not so in market research.
Imagine you are reading an article and you come to some jargon you don’t recognize. All it takes is a quick Google search and you have learned some new terminology.
But if you come to a survey question that contains an acronym or abbreviation you don’t recognize, not only will you feel like you can’t answer that question, you will feel like maybe you aren’t qualified to answer the rest of the survey. You may attempt to guess at the meaning, or escape the survey all together.
Even if your audience is screened to only be in your industry, don’t assume everyone uses the same terminology you do. Take care when using any kind of jargon, acronym or abbreviation in your survey questions.
Extra Explanation
Most survey question types are fairly self explanatory. If there are 5 answer choices and the instruction is “Select One”, there isn’t much room for interpretation there.
But when questions get more complicated, extra explanation is essential.
For complicated concepts or ideas that respondents may only have some ideas about, a “description” question type can be helpful in clarifying which part of the idea a respondent should focus on.
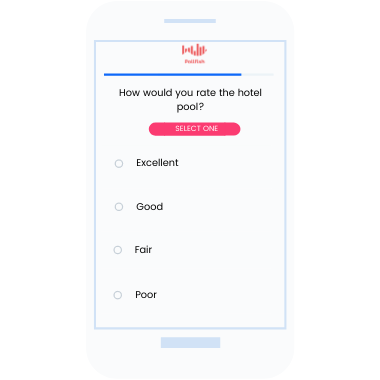
Matrix questions are one question type where you have to be careful of your labeling and explanation. Let’s take a look at two Matrix questions and see which is the most clear.
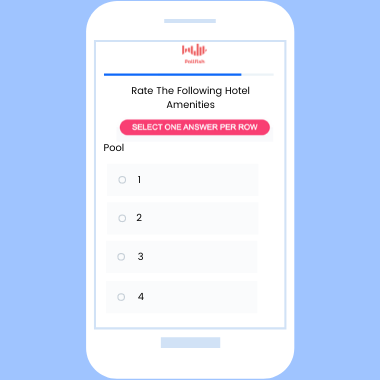
How are your respondents supposed to know if 1 is good or bad? When you use matrix questions, ratings scales and any other rating or ranking question, be sure to label questions clearly.
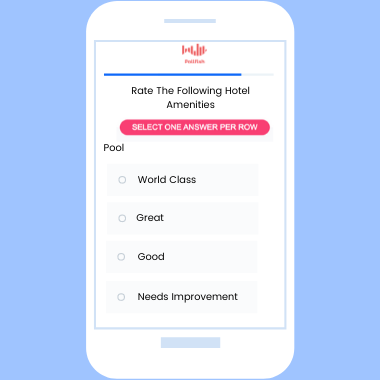
As you can see, everything here is labeled so it is very clear for each amenity what you are choosing when you select each answer. When you use matrix questions, labels are very important. From the row titles to the answer choices, make sure it is very clear what respondents are selecting.
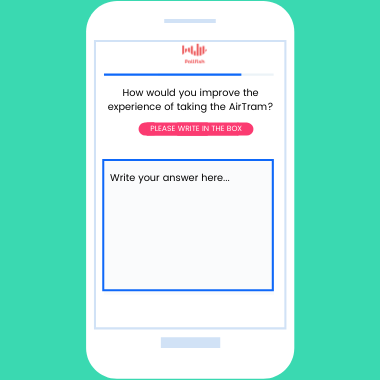
Questions that contain media like images, audio files and videos also often require further explanation. Let’s take a look at the video questions below and see which is the most clear.
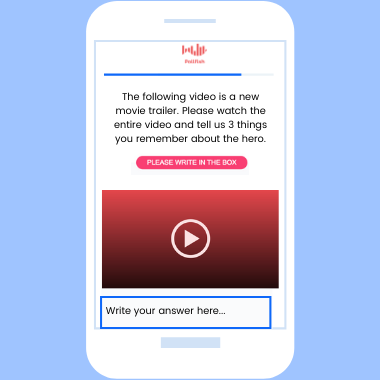
With questions containing required media, it is always a good idea to give explicit instructions as to what to do with that media. Once you have done that, you want to be very specific with what you ask respondents to deliver. If your ask is too vague, you are likely to get a lot of short, unthoughtful responses.
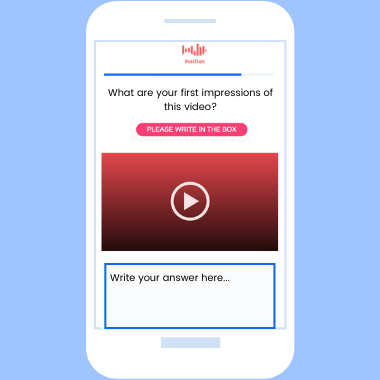
When you use Pollfish for video questions, respondents are required to watch the entire video before answering. Still, you want to be clear about what you want. If you want them to watch the entire video, say so. Also, be specific with what you want them to pay attention to. Otherwise, you are likely to get a lot of vague, unthoughtful responses.
If it is necessary to consume all media to understand the question being asked, make sure your instructions clearly state this. You can even include your media as a separate question.
Create non-leading questions
It can be tempting to write questions in a way that seems obvious to you, but survey questions should not follow the same patterns we have when speaking to each other.
Although plain language is advised, inserting your own opinions—even subtly— into the survey question can lead respondents to feeling more inclined to agree with the answer you want.
The second question remains neutral towards either show. Since the goal of your research is to uncover the most accurate data, you want to avoid pushing respondents towards one answer over another.
Make Answer Choices Clear & Distinct
Once you have made sure your questions and instructions are clear and direct, make sure your answer choices are distinct from one another.
One common reason respondents bounce from a survey is they cannot decide between two similar-seeming answer choices.
This can also reduce data quality because it may result in respondents offering answers they don’t really mean.
Although “yes” and “no” can seem like two distinct answer choices, these also don’t offer gradients within the answer options to appeal to respondents who don’t feel strongly or are unsure of an answer.
We recommend avoiding “yes/no” questions in favor of a Likert Scale or by writing answers out entirely to ensure less ambiguity and reduce bias.
Which of these questions seems correct?
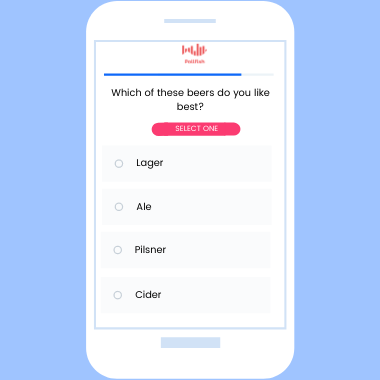
This question not only assumes the respondent drinks beer, but drinks beer enough to know the difference between these varieties. As a researcher, you don’t even know at this point if your respondent drinks at all. Answer choices need to be clearly distinct to all potential respondents, unless you have narrowly filtered your audience to ensure their knowledge.
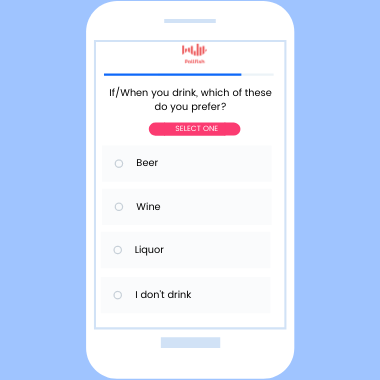
While this question is not as specific as it’s counterpart, it allows all possible respondents a chance to answer, while even making concessions for those who don’t drink at all. Once respondents answer here, you can get more specific (while ensuring the ability of respondents to participate) by using skip logic. Have the respondent answer and, for the ones who select beer, send them on to a question about which variety they prefer. That way, you can be more assured they will know the difference.
Be Direct
Good survey questions contain two parts: the question and the instructions.
For many Pollfish survey question types, some level of instruction is built in. But you want to be sure that when you deliver instructions, you are speaking directly, in clear, declarative statements.
Using too much passive language and indirect phrasing can create unnecessary confusion. Let’s take a look at the two examples below. Select which you think is the most direct.
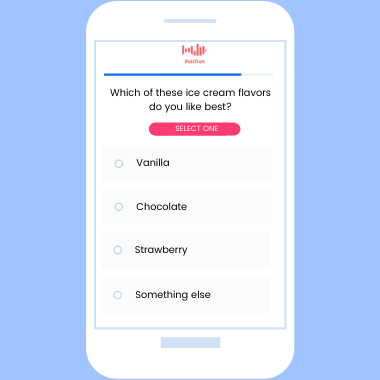
While these two questions may seem to say the same thing, using softer, more imprecise language opens up the potential for confusion. Using very direct, plain-spoken language removes any such ambiguity. Or to put it more simply, it makes questions (nearly) idiot-proof.
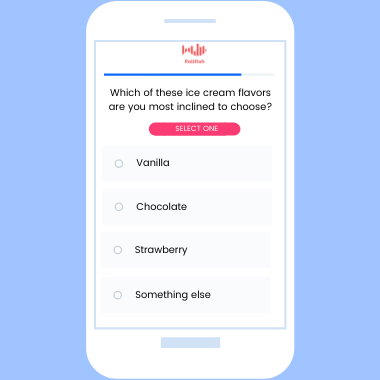
While these two questions may seem identical, the indirect language here leaves room for confusion. For example, who am I choosing for? Without a direct subject, I am left to wonder why I might be inclined to choose one flavor over another. Maybe when I buy ice cream, I only buy it for my husband because I am on a diet. If you want your respondent’s personal preference, ask for it, as clearly and directly as possible.
Always keep your Survey Goals in mind
As we learned in part 1, survey goals are at the core of all research projects. To make sure you’re writing the right survey questions to meet the right goals, consider the flow and structure of the survey and how the respondent will be presented with each question. Your goals may also dictate the type of question respondents should be given.
Example: Survey goal is brand awareness
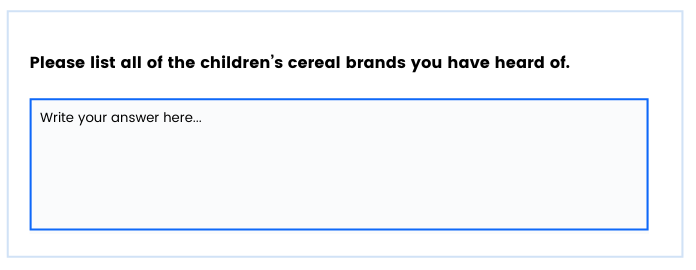 It’s best to begin a brand awareness survey with an open-ended question for respondents to recall brands that are top-of-mind, prior to being presented with a series of questions that might trigger their recall.
If the survey goal is press for a specific cereal brand, ranking questions can help uncover consumer preferences.
Ranking questions ask respondents to order answer choices, forcing them to choose one over another. These are best for establishing stronger opinions or validating a strong preference.
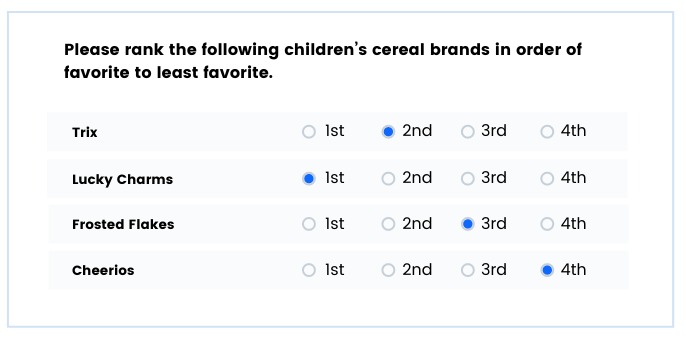 The data from a ranking question could be “85% of consumers believe that Trix is the best children’s cereal”, providing a good headline for a research story.
Matrix questions allow respondents to apply a ranking scale towards each cereal, but don’t force them to choose one over another or compare them. These are a better question choice to measure other sentiments.
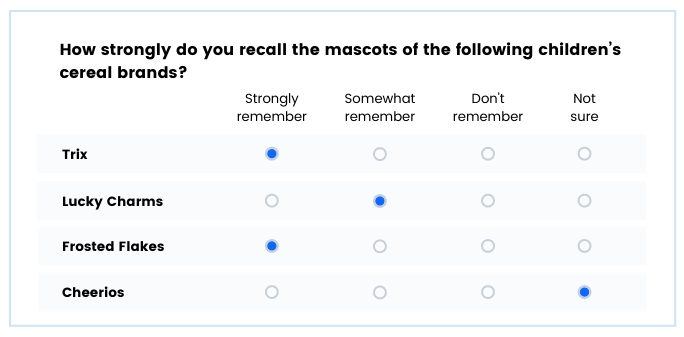 The possible data to come from a matrix question could be that nearly ¾ of 90’s kids recall Frosted Flakes’ “Tony the Tiger”, however, the Cheerios bee has largely been forgotten.
Test On Real People
While it is important to align with all stakeholders internally on survey goals, you also want to test out your final questionnaire on some real people.
This can mean either sharing it with co-workers who are not familiar with the research project, or emailing your questions to a friend.
Getting outside help can be essential in identifying unclear directions that cause confusion for your respondents.

Respondent Experience: Think Like An App User
Because nearly everyone has an internet-enabled device with them at all times, survey companies have identified the opportunity to use this technology to reach respondents.
Unfortunately, not all surveys are created equal when it comes to offering a good respondent experience on mobile devices.
Poor respondent experience can have disastrous consequences, impacting your survey response and completion rates, and even impacting the data quality of your study.
So how can you follow best practices for mobile surveys?
Build on a Mobile-First platform
By using Pollfish, you are already off to a great start. That is because every Pollfish survey question type is optimized for mobile out of the box.
Our surveys are not only optimized to fit your mobile screen, they are delivered exclusively inside mobile apps, meaning each question type is designed by app developers to mirror the experience of an app.
Pollfish also provides a mobile previewer for each question in your survey, so you can test how your question will look on a phone in real time, right inside the questionnaire builder.
<Maybe add a screenshot of the questionnaire builder here?>
Shorten your questionnaire
Because so many users prefer to take surveys on mobile devices, it is important to think like a mobile user.
Think about your app usage–do you stay in one place on your phone for a long time, or do you jump quickly from place to place? Do you often have your phone open for hours or do you use your phone in quick bursts?
Mobile phone users want to move fast. They could be on the go. They could only have a few minutes to kill while waiting in line at the bank.
That’s why it is important, when you can, to keep surveys short.
Shorter surveys get faster results and ensure full engagement with your questions from start to finish.
Our survey experts review every survey before it is published as well, so they may recommend you shorten parts of your study if they feel respondent experience may be impacted.
Keep a mobile mindset
While all our survey questions will look great on mobile, there are a few things you can do to make your questionnaire more engaging to the mobile user.
Start by favoring question types that are easier to answer on mobile phones. Multiple-choice questions that users can tap, rather than open-ended questions where typing is required makes answering easier for users. Question types like rating stars and using video can keep users engaged and motivated throughout your survey.
Keep in mind that while many survey tools that offer a “mobile survey” experience also offer matrix questions, you’ll want to verify that these have been designed for mobile distribution.
Matrix questions in a typical survey present as a table where respondents are asked to rank a series of answers. In mobile, these don’t translate into a good experience for respondents.
Ensure that your mobile matrix question utilizes vertical scrolling and doesn’t require respondents to zoom in or drag the table horizontally to see all the answer possibilities.
While more qualitative questions may be helpful to provide more context and emotion to survey respondents, mobile respondents would rather tap or swipe than type.
If you were a mobile user, which of these would you prefer to answer?

Prevent Survey Bias
One of the most important parts of building the perfect survey is reducing survey bias.
From Your Ultimate Guide To Survey Bias
Put simply, survey bias impacts data quality. By eradicating survey bias (as best you can), you build trust in the data you’ve collected.
That’s no small thing, as companies across the world are using consumer insights data to inform everything from content creation to product timelines to strategic planning.
So how do you remove bias from your questionnaire?
Well, for starters, it is important to remember that preventing all survey bias is impossible.
That’s right. We are all biased. We have unconscious thoughts that cause us to subtly indicate our true feelings to those around us. And that applys to writing survey questions as well.
The key is to do everything you can to remove the most pernicious forms of bias from our surveys so we can ensure top-quality data.
With this section, I’ll take you through a few of the more common ways to avoid bias in your questionnaire.
Remove Double-barreled questions
Double-barrelled questions happen when researchers blend two questions into one, and then allow for only one answer. This creates a fallacy for the respondent and often results in incomplete or biased answers.
Can you tell which question is biased here?
While this question may not appear to cover as much ground as it’s counterpart, the other question here doesn’t allow the respondent to choose different answers for the Pool and Bar. It is always better to split double-barreled questions into two separate questions to ensure specificity.
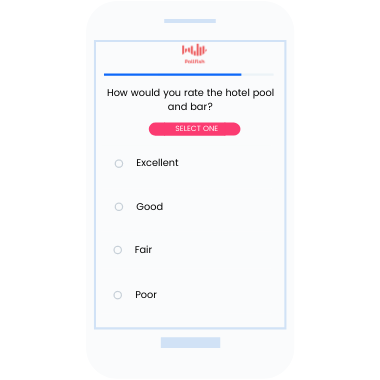
This question doesn’t allow respondents the ability to select different ratings for the pool and bar. Even if you consider the pool and bar to be the same, a respondent may not. Double-barreled questions provide incomplete answers. You’ll risk losing critical consumer insights. Make sure you split them in two.
Avoid Assumptions
Depending on how you write a question, you could be assuming things of the respondent, or even forcing them to give an answer they don’t believe.
One way researchers fall into this trap is by asking loaded questions. Loaded questions make multiple assumptions about a person and then force them to answer a question based on those assumptions.
Can you spot the Loaded question?
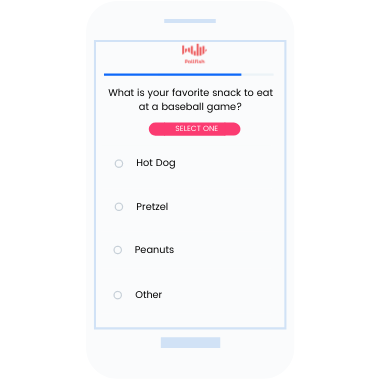
This question presupposes the respondent likes attending baseball games, because they have to fit the premise of the question in order to answer. Before you can ask this question, you must ensure your respondents like attending baseball games. You can do this by asking such a question and then adding skip logic so that only those who have previously attended baseball games will be shown this question.
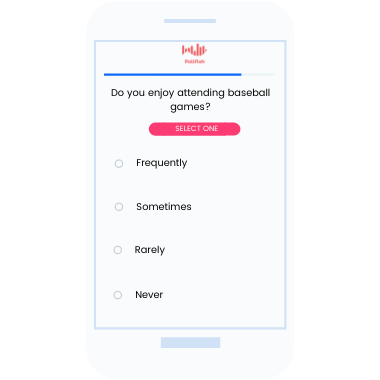
Before a respondent can answer a question about snack preferences at a ballpark, you have to first establish that your respondents attend or have attended baseball games. You can ask the above question and apply skip logic so only those who fit the premise of your intended question are shown it.
Don’t Use Biased Language
Similar to Loaded questions, biased language (sometimes called Leading questions) pushes respondents towards one response or the other.
This removes the impartial nature of a survey and influences respondents, leading to poor data quality.
Can you spot the Leading question?
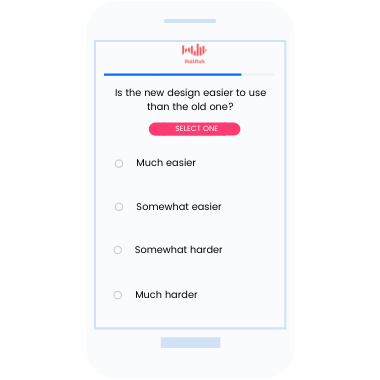
The words “new” and “old” bias the respondent towards saying the newer design is easier to use. You need to ask questions from a neutral position and do your best to avoid biased language that lead respondents towards one answer or another.
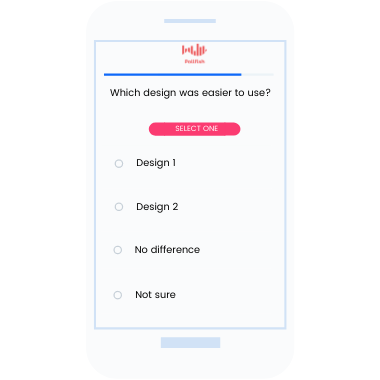
By asking, simply and directly, which design is easier to use, without letting the respondent know which is newer or older, you ensure that you remove bias. By adding responses like Not Sure or No Difference, you open up the question to additional answer possibilities for a broader range of respondents.
Do Your Best To Include All Available Choices
As a general rule, you want to avoid forcing respondents to give an answer they don’t really mean.
So when you are writing a closed-ended survey question with a finite answer pool, make sure you think hard about additional answer possibilities that may not come immediately to mind.
Once you have done that, there are two additional ways you can reduce bias on these kinds of questions.
The first is to add an open-ended “Other” field, where respondents can include any additional choice you may have forgotten. If there is enough consistency in responses, you may even be able to manually quantify the data. If not, you have still provided some much-needed context to the current answer choices.
If you want to stick with your closed-ended question type, you can make it clear in your instructions that respondents are to select the answer closest to what they think. This is imperfect and provides a tough-to-quantify variable to your data. But it also will keep respondent experience and completion rates up.


Pollfish Is More Fun With Friends (Video)
Pollfish Is More Fun With Friends
Did you know you can add up to 10 team members on a free (basic) plan? While it might not be the first thing that comes to mind after registering with us, adding team members can really enhance your experience trying out Pollfish market research tools.

While you are test driving Pollfish on your first survey, you can add your whole team and share the results with them, let them add questions or browse targeting.
Benefits of adding multiple team members
There are several other benefits to adding your team right from the get-go. Like...
- You can train your staff on all market research tools as they build surveys.
- You can share the platform with department heads so they can test it as well.
- You can share capabilities with your executive team.
- You can open it up to your team and monitor usage to see if Pollfish proves an exciting addition to your stack.
How to add multiple team members to Pollfish
To add team members, simply log into your Pollfish account and follow the steps below:
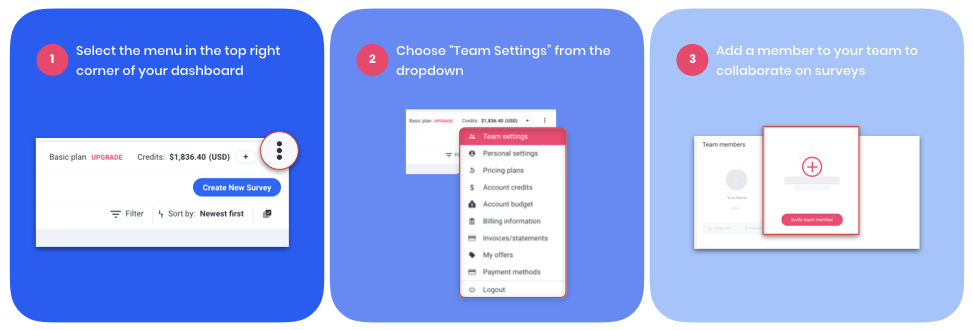
1. Find the settings menu by hovering over the three dots on the top control bar.
2. Select Team Settings from the menu.
3. Scroll down to add team information, add team members and even add a team logo.
You're ready to start sharing insights with the whole team!
Tips for setting up your first survey
Now that you have added your team, you will want to set up your first survey so you can check out the amazing results you can collect with Pollfish.
Here are just a few tips to set up your first survey.
1. Decide what you want to find out
It sounds simple, but knowing what you want your survey to achieve will help you write better questions and get more useful results. For example, if you want to capture broad opinions in your potential customer's own words, you'd use more open-ended questions. If you want a set of easily extensible data and a broad set of insights from predetermined answers, you'd use multiple-choice questions.
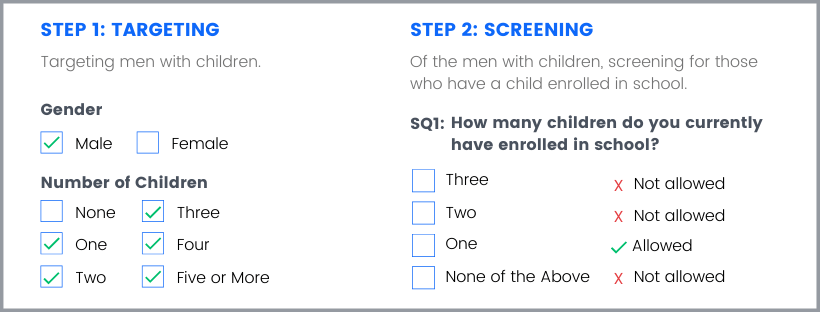
2. Set up your targeting before you set up your screening questions
On many traditional platforms, you may purchase your survey audience separately from the platform where you create the survey. This means that, if you plan to use screening questions, traditionally you'd set them up as your first step, to ensure only the audience members you want take your survey
With Pollfish, it works a little differently. Because Pollfish is an all-in-one solution, you get to choose your perfect target audience right inside our platform. You will have many advanced targeting options to choose from. But if you find you want to screen your audience further, you can always use a screening question.
Use screening questions to narrow your chosen audience down to just people who have heard of your product before or people who prefer cats to dogs. Whatever you can dream up is alright with us.
3. Remember to design with user experience in mind
Pollfish surveys are delivered inside mobile apps. All questions are fully optimized for mobile and designed with the mobile consumer in mind. This means you can expect higher than average response rates.
But you can do your part to ensure your survey questions are answered in full by following a few basic rules of respondent experience.
First, don't make your survey too long. Long surveys have higher abandonment rates and cause people to rush through important questions.
Make sure you keep things interesting. Try using video or audio instead of text for certain questions. This will make sure your audience remains engaged to the very end.
Once you have added your team members, check out the rest of the Pollfish Resources Center for more tips on how to get the most out of your Pollfish market research tools.

Market Research Terms Glossary


Contents

Section 1: Market Research Terminology

Section 2: Question & Survey Types

Section 3: Survey Bias

Section 4: Pollfish Features
Market Research Terms Glossary
You can’t become a market research expert without learning the lingo. That’s why we created the Pollfish Market Research Terms Glossary.
This alphabetical listing of key market research terms, concepts and ideas has been segmented into four sections: Market Research Terminology, Survey Design & Question Types, Survey Bias and Pollfish Features.
For basic research concepts, check out the Market Research Terminology section. Survey Design & Question Types gives simple definitions of the different types of surveys and questions you can build with Pollfish. The Survey Bias section takes you through the ways you can bias your results. And the Pollfish Features section gives you definitions of Pollfish-specific tools and features so you’ll always know what’s going on.
Check it out!


Section 1: Market Research Terminology
The more you read about market research, the more surveys you build and the deeper you sink into the world of consumer insights, the more you translate the language surrounding it.
Here, we define some basic terms that you will need to have an understanding of to become a market research expert.
A
Agile market research
An approach that values numerous small experiments over a few large bets, rapid iterations over big-bang campaigns and responding to change over following a plan.
C
Complete
A fully completed survey that has been screened for bias, insufficient responses and bots.
Completion Rate
The rate at which surveys are completed as compared to the number of surveys started by respondents. To calculate completion rate, divide the number of completes by the number of starts.
Consumer Insights
Valuable information on the preferences, opinions, habits and emotions of your most valuable customers. Consumer insights usually encompass insights related to a product or service.
Control Group
Survey participants can be split into two groups–an experimental group, exposed to a product or service, and a control group that is neutral. A common example is ad effectiveness testing, where researchers can track a respondent’s exposure to an ad through cookies. They then split those who have viewed the ad and those who have not into separate groups, asking the same questions to see how responses differ.
Cost Per Complete
The price you pay per completed survey. This calculation is based on certain factors of your survey, including the number of screening questions, quotas, demographic/geographic filtering and more. Learn More >
Cross Tabulation (Crosstab)
A feature of your survey platform that presents data in a table with rows and columns, designed to help researchers observe two or more variables at the same time. Crosstabs are useful when you want to divide your respondents into subgroups to see how a dependent variable changes the results.
D
Data
Any information collected by your survey, along with any outside information collected, observed, generated or created in service of your research goals.
Data Cleaning
Removing unqualified, biased or incomplete responses from a survey. This process improves data quality and protects against survey bias. Learn More >
Device ID
An individually assigned ID given to a Respondent’s device to differentiate them from other respondents. Many survey platforms who deliver surveys via mobile devices will collect or create Device IDs. At Pollfish, these IDs are passed to us from the mobile app publishers where we deliver your survey. This ID, along with demographic information respondents give on their first survey, are collected and used for targeting and filtering purposes in the future. Learn More >
DIY market research
Market research conducted using a self-service platform, as opposed to partnering with a market research agency or research consultant. Most DIY market research is conducted in-house to avoid the speed and cost limitations of working with outside entities. Learn More >
Drop-Offs
When a respondent begins a survey and doesn’t complete it. These are also called Starts. Drop-offs are not counted as completes and, therefore, you will not be charged for them.
E
Engagement
Engagement has many meanings. It can refer to a high degree of focus and interest in stimuli. In digital marketing and technology, engagement often refers to metrics surrounding use of platforms, content features or apps (think clicks, time on page, etc). In market research, engagement refers to how users interact with your survey. Does their time spent on each question indicate they are confused or don’t understand how to choose an answer? If so, your completion rate could be impacted.
F
Feasibility Study
A feasibility study is designed to determine the likely success of a project, product or service. There are many factors that go into a feasibility study, including existing competitors, production limitations, timing, estimated pricing and more. Brands or researchers may conduct feasibility studies to determine the market interest in a new product or service, or even to help determine the feasibility of a future research project.
Fielding
Fielding refers to the distribution of the survey questionnaire. When using Pollfish, you can watch your results roll in in real time using our Results Dashboard.
I
Implicit data
Implicit data refers to information that is not provided from respondents directly, but is gathered from available data. For example, Pollfish collects location data and information on a respondent’s mobile carrier from the App publisher, not from the respondent directly.
Incidence Rate
Incidence rate is the measure for the rate of occurrence or the percentage of persons eligible to participate in a survey, based on the targeting criteria selected.
L
Longitudinal Research
Researchers performing a longitudinal study will run the same survey many times over short or long periods, in an effort to observe how the opinions, behaviors or habits of the same population change over time. The population can also be randomized to see how time impacts the questions being asked, regardless of population.
M
Margin of error
Margin of error, also called the confidence interval, is a statistical measurement of difference between survey results and the population value, expressed as a percentage. Within the survey ecosystem, the margin of error measures the difference between your survey results and how accurately they reflect the views of the overall population. Learn More >
Market research
Market research refers to the gathering of consumers’ needs, preferences, habits, behaviors and more in an attempt to better understand a company’s potential customers, brand positioning and potential interest in a product or service.
Mobile ID
Also known as the Advertising ID, this unique ID number is how mobile advertisers are able to cookie users and keep track of engagement with mobile ads. At Pollfish, we use this id in a similar way, delivering surveys to users in much the same way an app delivers ads. We use the advertising ID to ensure we don’t send the same survey to the same user more than once. Learn More >
N
Non-Probability Sampling
Non-probability sampling excludes some of the population in your sample, and that exact number can not be calculated – meaning there are limits on how much you can determine about the population from the sample. These methods include convenience sampling, quota sampling, judgement sampling and snowball sampling. Learn More >
O
Online panel
Online panels collect responses either via a fully opt-in structure, including a signup page, or start with some form of digital outreach to potential respondents who have agreed to take surveys in advance. Panelists are then recruited to participate in specific surveys, for example via email invitation to the page of the panel provider. Pollfish avoids the pitfalls of traditional online panels by asking users to take surveys while they are using apps or games in real-time, increasing data quality and reducing biased responses. Learn More >
P
Panel
A panel is a collection of potential respondents who have agreed to take a survey in advance of the survey’s fielding process. These respondents are typically promised some type of incentive in exchange for joining the panel, which would effectively pay them for their time. Learn More >
Piping
Piping allows researchers to personalize surveys by ‘piping’ an answer from a previous question into a later question. For example, you can ask a respondent their name or occupation on the first question, and then add that name or occupation to future questions to make the questions more personalized.
Population
The population is the total group of respondents who you attempted to survey. If they complete your survey, they become part of your sample.
Primary Data
Primary data refers to the data collected by researchers directly from respondents using surveys, interviews or direct observation.
Primary research
Primary research refers to the methodology of using only data collected directly from respondents, rather than relying on data collected during previous research or from some external source (government agencies, employment records, etc).
Probability Sampling
Probability sampling refers to a randomized method of respondent selection. In order to utilize probability sampling, researchers have to have a method that ensures every member of the population has an equal chance of being chosen to participate (like picking names out of a hat).
Psychographic
Unlike demographics, which explain who your respondents are, psychographics seek to explain why they do what they do. While any quantitative study, group of screening questions or even secondary location data can net you demographic data, psychographics are more often culled from qualitative studies. For example, is your respondent concerned with health and appearance? Do they enjoy socializing or are they more introverted? You can get answers to these questions from scale-based quantitative questions, but open-ended questioning or interviewing often provides more depth to these groupings. Depending on how you plan to use them, you should consider this before creating your survey. Learn More >
Public Opinion Research
Public opinion refers to the opinions of a majority of people in a certain population. Polling the public opinion requires taking as broad of a study as possible and asking direct, quantifiable questions about specific issues.
Q
Qualification rate
The qualification rate is the estimated percentage of people you expect to qualify for your survey based on your targeting criteria, screening questions and other filters.
Qualitative research
Qualitative survey questions aim to gather data that is not easily quantified such as attitudes, habits, and challenges. They are often used in an interview-style setting to observe behavioral cues that may help direct the questions. Learn More >
Quantitative research
Quantitative research is about collecting information that can be expressed numerically. Quantitative research is usually conducted through surveys or web analytics, often including large volumes of people to ensure trends are statistically representative. Learn More >
Questionnaire
Your questionnaire is the list of questions you plan to ask your respondents. There are many different types of survey questions you can ask, depending on your survey goals. Learn More >
Quota
Quotas are limits you can set for the number of responses your survey collects from a particular group. They can be set across the entire survey or on a given question or segment. Unlike weighting, which ties your quotas to existing data sets like a national or local census, quotas can be chosen by the researcher to match the goals of your survey. If, for example, you’d like to survey a population that is 75% female, you can do that.
R
Respondent
A respondent is a person who meets your targeting criteria and completes your survey in full.
Response Rate
The response rate is the percentage of the total targeted population who responded to your survey. Learn More >
S
Sample
Your sample refers to the respondents who matched your targeting criteria and completed your survey.
Sample size
Your sample size is the number of completes your survey receives. Learn More >
Secondary data
Secondary data refers to data that has been collected outside of the bounds of a researcher’s survey, but which the researcher can use to add context. For example, DMV records, national census records and other government information can be used for things like weighting and quotas, or just to show the disparity between perception and reality within a studied population.
Secondary research
Secondary research refers to the summary or synthesis of existing research towards a new research goal. In this practice, previous primary research projects are used as sources.
Segmentation
Segmentation studies seek to separate larger audiences into smaller segments based on similar tastes, interests, perceptions and other secondary factors like education, employment or lifestyle.
Statistical significance
A measurement to quantify whether a result is just due to chance or due to some significant factor. Getting a survey that is not statistically significant comes from sampling error. That’s when your sample doesn’t accurately reflect the population of your survey and, therefore, may cause skewed results. There are two things to contend with when trying to remove sampling error: sample size and variation. The larger the sample size, the less chance there is in the result so that reduces sampling error and increases significance. Controlling for variability of your sample also can impact sampling error–the more variability in your sample, the more prone to error the study will be.
Survey
In its most basic form, a survey refers to the questionnaire–delivered either in person or online–that a researcher administers in service of a research study. When using Pollfish and other online survey platforms, a survey refers to the targeting you select, the questionnaire you create and the results files created once you run your survey. Each survey’s full info is grouped together in your account dashboard.
T
Targeting
Targeting refers to the criteria you select to screen potential survey respondents. Once targeting is selected, a population is created and your survey is delivered.
Tracking Study (Tracker)
Tracking studies use the same questionnaire, delivered over time, to track brand awareness, monitor customer satisfaction, study consumer interest in new products or services, analyze the effectiveness of advertising creative and more. Tracking studies may be delivered to the same populations (to gauge how perceptions of the same group changes as time goes on) or different populations to view time as just one factor impacting shifting perceptions.


Section 2: Survey Design & Question Types
When creating your survey design, it is important to start with the type of survey you want to run. Understanding the small but significant differences between survey types is a great first step.
Here, we want to review the different types of studies you can run with Pollfish, as well as the ideal question types for each one.
A
Ad Absorption
A study designed to show the effectiveness of certain advertising creative. These studies tend to use narrow audience targeting screening questions and even control groups to determine if new ad creative is having statistically significant impact on user experience or understanding of a product, brand or service. Learn More >
Attitude & Usage Testing
A study that aims to understand the available market for a product or service. This typically involves things like market sizing, general understanding of the product category, questions understanding brand decisions, gathering targeting information and more.
Audience Profiling
Profiling is a process of collecting demographic information to define an audience or population. Researchers may need to conduct surveys of a population to determine if there are enough available survey takers for the demographic or other targeting they want to run. At Pollfish, we use a rolling profiling model to keep our audience up to date. We also collect most of the demographic data you will need up front, including demographic, gender and mobile usage data.Learn More >
Audio question
A question that requires the respondent to listen to an audio clip in full before answering.
B
Brand Awareness
Brand awareness is the extent to which consumers are familiar with a brand, the extent to which the brand’s intended perception matches reality and the extent to which a company’s brand is helping or hurting sales.
C
Closed-ended question
Closed ended questions are those that offer a limited selection of answers to choose from, such a single or multiple-selection question, matrix, or scaling question type. Learn More >
Competitive Analysis
Competitive analysis testing helps you better understand how your potential customers are discovering your competitor’s product, feature preferences, user behavior and more. Learn More >
Concept Testing
The process of testing a big idea, concept testing allows you to run ideas past a sample of your target market before producing them. These ideas can be new logos, new product ideas, new ad campaign ideas and more.
Content Creation Surveys
Conducting surveys can reveal gaps in news coverage that can help digital media brands develop a unique editorial voice. By surveying outside of existing readers to prospective readers and even competitive readers, digital media companies can gauge interest in, and existing knowledge of–certain topic areas. Learn More >
Creative Testing
A test allowing a creative team to gauge the effectiveness of their work at conveying the feelings and emotions they were aiming for. This includes logo testing, ad creative testing and more. Creative testing may ask questions about brand effectiveness, gauge tone and consumer enjoyment and gauge the likelihood of someone to purchase before and after viewing creative assets.
D
Description question
A question in your questionnaire that contains a basic description. This question type is usually used to provide directions to the respondent. Learn More >
I
Image question
A survey question requiring respondents to look at and respond to an image or a group of images.
L
Likert Scale
A Likert Scale is typically a 5 or 7 point scale that asks a respondent to express how much they agree or disagree with a statement. Learn More >
Logo Testing
A type of creative testing focused on changes, updates or just current opinions of a brand or product logo. This type of survey may contain questions gauging how appealing, authoritative or on-brand a logo is, or even reveal possible changes to a brand logo and ask potential customers to weigh in. Learn More >
M
Market Analysis
Studies that focus on the size, scope and potential of a market. Before launching a new product, companies may want to figure out the size of the potential market by broadly surveying interest for that product across key areas and demographic groups. This helps companies determine how large a product rollout may be needed.
Matrix multiple selection question
A matrix question asks respondents to make selections for multiple options on a scale. A matrix multiple selection question lets you select multiple responses for a single option. For example, a matrix may contain elements of a hotel, asking respondents to rate elements like the pool or the lobby bar using a variety of potential responses like “Clean” or “Fun.” A multiple selection matrix will allow you to check all descriptions that apply. Learn More >
Matrix single selection question
A matrix single selection question will ask you to select one answer per option on a scale. For example, a matrix may contain elements of a hotel, asking respondents to rate elements like the pool or the lobby bar using a variety of potential responses. Because responses are single-selection, researchers will often ask something more definitive, like “How likely were you to use these different elements of our hotel?” And ask for a scale of 1-5. Learn More >
Multiple selection question
Multiple selection questions contain a list of options and ask respondents to select all that apply. For example, the question “what kind of music do you like?” will contain a list of music types so respondents can select all types they prefer. Learn More >
N
Naming Tests
Studies concerning the names of things–new product names, new website URLs, new brand names or even the name of a new film or TV show–naming tests help reveal potential perception issues that can occur. For example, does one title effectively convey what the product or service is? Does the name defy expectations and surprise the user?
Net Promoter Score (NPS)
Net Promoter Score is a widely used customer/consumer experience test that asks a simple question: on a scale of 1-10, how likely are you to recommend this business, brand, product or service to a friend or colleague? Respondents who rate 0-6 are detractors, 7-8 are considered passive and 9-10 are considered promoters. Learn More >
NPS Survey
An NPS Survey asks the Net Promoter Score question to a specified target population. This allows companies to gauge how well they are doing on the NPS scale with their specific target customer or potential customer. Learn More >
Numeric open-ended question
An open-ended question that requires a numeric answer. For example, researchers may ask how much money you’d potentially pay for a product or service. Learn More >
O
Open-ended question
Open-ended questions do not require the respondent to select from a specific list of responses, but instead asks them to type their response into a text box. Open-ended questions, therefore, are less definitive, seeking to gather more qualitative responses, getting at the feelings and broader opinions from the respondent in their own words. Learn More >
P
Package Testing
Studies that provide consumer feedback on product packaging. Would you be more or less likely to buy a product with new packaging? Does the packaging effectively convey what is inside? How do your potential customers feel when they look at your new packaging?
Pre/Post Studies
A pre-post study examines whether participants in an intervention improve or become worse off during the course of the intervention, and then attributes any such improvement or deterioration to the intervention.
Product / Market Fit
Product/Market fit is a the degree to which a particular product meets the demands of the market it is in. Have you created the minimum viable product for your market, that solves a problem or need that exists? Product/Market fit studies aim to survey early adopters or potential customers to see if the product meets previously identified criteria for satisfaction within a market.
Product Testing
A final test of a product, product testing gives users access to a prototype and seeks to identify opinions–positive or negative–of a product before it goes to market.
Q
Qualitative survey question
Qualitative research focuses on personalized behavior, such as habits or motivations behind their decisions. This can be gathered through contextual inquiries or interviews to learn more about feelings, attitudes, and habits that are harder to quantify but offer important additional context to support statistical data. Learn More >
Quantitative survey question
Quantitative survey questions are those that can be expressed numerically, meaning they require respondents to select from a pre-selected list of potential responses. Learn More >
R
Ranking question
Similar to a single-selection matrix, ranking questions ask users to rank different elements of a product or service on a numerical scale. Learn More >
Rating stars
A question where respondents answer using a scale of a number of stars. Learn More >
S
Screening question
Screening questions help researchers ensure they are getting the exact sample they want using filtering that falls outside of available targeting criteria. For example, if you only want to include people in your survey who have seen the movie Pulp Fiction, your screening question would ask potential respondents if they have seen the film, and screen them based on their answers. Learn More >
Single selection question
A question providing a list of potential responses, from which respondents may choose one answer. Learn More >
Slider question
A question where respondents answer by dragging a button across a slider to provide a rating. Learn More >
U
Usability Testing
Usability testing aims to test user experience changes on real users to determine if the experience has been positively or negatively impacted by any changes. Unlike more traditional product testing, usability testing usually focuses more on design changes and more commonly relates to app or software development.
UX Testing
Any testing related to the overall user experience of a product (usually app or software). UX testing tends to be more holistic than Usability testing, running qualitative and quantitative studies of each phase of the user journey.
V
Video question
A question where respondents much watch a video in its entirety before answering.


Section 3: Survey Bias
One of the most important factors in DIY survey creation is avoiding bias. Survey bias reduces data quality, threatening the integrity of your consumer insights.
We have gone in-depth on ways to root out survey bias here. But to fully understand the different types of bias you may have to contend with, here are some helpful definitions.
A
Acquiescence Bias
Also referred to as “yea-saying,” Acquiescence bias occurs when respondents are overly agreeable, to the point of contradicting themselves. You can avoid this by limiting the number of questions asking respondents to simply agree or disagree, as these statements often result in over-agreement. Learn More >
Alternators
Alternators are survey takers that fill in responses in familiar patterns, simply alternating responses but not engaging with the questions. You can avoid this by mixing in some open-ended, audio or video questions. If responses appear to be biased, Pollfish will remove them from your sample. Learn More >
D
Double-Barreled Questions
Double-barrelled questions happen when researchers blend two questions into one, and then allow for only one answer. The respondent must agree in total with a statement they may only partially believe, creating incomplete or biased responses. For example, “Did you find the product interesting and helpful? Yes or no?” Learn More >
E
Extreme Responding
If given the option, some respondents will select only the most extreme option. Make sure to mix up your question types. If you have several scales or rating questions, make sure to mix in some others that require a bit more attention. Learn More >
L
Leading Question
Leading questions use biased language to influence respondents in a direction. Keep questions as simple and direct as possible, taking care to remove any editorializing adjectives that may betray a preference towards one response or another. Learn More >
Loaded Question
Loaded questions make assumptions. For example, asking “what kind of candy do you get when you go to the movies?” assumes the respondent goes to the movies, eats candy and gets candy at the movies. This creates a biased environment where the respondent may not be able to answer accurately. Learn More >
O
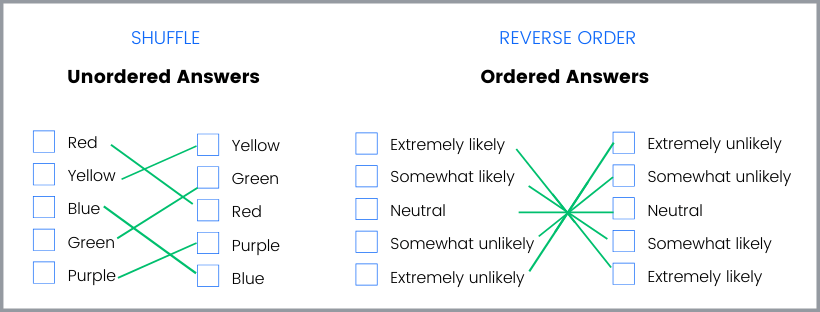
Order Bias
The order you list question responses in a quantitative survey question can bias respondents towards choices higher on the list. If your survey platform has the ability, use answer shuffling to remove the potential for this bias. Learn More >
P
Prestige Question
Inserting prestige into a question by citing an expert opinion one way or another biases the respondent towards the expert’s opinion. For example, “Doctors say smoking causes cancer. Do you agree?” or “Do you support the President’s policy on Zimbabwe?” Learn More >
S
Self-Selection Bias
This occurs when respondents are allowed, through whatever means, to opt out of taking a survey based on its content. This biases the results by oversampling people with a previous interest or overly polarized opinion on a given topic. Learn More >
Social Desirability Bias
This occurs when respondents will attempt to discern what the researchers want them to say and respond accordingly. This often occurs when participants see the brand or topic ahead of time and try to give answers the company or researcher may want to hear. Avoid exposing this information, or asking any leading or loaded questions that may betray an interest. Learn More >
Speeders
Respondents who complete surveys far too fast to have actually read the questions or truly contemplated answers. Pollfish removes these respondents through AI and machine learning algorithms. Learn More >
Stereotype Question
When researchers infuse bias into survey questions, they open the potential for respondents to agree with or defy that bias. If, for example, a survey question reminds respondents that gender stereotypes exist around math, that question may have planted a seed in the mind of respondents that changes responses. Avoid this type of language at all costs. Learn More >
Straight-Liners
When respondents answer using the first available choice for every question. Respondents answering in familiar patterns in order to complete surveys faster will be removed from the Pollfish sample. Learn More >


Section 4: Pollfish Features
Sometimes, we get so excited about the features of Pollfish, we forget to define them all for you!
So we decided to explain them all in one place. Feel free to bookmark this section so you can return to it as you read through resources.pollfish.com.
A
Advanced branching
Also known as skip logic, advanced branching allows you to show respondents different questions based on responses to earlier questions. For example, if a respondent says they have tried your product, you can show them one set of questions and if they have not, you can show them different questions. Branching provides an alternative to screening questions. Learn More >
App Monetization
App monetization refers to the method or methods app publishers use to make money on their apps. There are a variety of app monetization strategies and platforms. Pollfish provides a way for app publishers to immediately monetize their creations by installing the Pollfish SDK and exposing their user base to Pollfish surveys. Learn More >
P
Programmatic Advertising
Programmatic advertising refers to the automated buying and selling of online advertising. Pollfish functions on a programmatic advertising model, delivering surveys in much the same way advertisers deliver ads in apps. Learn More >
Q
Quotas
If a survey must meet a set percentage of participants from an age or gender group, you can set quotas.
R
Radius Targeting
When setting geographic targeting on your Pollfish survey, you can select a city, congressional district or town. You can also use our Radius Targeting tool to select a specific radius on a map to target your survey. Learn More >
S
Skip Logic
Also known as Branching, skip logic allows you to show respondents different questions based on responses to earlier questions. For example, if a respondent says they have tried your product, you can show them one set of questions and if they have not, you can show them different questions. Skip logic provides an alternative to screening questions. Learn More >
Survey Stratification
Stratified sampling involves dividing a population into smaller sub-populations called strata. There are many ways of accomplishing this, including balancing using predetermined quotas before you run your survey, or weighting your results after the fact. Learn More >
W
Weighting
A type of stratification where quotas–often pegged to pre-existing data like a local or national census–are used to weight respondent pools to more accurately reflect the population being surveyed. With Pollfish, you can weight your survey results to the local or national census (where available) with the push of a button. Learn More >

Survey Bias: Your Ultimate Guide To Reducing Bias And Increasing Data Quality


Contents

Section 1: Sampling Bias

Section 2: Questionnaire Bias

Section 3: Survey Fraud

Section 4: Pollfish Can Help!
Survey Bias: Your Ultimate Guide to Reducing Bias and Increasing Data Quality
Survey bias is a broad term. It encompasses all parts of a survey that can have bias. And, in case you didn’t know, there are a lot of trouble spots in the average survey.
But not to worry. Once you know what to look for, and have the right tools to root it out, survey bias will quickly become a thing of the past for your market research team.
But first things first: why should you care?
Put simply, survey bias impacts data quality. By eradicating survey bias (as best you can), you build trust in the data you’ve collected.
That’s no small thing, as companies across the world are using consumer insights data to inform everything from content creation to product timelines to strategic planning.
But where to begin?
Disclaimer: Preventing All Bias Is Impossible
Before we go any further, we should clear something up: no survey is 100% free of bias. Things like the incentives or influences of the questionnaire writer or the words used in various forms of sampling bias can negatively affect results when a questionnaire is distributed to hundreds of users.
Not all bias is preventable, but there are a few key areas and best practices you can use to prevent bias in your survey.
Once you have done everything you can to ensure your survey is taken from a representative sample, has a variety of unbiased questions, and is delivered to real consumers, you will be ready to get great consumer insights.
Let’s start with the basics.
The Different Types of Survey Bias
Survey bias falls into three categories: Sampling Bias, Questionnaire Bias, and Survey Fraud. There are other kinds of bias out there to watch out for (some of which we will get into at the end) but most forms of bias you should watch out for fall into these three categories.

What is Sampling Bias (and How to Avoid It)?
Sampling bias, quite simply, refers to bias that occurs in the selection of your survey respondents, also known as your sample.
There are many different types of sampling bias to watch out for.
Representation Bias
If you select your sample of a town based on a respondent’s presence at the mall, you could be excluding key members of the local population. For example, you may be over-representing healthy people of a certain age who get out of the house, people with the disposable income to shop, etc.
How to avoid it
Digital sampling methods help with this. By collecting responses from users on their phones, through social media or by email, you avoid the types of sampling bias that an in-person surveyor would contend with. If you want to take it one step further, Pollfish Survey Stratification can help (more on that later).
Exclusion Bias
Removing trial participants can create sampling bias. If, for example, your survey requires follow-ups but excludes original participants who have since moved out of the study area, you could skew the results.
How to avoid it
Keep initial and follow-up samples the same.
Pre-Screening Bias
This occurs when you advertise for volunteers within particular groups.
How to avoid it
One way to avoid this would be to reduce targeting on your survey collection method of choice, and instead use screening questions on your survey to screen out people who may not have the qualifications you are looking for.
Survivorship Bias
An over-emphasis on “surviving” respondents can create sampling bias. For example, doing an economic study of the business climate and only including current businesses, without including ones that failed.
How to avoid it
When doing customer satisfaction surveys, for example, it is important to get feedback not just from your current customers–who are likely satisfied–and potential customers–who don’t know how they feel about you–but from your former customers who you likely failed to satisfy. This way, you can truly know how satisfying your product or service actually is.

 How to weigh your survey results in Pollfish
Other Ways to Avoid Sampling Bias
Stratified sampling
Stratified sampling is the process of dividing a population into subgroups and selecting a balanced sample audience from those groups to decrease the sampling error. These populations are usually large and diverse. Because random sampling from a given audience can be unbalanced, stratified samples apply weights to audience characteristics against a control group to ensure that the responses are representative of a given population.
Examples
- If you wanted to survey the population of Dallas, TX, you could weight your survey sample audience demographics against census data for Dallas to create a more accurate reflection of the demographic makeup of that city.
- If you were conducting a political survey and needed representation of various minority groups (such as race or religion) that may not appear in a random sample, stratified sampling could ensure that some members of those groups are included, and their responses adjusted to present a proportional segment of the population as a whole.
Quotas
Quotas are another way to weigh an audience and reduce sampling bias, but instead of applying a weighted number to audience characteristics to estimate proportionality to the population, quotas fix the proportions of an audience so that responses are collected from people who fit the exact criteria. While they typically take longer, quotas offer more precise data. They’re better used for a smaller sample population where the weighted demographics are known.
Examples
- In a survey for a magazine where readership was known to be 80% female, quotas to survey an 80% female audience would be used.
- If a product is geared towards millennials, age quotas might be used to ensure that the survey is only completed by a randomized sample of those between the ages of 25-40.

What is Questionnaire Bias (and How to Avoid It)?
When building your survey questionnaire, the way you ask a question matters just as much as, if not more than, what you are asking.
Questionnaire Bias (also known as Response Bias) can come in many forms. Where most researchers get in trouble is they bias respondents unintentionally, due to how they ask a question, what question type they use, or how they administer the questionnaire.
Self-Selection Bias
Also known as Non-Response Bias, Self-Selection Bias can occur when respondents are allowed, through whatever means, to opt-out of a survey due to its content. For example, not everyone who eats at a restaurant is forced to leave a review. Therefore, most restaurant reviews are biased toward people who had a particularly good or unpleasant experience. You also see self-selection bias when there is a knowledge gap on a topic. If the topic or subject of the survey is known and people can opt-out, the survey will get more participants with advanced knowledge of or interest in the topic or subject.
How to avoid it
You can avoid this type of bias in two ways–you can either remove the ability for participants to opt-out once they’ve seen the brand or topic of the survey, or you can keep the brand or topic hidden throughout the survey.
Acquiescence Bias
Also referred to as “yea-saying,” Acquiescence bias occurs when there are too many questions asking participants to agree or disagree. Respondents tend to overly agree, even when this causes contradictory responses.
How to avoid it
Using a variety of question types will remove this type of bias. Don’t rely too heavily on any one question style. And if you can, review responses and throw out any with deeply contradictory “yea-saying.”
Order Bias
The order in which you list selections in a single-selection or multiple-selection question biases respondents towards choices higher on the list. Similarly, responses change based on the order survey questions appear.
How to avoid it
If your survey platform can shuffle questions and/or responses, take advantage of this feature. You will instantly remove this type of bias from your survey.
Extreme Responding
Some respondents just like extremes. So, if given the choice, they will always select the most extreme option.
How to avoid it
Like acquiescence bias, Extreme Responding is the result of too many of the same type of question. If you are going to use scales or sliders that welcome extreme responses, use other types of questions to gauge user feeling as well. This will give you a more nuanced understanding.
Social Desirability Bias
There are different forms of this bias. For example, participants sometimes believe there is a way in which they are “supposed to” act when taking part in a survey. Typically, this comes from respondents who believe in the importance of research and want to be good subjects, so they will try to discern what the researchers hope will happen in the study and give them the answers they want. Or the respondent will overly report behaviors they believe the researcher may want to hear for other reasons. The most famous example of this is in political polling in the US in 2016, where subjects hid their intention to vote for Donald Trump from pollsters.
How to avoid it
You can start by keeping the brand or topic hidden from participants, and just asking them to respond so they don’t know who the answers are for. Secondly, omit leading or loaded questions that may convey an intent or interest.
Question Types to Avoid
Loaded Questions
Loaded questions make assumptions. For example, “What is your favorite snack when you go to the ballpark?” is a loaded question, as it assumes the respondent likes sports, has been to a ballpark and has eaten snacks at a ballpark.
How to avoid them
Assume nothing. If you want to survey people who enjoy snacks at the ballpark, try a screening question or two. This will ensure you are only asking people who fit the profile.
Leading Questions
Leading questions use biased language to push respondents toward a response.
How to avoid them
Keep questions simple and remove any language that may imply intent. Complimenting or insulting a product or service should be off-limits. If you can, have a friend who is unfamiliar with the subject, review your questionnaire.
Double-Barreled Questions
Double-barreled questions happen when researchers blend two questions into one and then allow for only one answer. This creates a fallacy for the respondent and often results in incomplete or biased answers. For example, “Did you find the product interesting and helpful?”
How to avoid them
Make sure each question asks for a single answer. If you have double-barreled questions, they should be split into two questions, i.e. “Did you find the product interesting?” and “Did you find the product helpful?”

 How to write good survey questions
Prestige Questions
These questions insert knowledge from widely accepted experts into questions, which biases respondents to agree with the expert. For example, “Doctors say smoking causes cancer. Do you agree?” or “Do you support the President’s policy on Zimbabwe?”
How to avoid them
Avoid asking questions beyond the cognitive grasp of the average person. If your question assumes a level of knowledge, use screening questions to remove people who don’t consider themselves knowledgeable. If you provide information on a topic you are asking about, be sure to remove bias from your explanation and only ask participants to respond to the information included. When possible, use multimedia (video, audio, images), as these can be less biased than adding prestige to the information.
Negative Questions
These questions force respondents to remember a traumatic event or think about something negative. Asking about health issues, car accidents, money woes, or even divorce all qualify.
How to avoid them
If these types of questions exist in your survey, you can remove them (as they will bias respondents towards responding more negatively), or you can move them to the end.
Stereotype Questions
Researchers sometimes unintentionally stereotype their respondents. For example, reminding respondents that racial stereotypes exist around driving or that gender stereotypes exist around math ability may bias respondents towards acting more stereotypical, or trying to defy those stereotypes instead of delivering honest responses.
How to avoid them
Remove this kind of language from your survey, and don’t ask respondents to describe themselves by race, ethnicity, age, and the like, unless you have to.
Absolute / Pushy Questions
Questions with Yes or No answers can bias respondents because they don’t allow for any range in between. This may cause respondents to not answer or answer Yes when they mean Only Sometimes. For example, do you eat breakfast in the morning, yes or no? If someone doesn’t eat breakfast 100% of the time, they may answer “No” whereas another person may answer “Yes” because they do sometimes eat breakfast. The result is imprecise and biased responses. Taking this even further, some researchers will make a declarative statement and ask the respondent to agree or disagree (Spain is too hot in the summer, agree or disagree?). This presents bias because survey takers who don’t have a strong opinion will be more inclined to agree with the statement.
How to avoid them
Remove Yes or No questions from your survey. Then, read your questionnaire from a user perspective and remove all statements that may lead the user toward one response or another. Remove all declarative statements, and simply ask questions.
Ambiguous / Confusing Questions
Unclear wording, referring to earlier questions, and using indirect language are just some of the ways researchers confuse respondents. For example, “Was your breakfast not incorrect when it arrived at your table?”
How to avoid them
Read your survey questions aloud. This will allow you to hear how they may sound to a reader. You should be able to spot examples of confusing language.

What is Survey Fraud (and How to Avoid It)?
Traditionally, market researchers would assemble panels– groups of people who have agreed to take surveys. In most cases, panelists were convened in person and offered some sort of semi-lucrative incentive. Think airline miles, gift cards, and even cold, hard cash. Panelists were convened in person, preventing things like panelists from taking the same survey multiple times.
However, researchers eventually sought more randomized sampling. Enter random digit dialing, where an auto-dialer machine would call random people to collect responses for surveys. This reduced bias as respondents were selected at random and screened after the fact.
Then came the internet.

Random Device Engagement and Organic Sampling
Suddenly, research panels re-emerged. Now online, backed by the global reach and offering respondents all over the globe the ability to take surveys for pay, Panels were back with a vengeance.
This incentive structure, combined with the scale of these efforts, created an opportunity for fraud. Survey takers, looking to accumulate as many rewards as possible in as short a period as possible, would take as many surveys as possible, barely reading the questions before providing answers.
While most reputable panels seek to remove these fraudulent responses, panel participation has been on the decline, and panels often fall short of the number of respondents necessary to create a representative sample for their customers.
This requires panels to bridge this gap wherever they can find it by buying samples from wherever they can find respondents. When they lose control of the panel vetting process in-house, they have less information about the respondents, recruitment methods, or whether they are a suitable choice for the survey’s target audience.
But who are these problematic survey takers and how can you spot them?
At Pollfish, we created AI and Machine Learning algorithms to find, locate and remove these fraudulent responses (more on that later.)
If you see these types of responses popping up in your surveys, make sure you get rid of them as they don’t contribute to a representative sample.
Professionals
Sometimes companies pay people to take surveys. The amount per survey is often low, so professionals take a ton of surveys to make money as part of their overall income. These respondents will often have accounts on multiple sites, multiple aliases, etc. Their fast, haphazard movement through your survey can be disastrous to data quality.
How to avoid them
Don’t use traditional panels. Survey platforms like Pollfish deliver your survey inside mobile apps, to active consumers. Respondents receive in-app benefits, not monetary incentives.
Rule-Breakers
Rule-Breakers skip key instructions, offer incomplete responses, or contradict themselves.
How to avoid them
It can be hard to know if this is due to speeding through towards a reward or just a mistake, but either way, if there is too much rule-breaking, it is best to filter them out.
Speeders
Much like professionals, speeders can’t possibly have completed your survey accurately in the time they took. But if you aren’t tracking for this, how would you know?
How to avoid them
Set a time threshold and timestamp respondents. If you find that they moved through your survey too quickly to successfully complete it, filter them out.
Straight-Liners
Straight-liners are some of the easiest fraudulent respondents to catch. These respondents give the same or similar answers to every question. Whatever the first choice is, that’s what they select.
How to avoid them
If you spot this in your responses, or your platform can flag it, remove these respondents as there is a high likelihood their responses are fraudulent or unhelpful to your study.
Near-Straight-Liners
Sometimes survey takers know they may be filtered out and not get a reward if they answer like a Straight-Liner. So near-straight-liners will answer all but 1 or 2 questions in a straight line.
How to avoid them
Same as above. Remove.
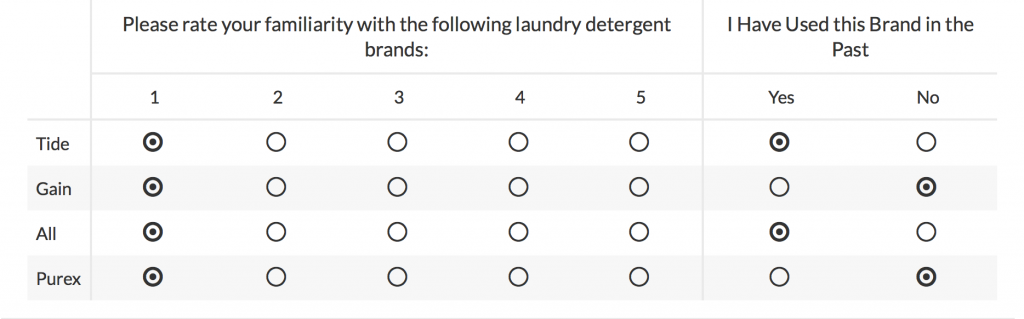
Alternators
Remember the kid in class that didn’t study for the test, so they would just fill in the bubbles on the scan sheet into diagonal lines (think A, B, C, D, C, B, A) all the way down? That kid was an alternator.
How to avoid them
These can be a little harder to spot. It would help if your survey platform could do this work for you.
Bots
For the more computer savvy fraudster, creating bots to take surveys is the easiest way to game the system. While most popular panels have installed protections against bots and have abandoned particularly vulnerable methodologies like River Sampling (using banner ads as a recruitment process without verifiable participant info), these panels may still buy respondents from companies who don’t do enough to protect against bots.
How to avoid them
Find out where your survey respondents are coming from. Make sure none of the providers in your sample are using outdated methodologies like River Sampling. If your survey platform has bot detectors and can throw out common bots, all the better.
Fake Accounts
Just like bots, survey takers will sometimes create fake accounts, allowing them to take the same survey multiple times. Most survey panels check IP addresses to protect against this, however, these protections are easily circumvented.
How to avoid them
Check if your survey platform allows accounts to take a survey more than once or repeat or restart a survey once they have started. Make sure to have a mechanism in place to filter by IP address or look for other patterns that may indicate fake accounts. Surveys that allow link sharing are more likely to suffer from repeated survey attempts, while those that use a randomization method such as RDD or RDE approach the respondents and use a unique identifier to prevent repeats.
Biased Respondents
This last one is impossible to prevent if you are working with a traditional online panel. Forums and other online meeting places allow biased respondents to find pre-recorded answers to your survey shared by other respondents. This allows them to quickly answer surveys without adding their own, natural feedback.
How to avoid them
The internet is a big place and you, as a researcher, cannot easily protect against this. You can prevent survey takers from cutting and pasting inputs, you can prevent screenshots and other measures that prevent sharing responses. But if you want to prevent this problem, it may be best to avoid survey panels all together.


Pollfish Can Help
AI / Machine Learning
Pollfish AI and Machine Learning remove bad survey takers. Read more about that here.
Individual Review
Pollfish individual review (by a person) ensures your survey follows best practices. Each survey you submit is subject to a brief (30-minute) review to ensure you have not egregiously biased your study.
Survey Stratification
Recently, Pollfish launched Survey Stratification, which allows you to tie the weighting of your survey sample to the US Census. With the push of a button, you can weight your respondents to match the Census demographics. This data is available on a national level in the US, as well as in all 50 states. It is also available across the EU and UK, as well as Iceland, Liechtenstein, Norway, and Switzerland. This feature can reduce sampling bias. Read more about this here.

Household Income Levels By Country
Household Income Mapping: Understanding Household Income Levels By Country

Demographic questions are translated and tailored to each country and culture through multilingual surveys and other question differentiators. One of the key differentiators in each country is the income ranges used. To address this properly, Pollfish created an outline based on the appropriate census to show household income levels by country.
USA
| Income Level | Range |
|---|---|
| Lower income I | Under $25,000 |
| Lower income II | Between $25,000 and $49,999 |
| Middle income I | Between $50,000 and $74,999 |
| Middle income II | Between $75,000 and $99,999 |
| High income I | Between $100,000 and $124,999 |
| High income II | Between $125,000 and $149,999 |
| High income III | $150,000 or more |
Argentina
| Income Level | Range |
|---|---|
| Lower income I | Menos de $15,000 |
| Lower income II | $15,000 a $29,999 |
| Middle income I | $30,000 a $44,999 |
| Middle income II | $45,000 a $74,999 |
| High income I | $75,000 a $124,999 |
| High income II | $125.000 a $199,999 |
| High income III | $200.000 o más |
Australia
| Income Level | Range |
|---|---|
| Lower income I | Under AU$15 000 |
| Lower income II | Between AU$15 000 and AU$29 999 |
| Middle income I | Between AU$30 000 and AU$44 999 |
| Middle income II | Between AU$45 000 and AU$74 999 |
| High income I | Between AU$75 000 and AU$124 999 |
| High income II | Between AU$125 000 and AU$199 999 |
| High income III | AU$200 000 or more |
Azerbaijan
| Income Level | Range |
|---|---|
| Lower income I | 25500₼-dan az |
| Lower income II | 25499₼ və 59499₼ arasında |
| Middle income I | 59500₼ və 118999₼ arasında |
| Middle income II | 119000₼ və 178499₼ arasında |
| High income I | 178500₼ və 237999₼ arasında |
| High income II | 238000₼ və 297499₼ arasında |
| High income III | 297500₼ və ya daha çox |
Bangladesh
| Income Level | Range |
|---|---|
| Lower income I | ৳1,275,000-এর কম |
| Lower income II | ৳1,275,000 এবং ৳15,999,999-এর মধ্যে |
| Middle income I | ৳16,000,000 এবং ৳32,999,999-এর মধ্যে |
| Middle income II | ৳33,000,000 এবং ৳49,999,999-এর মধ্যে |
| High income I | ৳50,000,000এবং ৳67,999,999-এর মধ্যে |
| High income II | ৳68,000,000 এবং ৳84,999,999-এর মধ্যে |
| High income III | ৳85,100,000 বা তার অধিক |
Belgium
| Income Level | Range |
|---|---|
| Lower income I | Moins de 22.000€ |
| Lower income II | Entre 22.000€ et 44.000€ |
| Middle income I | Entre 44.000€ et 65.999€ |
| Middle income II | Entre 66.000€ et 87.999€ |
| High income I | Entre 88.000€ et 109.999€ |
| High income II | Entre 110.000€ et 131.999€ |
| High income III | 200 000 € et plus |
Brazil
| Income Level | Range |
|---|---|
| Lower income I | Abaixo de R$5000 |
| Lower income II | R$5.001 a R$10.000 |
| Middle income I | R$10.001 a R$20.000 |
| Middle income II | R$20.001 a R$40.000 |
| High income I | R$40.001 a R$50.000 |
| High income II | R$50.001 a R$60.000 |
| High income III | R$60.001 ou mais |
Bulgaria
| Lower income I | Под 15.000 |
| Lower income II | Между 15.000 и 29.999лв |
| Middle income I | Между 30.000 и 44.999 лв |
| Middle income II | Между 45.000 и 74,999 лв |
| High income I | Между 75.000 и 124.999 лв |
| High income II | Между 125.000 и 199.999 лв |
| High income III | 200.000 лв или повече |
Canada
| Income Level | Range |
|---|---|
| Lower income I | Under C$25 000 |
| Lower income II | Between C$25 000 and C$49 999 |
| Middle income I | Between C$50 000 and C$74 999 |
| Middle income II | Between C$75 000 and C$99 999 |
| High income I | Between C$100 000 and C$159 999 |
| High income II | Between C$160 000 and C$199 999 |
| High income III | C$200 000 or more |
Chile
| Income Level | Range |
|---|---|
| Lower income I | <4.000.000 CLP$ |
| Lower income II | 4.000.000 - 12.000.000 CLP$ |
| Middle income I | 12.000.000 - 20.000.000 CLP$ |
| Middle income II | 20.000.000 - 30.000.000 CLP$ |
| High income I | 30.000.000 - 48.000.000 CLP$ |
| High income II | 48.000.000 - 80.000.000 CLP$ |
| High income III | >80.000.000 CLP$ |
China
| Income Level | Range |
|---|---|
| Lower income I | 10,000¥ 以下 |
| Lower income II | 介於 10,000 到 24,999¥ 元之間 |
| Middle income I | 介於 25,000 到 39,999¥ 元之間 |
| Middle income II | 介於 40,000 到 59,999¥ 元之間 |
| High income I | 介於 60,000 到 89,999¥ 元之間 |
| High income II | 介於 90,000 到 149,999¥ 元之間 |
| High income III | 150,000¥ 元以上 |
Columbia
| Income Level | Range |
|---|---|
| Lower income I | <11.500.000 COP$ |
| Lower income II | 11.500.000 - 35.000.000 COP$ |
| Middle income I | 35.000.000 - 70.000.000 COP$ |
| Middle income II | 70.000.000 - 95.000.000 COP$ |
| High income I | 95.000.000 - 135.000.000 COP$ |
| High income II | 135.000.000 - 230.000.000 COP$ |
| High income III | >230.000.000 COP$ |
Czech Republic
| Income Level | Range |
|---|---|
| Lower income I | Pod Kč 25,000 |
| Lower income II | Mezi Kč 25,000 a Kč 49,999 |
| Middle income I | Mezi Kč 50,000 a Kč 74,999 |
| Middle income II | Mezi Kč 75,000 a Kč 99,999 |
| High income I | Mezi Kč 100,000 a Kč 124,999 |
| High income II | Mezi Kč 125,000 a Kč 149,999 |
| High income III | Kč 150,000 nebo více |
Denmark
| Income Level | Range |
|---|---|
| Lower income I | Under 160.000 kr |
| Lower income II | Mellem 160.000 kr og 320.000 kr |
| Middle income I | Mellem 320.000 kr og 499.999 kr |
| Middle income II | Mellem 499.000 kr og 649.999 kr |
| High income I | Mellem 650.000 kr og 799.999 kr |
| High income II | Mellem 800.000 kr og 949.999 kr |
| High income III | 950.000 kr eller mere |
Ecuador
| Income Level | Range |
|---|---|
| Lower income I | $5,000 |
| Lower income II | $5,001-15,000 |
| Middle income I | $15,001-22,000 |
| Middle income II | $22,001-35,000 |
| High income I | $35,001-55,000 |
| High income II | $55,001-100,000 |
| High income III | >$100,000 |
Egypt
| Income Level | Range |
|---|---|
| Lower income I | أقل من 12.000 ج.م |
| Lower income II | من 12.000 الى 19.999 ج م |
| Middle income I | من 20.000 الى 29.999 ج م |
| Middle income II | من 30.000 الى 39.999 ج م |
| High income I | من 40.000 الى 54.999 ج م |
| High income II | من 55.000 الى 72.000 ج م |
| High income III | أكثر من 72.000 ج.م |
Estonia
| Income Level | Range |
|---|---|
| Lower income I | 840000 € või rohkemAlla 14.400 € |
| Lower income II | 14.400 - 19.999 € |
| Middle income I | 20.000 - 29.999 € |
| Middle income II | 30.000 - 49.999 € |
| High income I | 50.000 - 64.999 € |
| High income II | 65.000 - 84.000 € |
| High income III | 84.000 € või rohkem |
Finland
| Income Level | Range |
|---|---|
| Lower income I | 200 000 € or moreAlle €22 000 |
| Lower income II | €22 000 ja €44 000 välillä |
| Middle income I | €44 000 ja €66 000 välillä |
| Middle income II | €66 000 ja €88 000 välillä |
| High income I | €88 000 ja €110 000 välillä |
| High income II | €110 000 ja €132 000 välillä |
| High income III | yli €132 000 |
France
| Income Level | Range |
|---|---|
| Lower income I | Moins de 22.000€ |
| Lower income II | Entre 22.000€ et 44.000€ |
| Middle income I | Entre 44.000€ et 65.999€ |
| Middle income II | Entre 66.000€ et 87.999€ |
| High income I | Entre 88.000€ et 109.999€ |
| High income II | Entre 110.000€ et 132.000€ |
| High income III | 200.000 € et plus |
Germany
| Income Level | Range |
|---|---|
| Lower income I | Unter €22.000 |
| Lower income II | Zwischen €22.000 und €44.000 |
| Middle income I | Zwischen €44.000 und €65.999 |
| Middle income II | Zwischen €66.000 und €87.999 |
| High income I | Zwischen €88.000 und €109.999 |
| High income II | Zwischen €110.000 und €131.999 |
| High income III | mehr als €132.000 |
Georgia
| Income Level | Range |
|---|---|
| Lower income I | 47,500 ამერიკულ დოლარამდე |
| Lower income II | 47,500-დან 126,199 ამერიკულ დოლარამდე |
| Middle income I | 126,200-დან 252,399 ამერიკულ დოლარამდე |
| Middle income II | 252,400-დან 378,599 ამერიკულ დოლარამდე |
| High income I | 378,600-დან 504,799 ამერიკულ დოლარამდე |
| High income II | 504,800-დან 630,999 ამერიკულ დოლარამდე |
| High income III | 631,000 ამერიკულ დოლარზე მეტი |
Greece
| Income Level | Range |
|---|---|
| Lower income I | Λιγότερο από €15.000 |
| Lower income II | €15.000 έως €29.999 |
| Middle income I | €30.000 έως €44.999 |
| Middle income II | €45.000 έως €74.999 |
| High income I | €75.000 έως €124.999 |
| High income II | €125.000 έως €199.999 |
| High income III | €200.000 και περισσότερο |
Hungary
| Income Level | Range |
|---|---|
| Lower income I | 600 000 Ft vagy kevesebb |
| Lower income II | 600 000 – 1 439 999 Ft |
| Middle income I | 1 440 000 – 2 039 999 Ft |
| Middle income II | 2 040 000 – 2 999 999 Ft |
| High income I | 3 000 000 – 4 199 999 Ft |
| High income II | 4 200 000 – 5 999 999 Ft |
| High income III | 6 000 000 Ft felett |
India
| Income Level | Range |
|---|---|
| Lower income I | Under 50,000 Rupees |
| Lower income II | 50,000 Rupees to 149,999 Rupees |
| Middle income I | 150,000 Rupees to 199,999 Rupees |
| Middle income II | 200,000 Rupees to 349,999 Rupees |
| High income I | 350,000 Rupees to 499,999 Rupees |
| High income II | 500,000 Rupees to 699,999 Rupees |
| High income III | 700,000 Rupees or more |
Indonesia
| Income Level | Range |
|---|---|
| Lower income I | Kurang dari Rp 370.533.000 |
| Lower income II | Antara Rp 370.533.000 dan Rp 741.032.000 |
| Middle income I | Antara Rp 741.032.000 dan Rp 1,111,647,000 |
| Middle income II | Antara Rp 1,111,647,000 dan Rp 1,482,436,000 |
| High income I | Antara Rp 1,482,436,000 dan Rp 1,853,034,400 |
| High income II | Antara Rp 1,853,034,400 dan Rp 2,222,960,200 |
| High income III | Rp 2,222,960,200 ke atas |
Ireland
| Income Level | Range |
|---|---|
| Lower income I | Less than €15,000 |
| Lower income II | €15,000 to €29,999 |
| Middle income I | €30,000 to €44,999 |
| Middle income II | €45,000 to €74,999 |
| High income I | €75,000 to €124,999 |
| High income II | €125,000 to €199,999 |
| High income III | €200,000 and above |
Israel
| Income Level | Range |
|---|---|
| Lower income I | מתחת ל-54,999₪ |
| Lower income II | בין 55,000₪ ל- 499,999₪ |
| Middle income I | בין 500,000₪ ל- 999,999₪ |
| Middle income II | בין 1,000,000₪ ל- 1,999,999₪ |
| High income I | בין 2,000,000₪ ל- 2,499,999₪ |
| High income II | בין 2,500,000₪ ל- 2,999,999₪ |
| High income III | 3,000,000₪ או מעל |
Italy
| Income Level | Range |
|---|---|
| Lower income I | Meno di €22,000 |
| Lower income II | Fra €22,000 e €43,999 |
| Middle income I | Fra €44,000 e €65,999 |
| Middle income II | Fra €66,000 e €87,999 |
| High income I | Fra €88,000 e €109,999 |
| High income II | Fra €110,000 e €131,999 |
| High income III | €132,000 e oltre |
Japan
| Income Level | Range |
|---|---|
| Lower income I | 280万円未満 |
| Lower income II | 280万~558万円未満 |
| Middle income I | 558万円~836万円未満 |
| Middle income II | 836万円~1115万円未満 |
| High income I | 1115万円~1394万円未満 |
| High income II | 1394万円~1673万円未満 |
| High income III | 1673万円以上 |
Kenya
| Income Level | Range |
|---|---|
| Lower income I | Under 200000 KES |
| Lower income II | 200000 KES-500000 KES |
| Middle income I | 500001 KES-800000 KES |
| Middle income II | 800001 KES-2000000 KES |
| High income I | 20000001 KES-4000000 KES |
| High income II | 4000001 KES-6000000 KES |
| High income III | 6000001 KES or more |
Korea
| Income Level | Range |
|---|---|
| Lower income I | ₩190,000,000 미만 |
| Lower income II | ₩190,000,000 ~ ₩349,999,999 |
| Middle income I | ₩349,999,999 ~ ₩499,999,999 |
| Middle income II | ₩500,000,000 ~ ₩649,999,999 |
| High income I | ₩650,000,000 ~ ₩899,999,999 |
| High income II | ₩900,000,000 ~ ₩1,120,000,000 |
| High income III | ₩1,120,000,000 以上 |
Latvia
| Income Level | Range |
|---|---|
| Lower income I | Zem €12,000 |
| Lower income II | €12,000 - €16,999 |
| Middle income I | €17,000 - €24,999 |
| Middle income II | €25,000 - €44,999 |
| High income I | €45,000 - €69,999 |
| High income II | €70,000 - €99,999 |
| High income III | €100,000 vai vairāk |
Lithuania
| Income Level | Range |
|---|---|
| Lower income I | < 3 600 € |
| Lower income II | Tarp 3 600 € ir 4 999 € |
| Middle income I | Tarp 5 000 € ir 9 999 € |
| Middle income II | Tarp 10 000 € ir 14 999 € |
| High income I | Tarp 15 000 € ir 19 999 € |
| High income II | Tarp 20 000 € ir 23 999 € |
| High income III | 24 000 € ar daugiau |
Malaysia
| Income Level | Range |
|---|---|
| Lower income I | MYR 0 - 15,000 |
| Lower income II | MYR 15,000 - MYR 29,999 |
| Middle income I | MYR 30,000 - MYR 44,999 |
| Middle income II | MYR 45,000 - MYR 74,999 |
| High income I | MYR 75,000 - MYR 124,999 |
| High income II | MYR 125,000 - MYR 199,999 |
| High income III | MYR 200,000 + |
Mexico
| Income Level | Range |
|---|---|
| Lower income I | 0 -180,000 Pesos |
| Lower income II | 180,000 - 359,999 Pesos |
| Middle income I | 360,000 – 539,999 Pesos |
| Middle income II | 540,000 - 899,999 Pesos |
| High income I | 900,000 - 1,499,999 Pesos |
| High income II | 1,500,000 - 2,399,999 Pesos |
| High income III | 2,400,000+ Pesos |
Netherlands
| Income Level | Range |
|---|---|
| Lower income I | minder dan €12 499 |
| Lower income II | Tussen 22 000€ en 43 500€ |
| Middle income I | Tussen 43 500€ en 65 500€ |
| Middle income II | Tussen 65 500€ en 87 500€ |
| High income I | Tussen 87 500€ en 109 000€ |
| High income II | Tussen 109 000€ en 131 000€ |
| High income III | 131 000€ of meer |
Nigeria
| Income Level | Range |
|---|---|
| Lower income I | Under 500000 NGN |
| Lower income II | 500001 NGN-3000000 NGN |
| Middle income I | 3000001 NGN-12000000 NGN |
| Middle income II | 12000001 NGN-28000000 NGN |
| High income I | 28000001 NGN-40000000 NGN |
| High income II | 40000001 NGN-50000000 NGN |
| High income III | 50000001 or more |
Norway
| Income Level | Range |
|---|---|
| Lower income I | Mindre enn 200 000 NOK |
| Lower income II | 200 000 – 299 999 NOK |
| Middle income I | 300 000 - 549 999 NOK |
| Middle income II | 550 000 - 799 999 NOK |
| High income I | 800 000 - 999 999 NOK |
| High income II | 1 000 000 - 1 199 999 NOK |
| High income III | Mer enn 1 200 000 NOK |
Pakistan (Pashto)
| Income Level | Range |
|---|---|
| Lower income I | له Rs 144 0000 څخه لږ |
| Lower income II | د Rs 1 444 000 او Rs 4 499 999 ترمنځ |
| Middle income I | د Rs 5 500 000 او Rs 9 999 999 ترمنځ |
| Middle income II | د Rs 10 000 000 او Rs 14 999 999 ترمنځ |
| High income I | د Rs 15000000 او Rs 19999999 ترمنځ |
| High income II | د Rs 20 000 000 او Rs 23 999 999 ترمنځ |
| High income III | له Rs 24 000 000 څخه لوړ |
Pakistan (Punjabi)
| Income Level | Range |
|---|---|
| Lower income I | 1 440 000 Rs ਤੋਂ ਘੱਟ |
| Lower income II | 1 440 000 Rs ਤੋਂ 4 499 999 Rs ਵਿਚਕਾਰ |
| Middle income I | 5 500 000 Rs 9 999 999 Rs ਵਿਚਕਾਰ |
| Middle income II | 10 000 000 Rs ਤੋਂ 14 999 999 Rs ਵਿਚਕਾਰ |
| High income I | 15 000 000 Rs ਤੋਂ 19 999 999 Rs ਵਿਚਕਾਰ |
| High income II | 20 000 000 Rs ਤੋਂ 23 999 999 Rs ਵਿਚਕਾਰ |
| High income III | 24 000 000 Rs ਜਾਂ ਇਸ ਤੋਂ ਵੱਧ |
Persia
| Income Level | Range |
|---|---|
| Lower income I | کمتر از ₪55,000 |
| Lower income II | بین ₪55,000 و ₪999,999 |
| Middle income I | بین ₪1,000,000 و ₪1,499,999 |
| Middle income II | بین ₪1,500,000 و ₪1,999,999 |
| High income I | بین ₪2,000,000 و ₪2,499,999 |
| High income II | بین ₪2,500,000 و ₪2,999,999 |
| High income III | 3,000,00₪ یا بیشتر |
Peru
| Income Level | Range |
|---|---|
| Lower income I | <20.000 PEN |
| Lower income II | 20.000 - 60.000 PEN |
| Middle income I | 60.000 - 90.000 PEN |
| Middle income II | 90.000 - 145.000 PEN |
| High income I | 145.000 - 225.000 PEN |
| High income II | 225.000 - 400.000 |
| High income III | >400.000 PΕΝ |
Philippines
| Income Level | Range |
|---|---|
| Lower income I | Mababa sa PHP 150,000 |
| Lower income II | Sa pagitan ng PHP 150,000 at PHP 299,999 |
| Middle income I | Sa pagitan ng PHP 300,000 at PHP 449,999 |
| Middle income II | Sa pagitan ng PHP 450,000 at PHP 749,999 |
| High income I | Sa pagitan ng PHP 750,000 at 1,249,999 |
| High income II | Sa pagitan ng PHP 1,250,000 at PHP 1,999,999 |
| High income III | PHP 2,000,000 o higit pa |
Poland
| Income Level | Range |
|---|---|
| Lower income I | 0 - 12000 PLN |
| Lower income II | 12001 - 24000 PLN |
| Middle income I | 24001 - 48000 PLN |
| Middle income II | 48001 - 72000 PLN |
| High income I | 72001 - 96000 PLN |
| High income II | 96001 - 120000 PLN |
| High income III | 120001 +Portugal |
Portugal
| Income Level | Range |
|---|---|
| Lower income I | Inferior a 20.000 € |
| Lower income II | Entre 20.000 € 39.999 € |
| Middle income I | Entre 40.000 € 64.999 € |
| Middle income II | Entre 65.000 € 84.999 € |
| High income I | Entre 85.000 € 104.999 € |
| High income II | Entre 105.000 € 124.999 € |
| High income III | 125 000 € ou mais |
Romania
| Income Level | Range |
|---|---|
| Lower income I | Sub 101.995 RON |
| Lower income II | Între 101.995 RON și 203.986 RON |
| Middle income I | Între 203.990 RON și 305.981 RON |
| Middle income II | Între 305.985 RON și 407.976 RON |
| High income I | Între 407.980 RON și 509.971 RON |
| High income II | Între 509.975 RON și 611.966 RON |
| High income III | Peste 611.970 RON |
Russia
| Income Level | Range |
|---|---|
| Lower income I | До 1.700.000 рублей |
| Lower income II | Между 1.700.000 и 3.999.999 рублей |
| Middle income I | Между 4.000.000 и 5.099.999 рублей |
| Middle income II | Между 5.100.000 и 6.799.999 рублей |
| High income I | Между 6.800.000 и 8.499.999 рублей |
| High income II | Между 8.500.000 и 10.199.999 рублей |
| High income III | От 10.200.000 рублей и более |
Saudi Arabia
| Income Level | Range |
|---|---|
| Lower income I | أقل من 36،000 ريال سعودي |
| Lower income II | بين 36،000 ريال سعودي و 83،999 ريال سعودي |
| Middle income I | بين 84،000 ريال سعودي و 119،999 ريال سعودي |
| Middle income II | بين 120،000 ريال سعودي و 179،999 ريال سعودي |
| High income I | بين 180،000 ريال سعودي و 239،999 ريال سعودي |
| High income II | بين 240،000 ريال سعودي و 299،999 ريال سعودي |
| High income III | 300،000 ريال سعودي أو أكثر |
Serbia
| Income Level | Range |
|---|---|
| Lower income I | Испод 2.500.000 RSD |
| Lower income II | Између 2.500.000 RSD и 5.000.000 RSD |
| Middle income I | Између 5.000.000 RSD и 7.500.000 RSD |
| Middle income II | Између 7.500.000 RSD и 10.000.000 RSD |
| High income I | Између 10.000.000 RSD и 12.500.000 RSD |
| High income II | Између 12.500.000 RSD и 15.000.000 RSD |
| High income III | 15.000.000 RSD или више |
Singapore
| Income Level | Range |
|---|---|
| Lower income I | Less than S$15,000 |
| Lower income II | S$15,000 to S$29,999 |
| Middle income I | S$30,000 to S$44,999 |
| Middle income II | S$45,000 to S$74,999 |
| High income I | S$75,000 to S$124,999 |
| High income II | S$125,000 to S$199,999 |
| High income III | S$200,000 and above |
Slovakia
| Income Level | Range |
|---|---|
| Lower income I | Menej ako 12 000€ |
| Lower income II | Medzi 12 000€ a 21 999€ |
| Middle income I | Medzi 22 000€ a 51 999 € |
| Middle income II | Medzi 52 000€ a 71 999€ |
| High income I | Medzi 72 000€ a 91 999€ |
| High income II | Medzi 92 000€ a 120 000€ |
| High income III | 120 000€ alebo viac |
Spain
| Income Level | Range |
|---|---|
| Lower income I | Menos de 22.000€ |
| Lower income II | Entre 22.000 € y 44.000€ |
| Middle income I | Entre 44.000€ y 65.999€ |
| Middle income II | Entre 66.000€ y 87.999€ |
| High income I | Entre 88.000€ y 109.999€ |
| High income II | Entre 110.000€ y 131.999€ |
| High income III | 132.000€ o más |
South Africa
| Income Level | Range |
|---|---|
| Lower income I | Less than R150,000 |
| Lower income II | R150,000 to R299,999 |
| Middle income I | R300,000 to R449,999 |
| Middle income II | R450,000 to R749,999 |
| High income I | R750,000 to R1,249,999 |
| High income II | R1,250 000 to R1,999,999 |
| High income III | R2,000,000 and above |
Sweden
| Income Level | Range |
|---|---|
| Lower income I | Under 225.000 SEK |
| Lower income II | Mellan 225.000 och 450.000 SEK |
| Middle income I | Mellan 450.000 och 675.000 SEK |
| Middle income II | Mellan 675.000 och 900.400 SEK |
| High income I | Mellan 900.400 och 1,125.000 SEK |
| High income II | Mellan 1,125.000 och 1,350.000 SEK |
| High income III | 1,350.000 SEK eller mer |
Switzerland
| Income Level | Range |
|---|---|
| Lower income I | Moins de 40 000 CHF |
| Lower income II | Entre 40 000 et 49 999 CHF |
| Middle income I | Entre 50 000 et 69 999 CHF |
| Middle income II | Entre 70 000 et 99 999 CHF |
| High income I | Entre 100 000 et 129 999 CHF |
| High income II | Entre 130 000 et 249 999 CHF |
| High income III | 250 000 CHF ou plus |
Taiwan
| Income Level | Range |
| Lower income I | NT$ 500000 以下 |
| Lower income II | NT$500001 to NT$899999 |
| Middle income I | NT$900000 to NT$1299999 |
| Middle income II | NT$1300000 to NT$1649999 |
| High income I | NT$1650000 to NT$1999999 |
| High income II | NT$2000000 to NT$4999999 |
| High income III | NT$5000000 以上 |
Thailand
| Income Level | Range |
| Lower income I | 239,999 บาท หรือต่ำกว่า |
| Lower income II | ระหว่าง 240,000 ถึง 479,999 บาท |
| Middle income I | ระหว่าง 480,000 ถึง 719,999 บาท |
| Middle income II | ระหว่าง 720,000 ถึง 959,999 บาท |
| High income I | ระหว่าง 960,000 ถึง 1,199,999 บาท |
| High income II | ระหว่าง 1,200,000 ถึง 1,799,999 บาท |
| High income III | 1,800,000 บาท ขึ้นไป |
Turkey
| Income Level | Range |
|---|---|
| Lower income I | 25.000₺ altı |
| Lower income II | 25.000₺ ile 49.999₺ arası |
| Middle income I | 50.000₺ ile 74.999₺ arası |
| Middle income II | 75.000₺ ile 99,999₺ arası |
| High income I | 100.000₺ ile 124.999₺ arası |
| High income II | 125.000₺ ile 149.999₺ arası |
| High income III | 150.000₺ ve üstü |
Ukraine
| Income Level | Range |
|---|---|
| Lower income I | Нижче ніж ₴120 000 |
| Lower income II | Між ₴120 000 та ₴199 999 |
| Middle income I | Між ₴200 000 та ₴499 999 |
| Middle income II | Між ₴500 000 та ₴999 999 |
| High income I | Між ₴1 000 000 та ₴2 999 999 |
| High income II | Між ₴3 000 000 та ₴3 599 999 |
| High income III | ₴3600000 та більше |
United Kingdom
| Income Level | Range |
|---|---|
| Lower income I | Under £15 000 |
| Lower income II | Between £15 000 and £29 999 |
| Middle income I | Between £30 000 and £44 999 |
| Middle income II | Between £45 000 and £74 999 |
| High income I | Between £75 000 and £124 999 |
| High income II | Between £125 000 and £199 999 |
| High income III | £200 000 or more |
United Arab Emirates
| Income Level | Range |
|---|---|
| Lower income I | أقل من 25,000 دولار أمريكي |
| Lower income II | بين 25,000 و 49,999 دولار أمريكي |
| Middle income I | بين 50,000 و 74,999 دولار أمريكي |
| Middle income II | بين 75,000 و 99,999 دولار أمريكي |
| High income I | بين 100,000 و 124,999 دولار أمريكي |
| High income II | بين 125,000 و 149,999 دولار أمريكي |
| High income III | 150,000 دولار أمريكي أو أكثر |
Uzbekistan
| Income Level | Range |
|---|---|
| Lower income I | $25,000 dan kam |
| Lower income II | $50,000 va $74,999 oʻrtasida |
| Middle income I | $50,000 va $74,999 oʻrtasida |
| Middle income II | $75,000 va $99,999 oʻrtasida |
| High income I | $100,000 oʻrtasida va $124,999 |
| High income II | $125,000 va $149,999 oʻrtasida |
| High income III | $150,000 yoki undan koʻproq |
Vietnam
| Income Level | Range |
|---|---|
| Lower income I | ít hơn 26 triệu đồng |
| Lower income II | từ 26 triệu đồng đến ít hơn 34 triệu đồng |
| Middle income I | từ 34 triệu đồng đến ít hơn 52 triệu đồng |
| Middle income II | từ 52 triệu đồng đến ít hơn 104 triệu đồng |
| High income I | từ 104 triệu đồng đến ít hơn 207 triệu đồng |
| High income II | ừ 207 triệu đồng đến ít hơn 462 triệu đồng |
| High income III | 462 triệu đồng/năm hoặc nhiều hơn |
Zambia
| Income Level | Range |
|---|---|
| Lower income I | Under ZMW 100,000 |
| Lower income II | Between ZMW 100,000 and ZMW 199,999 |
| Middle income I | Between ZMW 200,000 and ZMW 349,999 |
| Middle income II | Between ZMW 350,000 and ZMW 499,999 |
| High income I | Between ZMW 500,000 and ZMW 749,999 |
| High income II | Between ZMW 750,000 and ZMW 999,999 |
| High income III | ZMW 1,000,000 or more |
For more information about Pollfish, or to get more detailed info about your next survey, contact the Pollfish customer experience team today!