
How to Conduct Descriptive Research to Advance Your Business
How to Conduct Descriptive Research to Advance Your Business

Descriptive research is one of the main types of survey research and makes up the majority of online surveys.
Many times, researchers need to conduct descriptive research before they attempt to problem solve, as this sort of research aims to set the scene of a problem. Moreover, it is used prior to an issue being fully realized by researchers, as it is used to probe into the background of a problem.
Because of this, descriptive research is often used as a preliminary research method. However, this is not always the case, as when researchers are fully aware of an issue, they can perform experimental research or correlational research, which can be conducted first.
But in most cases, to fully understand a situation, descriptive research is useful in that it paints a clear picture of the problem, so it is often conducted in the early stages of research, just after exploratory research.
This article offers a deep dive into descriptive research, how it’s conducted and how it can help advance your business.
Defining Descriptive Research
As its name suggests, this form of research seeks to describe the key factors of a problem, phenomenon, situation or the behaviors of a population.
Descriptive research expounds on a population, occurrence or situation that a researcher chooses to or requires to study. As such, it aims on discovering latent details about a particular situation to fully understand it.
A preliminary research method, descriptive research forms the what, how, when and where surrounding a subject of study rather than on the why.
Before conducting research that explains why a phenomenon exists, it is critical to understand that it exists in the first place. It is also important to understand its full context, including particulars you may not have known about before conducting descriptive research.
Descriptive research is conclusive in nature, as the data derived from this research can be used to create statistics and make educated inferences on a target population.
The Key Aspects of Descriptive Research
Now that we have established the core meaning of descriptive research, it is critical to understand its makeup. This form of research has various qualities researchers ought to look into, to better understand its characteristics.
The following enumerates the key features of this research:
- Provides basic details regarding a research problem.
- Performed after exploratory research: it delves deeper into a hypothesis or theoretical idea established in exploratory research, while still being an early part of the overall research process.
- Fills in missing data: this is especially true when exploratory research is first performed.
- Preplanned and structured: Designed for further research around a phenomenon.
- Quantitative in nature: this research gathers numerical data used for making statistical analyses and drawing conclusions in relation to the studied population.
- Incorporates qualitative research: it can also include elements of qualitative research, to describe the research problem thoroughly. This is because descriptive research is more explanatory than exploratory or experimental.
- Uses uncontrolled variables: variables in this research are not controlled, as the researcher’s job is simply to observe and report, but not to interfere with the variables.
- Creates statistical relevance: this method studies a population to draw statistical inferences about it.
- Gateway for deeper research: After the results of descriptive research are collected, they can be used to power further analysis and research methods.
- Cannot make predictions or find causal relationships: it covers the what, how, etc. aspects that can be later used for further research such as experimental, causal and prospective research.
Why Your Business Needs Descriptive Research

Businesses need descriptive research for a variety of reasons. Firstly, it provides additional information about a topic, with details that exploratory research alone cannot. Dovetailing to this is the fact that descriptive research is still a part of the early stages of a research campaign, as it does not explain the “why” around a problem.
Businesses benefit from this research as it is used to measure the opinions, attitudes of your current customers and potential ones, i.e., those in your target market. You can also gather information about their behaviors to help you segment them.
In addition, the information acquired through descriptive research can be used for advanced data analysis that allows business owners and marketers to draw conclusions, segment audiences, measure trends, and make well-informed decisions on how to move forward.
Several common descriptive research surveys include the following list. You’ll notice that these deal with differing topics and purposes, though still fall under descriptive research. As such, descriptive research helps businesses better understand their customers, their employees, their communities and much more.
Descriptive Research Survey Examples
- The NPS survey (Net Promoter Score)
- To understand how likely your customers will recommend your brand or particular product or service.
- The cross-sectional survey
- Studies a particular population at one particular point in time.
- Can help confirm or disprove a hypothesis of, for example, shopping behavior during an ad campaign.
- The community survey
- Ideal for brick and mortar businesses seeking to understand their community and community needs better.
- The employee feedback survey
- Sets the scene on employee sentiment and satisfaction with a business.
- Useful during mergers, acquisitions, growth spurts or simple quarterly reviews.
- The Product satisfaction survey
- Focuses on the product side of a business.
- Helps you business understand how your product is being received, including the presence of any glitches.
How Descriptive Research Differs from Correlational, Exploratory and Experimental Research
Descriptive research differs significantly from the other main types of research methods known as exploratory and correlational research.
Descriptive research is commonly confused with exploratory research. While these two research methods both involve the initial studies of a research process along with identifying a problem or situation, they differ significantly.
Exploratory research provides information about a problem the researcher faces. It is usually the very initial research method researchers turn to. Alternatively, descriptive research pursues describing something, such as its characteristics and functions.
An exploratory research campaign provides the underpinning of upcoming research (usually descriptive research) to discover if the subject of study can be explained by a theory. Unlike descriptive research, exploratory research is not conclusive, as it is not concerned with stats and quantifying data.
Descriptive research, on the other hand, is conclusive in nature, as it is primarily quantitative and focused on forming statistics. It is also rigid and structured, while exploratory research is flexible and unstructured.
Correlational research differs from descriptive research in that it is designed to uncover relationships among variables to see how one may affect another or others.
Additionally, the results of correlational research are used to make predictions of future events from present insights.
On the contrary, descriptive research seeks to create a snapshot of a studied subject and does not involve testing variables, whereas correlational research does and is primarily involved with exploring the relationships between variables.
Experimental research is, like its name implies, highly experimental, as opposed to purely observational, such as descriptive research. Essentially the complete opposite of descriptive research in several regards. Firstly, it is related to correlational research, as it studies relationships between variables, but it takes this concept a step further.
Secondly, it works by interfering with variables. Experimental research involves manipulating variables to come to a conclusion or finding. Unlike descriptive research, it is usually conducted in the final stages of a research project.
Piggybacking off of correlational research, it seeks to find the cause and effect of causal relationships, the kind that correlational research would discover.
Additionally, unlike descriptive research, which answers “what is,” experimental research answers “what if.”
The Advantages and Disadvantages of Descriptive Research
Descriptive research has various advantages for business owners and researchers alike. However, as with any research method, there are a few drawbacks to keep in mind as well.
The Advantages
- Grants a relatively complete illustration of what is occurring at a given time.
- Quantifies and analyses non-quantified issues and subjects.
- Observes a situation naturally, allowing for the observation of variables in their natural environments.
- The least time-consuming quantitative initiative.
- Can use both quantitative and qualitative research techniques.
- Can be used to create new hypotheses, delve into hypotheses and hypotheticals and create new research questions.
- Provides an extensive view of a topic, finding gaps and unknown details.
- Defines and measures data trends.
- Comparisons, ex: how various demographics react with the same and different variables.
- Offers unique data collection, i.e., it can exist in the forms of:
- examining life experiences
- reports
- case studies (including personal accounts of participants)
- surveys
The Disadvantages
- Cannot determine cause and effect relationships, or the causes behind any phenomena.
- Falls prey to survey bias, as respondents may answer questions with answers that are more desirable or in line with social norms.
- Bias can also occur from the researchers’ end when they frame the questions to fit a certain narrative.
- Leaves scarce room for diversity in answers since the question types of descriptive research are close-ended.
Excelling in Descriptive Research
With all the various research types available, it is key to find the most appropriate type for your needs. Descriptive research is invaluable to use in the early stages of your research around a topic, however, it is not the earliest kind to incorporate.
It usually follows exploratory research, which lays down the foundation of a research project, including hypotheses and curiosities that descriptive research can further probe. As there are many ways to conduct descriptive research, researchers need to find concrete means for conducting them.
Surveys are a relatively quick and accessible method for carrying out descriptive research. A strong online survey platform will facilitate the descriptive research process.

How Global Surveys Offer Optimal Research Across Geographies
How Global Surveys Offer Optimal Research Across Geographies
How Global Surveys Offer Optimal Research Across Geographies
In order to conduct research on an international scale, researchers must implement global surveys in their studies.
These surveys allow researchers to amass insights from virtually every geographical location in an efficient way — should the online survey platform that houses them allow it.
With global surveys, businesses and general researchers can understand the attitudes, opinions and habits of those living outside of their country.
It is particularly useful to implement global surveys when conducting a study for thought leadership, given that it arms brands with original data to use in their content marketing strategy. However, they can be used for a number of different purposes.
This article explores global surveys, their use and importance, and how a platform that offers global support and capabilities tailored for global studies will best suit any business. Additionally, this article provides a Pollfish use case for a major study using global surveys.
Understanding Global Surveys
Like their name suggests, global surveys are surveys designed for an international audience and deployed across different countries and continents.
These surveys are developed to gather information from different geographical markets and can be used to compare and contrast the intelligence garnered from surveys deployed domestically.
Global surveys allow businesses to understand their international customers, an increasingly important need, given that most businesses sell online and can therefore be found by those across geographical locations.
These surveys also allow businesses to understand pressing issues across the world and see how the opinions of those issues differ across countries. Thus, this kind of intelligence allows businesses to extract unique data which they can use in their marketing efforts.
Global surveys can be used for major research undertakings, such as the study on stress and smoking rates in low to middle income countries. This study was conducted across 41 countries with a survey sample of 217,561 people. Global surveys provided a strong global reach, along with launching cross-sectional studies and using the results to form prospective studies.
Global studies can also be used for smaller research projects, such as those that only focus on one country abroad or a handful. They can be used on one aspect of a marketing campaign, such as gathering sentiment around a new ad campaign.
The Value and Importance of Global Surveys
These kinds of surveys lend themselves to various research projects, as there are many directions a research endeavor may take.
For example, a business that wants to gain more online traffic from the southwestern region of the US may discover a new segment of their target market: site visitors from a nearby country, such as one from the Caribbean. If this traffic becomes significant, the business ought to conduct primary research into that segment.
In this way, businesses can also seek to branch out into further markets, such as those in Europe or Asia. In order to do so, they would need to extract insights on their global target market, i.e., the segment of the population most likely to buy from a company.
The same concept applies to businesses with an international presence; they may discover physical visits from those outside of a country (i.e., tourists) or digital visits from other countries.
Aside from this sort of perspective, global surveys bring other kinds of value and importance for a variety of studies. The following lists the ways these surveys are both practical and advantageous.
- They can be applied to all six of the main types of research
- This involves retrospective, cross-sectional, longitudinal and perspectives studies.
- They provide ease of access to segments that would be otherwise unreachable.
- This is especially the case for mail-out surveys and phone interviews, which would be far more expensive and difficult to execute.
- A study run by these surveys may reveal results that can apply, or at the very least, be tested on similar target demographics in the domestic sphere.
- They can be used as instruments of comparisons for the same demographics that live in different countries.
- Ex: Irish American middle-aged men versus Irish middle-aged men living in Ireland
- They help cater to the individuality of specific markets.
- They allow businesses to understand cultural matters in a firsthand way.
- They allow businesses to learn how those abroad view key events and products in their home country.
- They bring ambitious research projects in-house.
- They present a critical stage in market research for companies seeking to bring their business abroad.
- This includes keeping a business’s headquarters domestic, but shipping to other countries.
- They allow businesses to obtain international thought leadership.
All in all, international surveys ensure that businesses and researchers meet their international research goals.
How Global Surveys Were Used for a Major Research Project
Global surveys are often conducted for major research undertakings such as the Social Media & COVID-19 global study among Generation Z and Millenials, which was conducted as a joint study by the World Health Organization, two other organizations and performed entirely on the Pollfish platform.
In this global research study, surveys were deployed across 24 countries in an effort to understand how the younger generation consumes COVID-19-related news. As such, these surveys were used as a vehicle for understanding how fake news around a major topic forms.
The study wound up uncovering the presence of an “Infodemic,” that is, unproven claims, rumors and generally false information spreading about the coronavirus pandemic. The infodemedic was itself a kind of epidemic, as false information spreads at lightning speed online.
Thus, this global research study explored where Gen Z and Millennials get their COVID-19 news, who they regard as trusted sources and what their awareness levels are of fake news. Additionally, the study examined their COVID-related concerns and dug into the size of their social media accounts, including their likelihood of sharing unverified information.
This provided concrete information and data for two additional actors in this study: Wunderman Thompson and the University of Melbourne (Australia). This data provided marketing content for these two actors, which other brands can take advantage of, should they use global surveys from a robust online survey provider.
In order to forge strong global research and market research studies, the online survey platform that researchers use must provide various capabilities and relentless quality. The Pollfish whitepaper on the WHO Social Media and COVID-19 study provides a detailed look into how its platform did just that.
The Key Ingredients of a Successful Global Survey Study
In order to reap the benefits of global market research, there are several things researchers will need to apply in their global surveys. First off, the platform you use should allow survey deployment to virtually all countries.
You never know when you’ll need to study a specific geographic market, thus it is best to use a platform that offers an international reach.
The surveys should allow you to conduct the study in the language appropriate to the country (i.e., users) that they'll be sent to digitally. While researchers will be hard-pressed to find a platform that offers survey creation in all languages, it is key to be able to have access to numerous languages as opposed to merely English, Spanish and a handful of other most-spoken languages.
A strong online survey platform — such as Pollfish — offers researchers the capability of creating surveys in 46 languages.
Given that global survey campaigns can be difficult to organize, other aspects of the survey process must be simplified. For example, researchers ought to be given a reasonable completion time of their global surveys. This way, they’ll be aware of the approximate length of the survey and be able to execute time management.
Finally, there are the more technical aspects of the surveys that are just as important (if not more so) in a global campaign as they are in a national one. The surveys should offer relentless quality assurance.
These include offering a granular data filtering system, a mobile-first approach to the surveys in keeping with the current age SaaS integrations, applying the random device engagement (RDE) method to draw the most relevant and quality respondents and other features.
Relying on Continuous Global Support
Global surveys can help businesses gain insights to international markets for a vast array of purposes, whether it be for content strategy, gaining original insights, understanding another segment of your target market or other needs.
However, not all global surveys are built in the same fashion, thus, they don’t all offer the same capabilities. The power of these surveys rests in the online survey platform that hosts them.
Researchers must pay keen attention to all the functionalities of an online survey platform before deciding on the one that can provide optimal quality in global surveys and all matters pertaining to carrying out the research.
A suitable survey tool such as Pollfish, will offer global support, so that you can create, deploy and analyze global surveys with ease without incurring higher costs. Pollfish offers the same costs regardless of the surveys’ targeted countries, fielding research to 160 countries at scale and at speed.
Surveys are available in 46 different languages and include the Translate Survey feature, which makes reaching non-English speakers a seamless process.
Pollfish uses the random device engagement or RDE methodology, a top-notch method for extracting customer data by reaching global digital users in their natural digital environments; this includes some of the most visited websites and apps.
With global support offered around the clock and a strong online survey platform that uses machine learning to remove poor quality data, Pollfish is the most ideal survey platform.

How Explanatory Research Helps You Succeed in Business
How Explanatory Research Helps You Succeed in Business

Explanatory research is a necessary part of the overall research process. It is especially potent when researchers come across a problem that was not well-researched before.
It is formed to allow researchers to become better acquainted with a certain topic, one that was already established at the basic level — the exploratory level to be specific. As such, explanatory research follows exploratory research in the overarching process.
A kind of descriptive research, it provides insight into a certain subject and allows it to be further probed. In fact, it is designed to be the earliest form of descriptive research.
This article expounds on explanatory research, what defines it, its use to businesses, how to conduct it and much more.
Defining Explanatory Research
Explanatory research is a research design intended to explain, as its name suggests, the different aspects of your research study. In this stage of the research process, researchers study what they’ve already identified in exploratory research.
As such, explanatory research provides further details from an established groundwork of study in the previous stage. It is bent on uncovering a problem, phenomenon or occurrence in greater depth.
The subject of the study is not entirely barren of research, as some details exist, but they are minor and require additional research. Researchers ought to be able to adapt to the new information they will come by when conducting exploratory research.
Rather than providing conclusive results around a topic, it enables the researcher to garner insights in the “how” and “why” of the subject at hand.
The following enumerates the defining characteristics of this kind of research:
The Key Aspects of Explanatory Research
In order to conduct explanatory research properly and reap all of its benefits, researchers need to understand its makeup. There are various facets that comprise this kind of research; thus you should be aware of all of them, as this will ensure you conduct it correctly.
In addition, since this kind of research is a kind of descriptive research, it is crucial to be able to tell it apart from its parent category, as it is a distinct form of research.
The following enumerates the defining characteristics of this kind of research:
- The purpose is to increase the understanding of a topic and/or its subtopics.
- Its nature is that of qualitative research, as it seeks discovery of the “why” surrounding the problem/ phenomenon.
- It does not provide conclusive results.
- Given its qualitative nature, it does not prove statistical significance.
- It relies on using both secondary and primary sources of information, with a particular bent on secondary information, as it is already available, thus helping researchers understand key aspects without pursuing their own research just yet.
- The issue in this kind of research is not obviously characterized (in the beginning of it).
- It requires the researcher to become versed in the topic under examination.
- It can be used to form theories and hypotheses.
- It is used before delving into other descriptive research, such as that which focuses on gathering quantitative data.
- This research completes the bedrock of research from exploratory research, as it is needed before completing any subsequent research, such as correlational or experimental research.
Why Your Business Needs Explanatory Research
Explanatory research provides several benefits for market researchers and for the business sphere in general. First off, it completes a missing gap in the overall research process, specifically in descriptive research.
This is due to the fact that explanatory research aims at going beyond describing; rather it is focused on explaining. This involves gathering key insights that form the major ideas behind other forms of research.
Although explanatory research is not scientific like its causal and experimental research counterparts, it peers into cause and effect relationships in that it identifu=ies their scope and nature.
As such, businesses must perform explanatory research to evaluate the impacts of certain changes to standards, processes, techniques, etc.
Moreover, a business can better understand opportunities and threats when incorporating explanatory. Immersing into the specifics of a problem in greater depth allows businesses to understand what needs to be prioritized, decide on what needs to be studied in more depth in correlational, causal or experimental research, and infer on ways to mitigate or resolve an issue.
All in all, a business can benefit from explanatory research when it has an issue that:
- researchers can use to explain why a phenomenon occurs
- was identified in exploratory research,
- was unknown about prior
- was not well investigated before
An Example of Explanatory Research for Business
Market researchers can apply explanatory research to explain why a phenomenon takes place, which they can use to predict future occurrences. Thus, it goes beyond finding descriptions alone and can be conducted either before or following descriptive research.
The following is an example of how a business can use this research:
An electronics business may seek to understand all the factors that contribute to customer satisfaction, in the wake of new product additions. The business would weigh each factor against one another to see how to increase satisfaction along with increasing sales.
As such, the business turns to the various methods to conduct explanatory research, such as using:
- Literature research (secondary)
- Studying each issue in-depth via field research (primary)
- Case study research (secondary but can be primary if it is generated via your own research)
- Random sampling surveys
The explanatory research that the electronics company conducted would reveal how the different factors are contributing to customer satisfaction, if they can extend to other areas and how they can be used to bolster sales.
This research can also look into cause and effect relationships or suspected cause and effect relationships that can be further explored in causal research.
The electronics business discovers that certain new items can be delivered more quickly, thus creating more customer happiness. The company then uses this knowledge to reengineer its shipping, handling and returns process so that it is more efficient.
Explanatory Research Survey Examples
Explanatory research goes a long way in building effective survey studies, as surveys provide a key source of primary research. Explanatory studies are best suited using random sampling methods to avoid survey bias.
Here are a few survey types that researchers can use for this kind of study:
- The qualitative survey
- Helps answer the what, why and how with open-ended questions.
- Obtains the respondents’ explanations needed for this research.
- The customer experience survey
- Helps businesses study variables that contribute to or result from certain kinds of customer experiences.
- Allows businesses to test CX in relation to the responses from this survey.
- The customer satisfaction survey
- Especially useful when bringing new products/services into the market to compare them with previous ones.
- Features 4 subtypes of unique surveys.
- The concept testing survey
- Ideal for researching new concepts or those identified in exploratory research.
- Can be used for various aspects of business.
- The panel survey
- Part of longitudinal studies, it studies the same sample pool over a period of time.
- Provides an explanatory angle, as it gains continual observations on different variables.
How Explanatory Research Differs from Correlational, Exploratory, Descriptive and Causal Research
Explanatory research differs from exploratory, descriptive and correlational research in self-evident ways.
However, it is often confused with exploratory studies. Both of these forms of research are conducted early in the entire research process. However, they differ in several ways.
Exploratory research aims to identify the very foundation of a research problem. It also clarifies problems and forms hypotheses.
Explanatory research, on the other hand, aims to explain issues and come across possible cause and effect relationships to explore later. It also finds theories that can test hypotheses in causal or experimental research.
Although this is a kind of descriptive research, it is a distinct kind and cannot be categorized under all descriptive studies. This is because descriptive research involves studying metrics such as the average, mean, median and frequency.
As such, it is far more quantitative in nature than is explanatory research, which aims to explain, thus, it gathers qualitative research. Additionally, explanatory research is designated to explain rather than solely describe.
Causal research involves finding the cause-and-effect relationships between variables and while explanatory research looks into cause and effect, it does not employ experimentation as does causal research.
Experimental research is fully science and experiment-based and completely divergent from explanatory research. It works to prove or disprove a hypothesis via a scientific approach. example used in the previous selection).
Correlational research, which is also focused on observation and does not apply any alterations or conditioning to the variables, focuses on observing the relationships between variables. Explanatory research, on the other hand, involves studying various aspects and issues.
The Advantages and Disadvantages of Explanatory Research
There are various benefits to applying explanatory research to your research process. However, it also carries a few setbacks. As a researcher, or someone interested in using research to advance business, you ought to know both.

The Advantages
- It allows researchers to discover deeper insight into virtually any topic.
- Deeper insights provide more subtopics and specific issues to be studied in further research.
- It helps identify new business opportunities, as well as latent threats.
- It can help you learn more about your competition whether it is direct or indirect.
- It is flexible in the sources it uses: from focus groups, to various literature, to surveying, to field research and more.
- It creates a higher level of internal validity due to the systematic selection of subjects.
- It reveals the reasons behind a wide scope of processes and occurrences.
- It can evaluate the effect of change on existing norms.
- It is flexible in terms of configuration as well, as it can be conducted after exploratory research or without the need for exploratory research, as well as prior to or following descriptive research.
- Findings can help guide correlational and causal research.
The Disadvantages
- It is not at all conclusive.
- Sample sizes tend to be modest, which is not ideal for a targeted/ specific type of audience.
- It can fall prey to the researcher’s bias with little to no experimentation involved.
- Not all secondary sources are updated and fitting for conducting new research into a previously scarcely-researched topic.
How to Conduct Explanatory Research
Explanatory research is often conducted early on in the research process, typically following exploratory research, although it can be the very first form of research. Since this form of research intends to explain, it can be at times difficult to conduct, or know when you’ve gathered enough information.
The following explains the key steps required to successfully perform explanatory research.
- Find a key issue you discovered in exploratory research.
- Or, you may begin by looking at current issues with little details to them.
- Begin by looking at high-level aspects of an issue by conducting secondary research. Use the following:
- Online literature
- Case studies
- Competitor websites
- Statistics websites
- Then, begin your primary research. It can exist in a number of ways.
- You can perform an in-depth study on each issue and/or phenomenon by zeroing in on secondary sources, or moving on to primary research.
- Use a focus group or interview to understand the subjects involved in the topic of study.
- If you detect any missing information you’d like to pursue, go further by conducting surveys.
- Surveys round off the research process, as they provide unique insights into your customers and prospects.
- Organize your findings into various documents and begin your survey analysis.
Opening New Possibilities
Researchers can discover new possibilities for their study with explanatory research, and the same applies to businesses and market researchers.
While it is not conclusive, this kind of research helps brands understand a situation, occurrence or customer behavior in greater depth. Additionally, it helps researchers refine the hypotheses they’ve made in exploratory research and can even predict future events.
As such, businesses have plenty to gain from conducting this form of qualitative research, which complements descriptive research. A robust survey platform can help bring explanatory research into life, easing the process when combing through cumbersome internet research.

Avoiding Burnout with the Employee Burnout Survey
Avoiding Burnout with the Employee Burnout Survey

The employee burnout survey is a key employee feedback survey that can help reduce the undesirable, yet frequently recurring phenomenon known as employee burnout.
As a business, you are probably well aware of the need to survey your target market. Although lesser-known and thus less often used, surveying employees to reduce burnout is a valuable method to keep your employees happy and your team intact.
While your customers are your bread and butter, your employees are the vessels that steer your ship, aka, your business to success. As such, it is key to pay attention to their needs and concerns as you would with your target market.
Implementing surveys can help achieve these goals, so that your business doesn’t suffer from high burnout rates.
This article explores the employee burnout survey, how it can reduce and avoid employee burnout, keep employees engaged, how to set one up and more.
Defining Employee Burnout
Employee burnout refers to the state of work-induced or work-related stress that many if not all employees endure from time to time. This condition is marked by a state of either or both physical and mental exhaustion, accompanied by a reduced sense of accomplishment and lack of motivation.
Although burnout isn’t a medical diagnosis, it takes a visible toll on employees, as it deters them from performing their best and being content in their job.
There are many factors that contribute to employee burnout, most of them occur due to the overall work environment.
The Causes of Employee Burnout
Employees can deal with many tasks; these can increase if another employee is on PTO, leaves the company or there is a lack of talent available. As such, there are several issues that can go awry or contribute to employee burnout.
Here are several causes of employee burnout:
- Lack of support on the job: Often, some kind of support is expected from higher-ups, managers and other employees. When an employee feels that they are lacking support, it can make them feel isolated and depressed, bleeding into their work performance.
- Lack of resources: Some jobs require ancillary tasks in addition to employees’ main jobs, yet not all workplaces provide the full resources to complete them. For example, let’s say an employee needs to hire freelancers, but does not have the means. This clearly hampers their ability to carry out their job, leading to burnout.
- Unclear job expectations: Often due to a lack of communication or proper input, some employees may discover they have responsibilities or subtasks that were not made clear to them. In turn, the employee suffers, as they won’t meet expectations, at least not as soon as an employer or the employee themselves would aim for.
- Toxic employees: Some employees may bully, ignore or treat others in an unkind way. This behavior is unpleasant and can lead to feelings of rejection and loneliness, along with heaps of stress.
- Tight deadlines: While most projects have deadlines, there are many occurrences that can delay progress, therefore hampering the meeting of deadlines. As such, it can cause burnout, which further delays job completion.
- Little to no work-life balance: When work consumes so much of employees’ time that they can barely fit anything else (doctors’ visits, time with loved ones, etc.), they become overwhelmed. It is perturbing to be overcome with work to the point where employees cannot live a well-balanced life.
- Overworking: One of the major causes of employee burnout is overworking. Whether or not employees are meeting deadlines, sometimes, the volume of the work becomes overbearing. This creates exhaustion and a feeling of depletion within employees.


The Many Consequences of Employee Burnout for Your Business
If the damaging effects of employee burnout weren’t incisive enough in the Defining Employee Burnout Section, the following will.
Employee burnout reached a new high in 2020 and is showing no signs of abating just yet. This is detrimental to businesses and not just at an employee level. This can become an HR nightmare, as burned-out employees tend to leave their job.
The most grave consequence of employee burnout is its effect on employee retention: 42% of workers quit their job due to employee burnout. The statistic grows to almost 50% when it concerns burned-out millennials.
Here are a few other consequences of employee burnout for businesses:
- Unmotivated and indifferent employees, who care little about the success of the company.
- Irritable attitudes that create more hostility and toxicity in the workplace
- Exhaustion that leads to underperformance
- Inclinations towards sarcasm, anger or confrontation
- Absenteeism on the job or in job culture activities
- Bad reviews on the internet about your work culture and overall company
- High turnover requiring more recruiting efforts and the loss of valuable employees
- A bad reputation of your business
Evidently, businesses ought to steer clear of employee burnout and distinguish it at every turn. Surveys can help fulfill this goal.

Understanding the Employee Burnout Survey
The employee burnout survey, as its name suggests, is a type of survey meant to identify and gauge employee burnout, along with any occurrences or sentiments that can contribute to burnout.
Detecting the latter can help prevent employees from developing full-fledged burnout, as the insights this survey provides help employers and HR workers foster positive change.
As for the latter, this survey can help extinguish existing employee burnout, so that it does not become incendiary enough to cause employees to quit.
As such, this survey is a kind of employee feedback survey, as it gathers employee commentary, critique and the like — but specifically themed around employee burnout.
This kind of survey can be explicitly configured around the theme of employee burnout, that is, introducing respondents to this topic, with questions that specifically mention this topic. Or, it can be set up more implicitly, with the topic and term reframed, thus not mentioned directly.
The latter is useful when you aim to be more discreet, as some employees may feel uncomfortable with plainly disclosing their feelings of discomfort and burnout from work.
How to Set Up an Employee Burnout Survey
You can set up an employee burnout survey by either of the two main methods described in the previous section. To understand your employees better and minimize burnout, it is useful to regularly conduct these surveys.
You can begin with the first method (explicitly mentioning employee burnout) and then deploy these surveys more secretly using the second method (not mentioning the term) — or the other way around, or with any cadence and frequency you choose.
Since both of these survey methods are based on employee burnout, you’ll find that some questions can be applied to both or used interchangeably.
How to Set up an Explicit Employee Burnout Survey
Your survey should have a callout that specifically states that the survey is themed on/ measures employee burnout. This way, employees will understand this outright.
Here are the key questions to include in this employee burnout survey method:
- Have you ever experienced burnout in this job?
- Answers: [Yes, No]
- If yes, add an open-ended question to probe further and allow employees to describe their burnout experiences.
- What is/are the most stressful aspect(s) of your position/ working at [company name]?
- Answer examples: [Time management, work overload, other ideas to maintain objectives, difficulty maintaining my objectives, issues with another worker, etc.]
- Use skip logic to transfer any answer to an open-ended question that asks to elaborate on this.
- What could we do to help you diminish employee burnout?
- Answer examples: [Lessen the workload, create more collaborations, offer more mentorship, other]
- Add an open-ended answer option to understand exactly what employees need.
- Have you ever taken a sick day due to employee burnout?
- Answers: [Yes, No]
- If yes, use skip logic to route employees to multiple-choice, multiple selection questions to tick off all reasons as to why they did so.
- Add an option for an open-ended answer at this step.
- How many days have you worked during after-hours or off days because you could not finish during work hours?
- Answers: Never
- 1-3 days
- 4-6 days
- Over 6 days
How to Set up an Implicit Employee Burnout Survey
If you want to discover the presence of employee burnout in a stealthy manner, avoid using the term throughout the survey.
Even if the survey is anonymous, employees still may feel uncomfortable divulging their feelings in relation to employee burnout for fear of losing their jobs or being frowned upon by their managers.
Here are the key questions to include in this burnout survey method:
- Have you ever come upon any stress in this job?
- Answers: [Yes, No]
- If yes, add an open-ended question to probe further and allow employees to describe their experiences via the keyword “stress” as opposed to burnout.
- How often do you experience stress on the job?
- Answers: Seldom
- Every now and then
- Once a month
- Several times a month
- Several times a week
- Allow employees to elaborate on how they experience stress and its frequency in an open-ended question following this one.
- What is/are the most stressful aspect(s) of your position/ working at [company name]?
- Answer examples: [Time management, work overload, other ideas to maintain objectives, difficulty maintaining my objectives, issues with another worker, etc.]
- Use skip logic to transfer any answer to an open-ended question that asks to elaborate on this.
- What could we do to help you feel happier at work?
- Use an open-ended answer option to understand exactly what employees need, as this question is too broad.
- How many days have you worked during after-hours or off days because you could not finish during work hours?
- Answers: Never
- 1-3 days
- 4-6 days
- Over 6 days
Improving All Work-Related Issues
Like all work-related issues, employee burnout is a work in progress. Even when you’ve reined in employee burnout (you would know this via survey campaigns) it can creep back up again.
This is because the workplace — or work hours — if your team works remotely, is a living environment. Personalities may clash, new assignments may come unexpectedly (especially if you produce work for clients) workloads may waver and there is nothing that can fully suppress surprises, be they good or bad.
Therefore, you need to evaluate your employees on a regular basis to ensure that they are satisfied at work, feel appreciated and aren’t affected by burnout, let alone overwhelmed by it. The most effective and insights-driven way to accomplish this is by deploying employee burnout surveys on a powerful online survey platform.

Content Marketing Questions to Improve Your Content Strategy
Content Marketing Questions to Improve Your Content Strategy
 Content marketing questions form the bedrock of a content marketing strategy that uses survey studies as a means of primary research. It is the questions themselves that make up the core of a survey, so they must be relevant to the content marketing studies you conduct.
Survey data that is gathered using content marketing questions can provide vital information about your users’ needs and opinions so you can create content that drives traffic, and conversions along with fostering customer loyalty.
Content marketing questions can be used to ensure your company’s content is meeting the needs of your audience. Additionally, these questions can be used before planning your content marketing strategy and initiating content creation efforts to the likelihood that your materials will be well-received by your audience.
The right content marketing questions can make a major difference in the success of your content strategy. This article provides several content marketing questions to get you acquainted with your first content marketing strategy survey.
Questions on Your Audience's Pain Points and Needs
It is important to provide content that addresses the needs of your prospective customers. Whether they are simply in the exploratory phases or actively looking to purchase your company’s product or services, the appropriate content can guide them in the right direction.
By understanding your audience’s pain points and needs, your team can create content that will address these needs and, ideally, mitigate pain points before they occur. Here are some content marketing questions to ask:
- What types of content would be most helpful to you when considering a new [insert product or service category here] for your company?
- Multiple choice: Deeper explanations of product features, descriptions of technical requirements, high-level overview of the product, and explanations of how the product/service can improve internal processes.
- Or, use a text entry field to allow for open responses.
- How important are each of the following content types to your business?
- Matrix response: In the first column, list existing content publications that your business provides. Across the top, the options can be: Very important, important, somewhat important, or not important.
- Based on your current workload, do you have time to stay abreast of developments in your industry by consuming content (for example, articles, videos, or podcasts)?
- Binary: Yes, no
- How much time per day do you currently spend learning about new products or technology?
- Multiple choice: (0-30 minutes/week, 30-60 minutes/week,1-2 hours/week, more than 2 hours/week)
Questions on How Content Influences Content Consumption Behavior

At the end of the day, we want our customers to read and enjoy our content in the hopes that they will eventually make a purchase or recommend our company to a friend. This can be harder to research since it may involve actions that occur offline and are thus difficult to track.
By asking the right content marketing questions, however, you can learn how your content may or may not currently influence offline behavior. By understanding this, you can formulate relevant and compelling content in the future. Questions to ask include:
- Have you ever purchased from a company after consuming a free publication that was offered to you?
- Binary response: Yes, no
- Please indicate which of our content broadcasts you currently subscribe to:
- Multiple choice with multiple selections allowed: Podcasts, blog, newsletter, YouTube channel, Instagram channel, Facebook page
- How likely are you to recommend business content to a friend or colleague?
- If you use Net Promoter Score, the response should be provided on a scale of 1- 10 (10 being the highest).
- Alternately, the response can be multiple choice: I often recommend your content, I may recommend your content if I see something interesting, I am unlikely to recommend your content
Questions to Understand the Impact of Content on User Decision-Making
The purpose of content marketing is to improve the visibility of the products and services your company offers, while enhancing the “know, like, and trust factors” that make it more likely for a prospect to convert.
To provide content that is likely to have a positive impact on decision-making, you must know the kinds of content your target audience craves, along with the kinds that drive it away.
Try asking the following content marketing questions to enhance your content creation process:
- Did the video series we delivered to you help support your decision to purchase our product?
- Binary: Yes, I decided to purchase after watching the videos, No, I did not find the videos helpful.
- Did this article help you understand the difference between our subscription tiers?
- Binary: Yes, no
- Of the following content publications that we have available on our website, please select the most appropriate response for each one.
- Use a matrix. In the first column, list out the publications available to consumers (e.g.: white papers, help manuals, videos showing how the product is used). Across the top, write out options such as: I did not use this, I read/watched this and found it helpful, I read/watched this and found it lacking.
- What content format are you most likely to use when researching a new product or services?
- Multiple choice: Blog posts, videos, podcasts, newsletters, infographics, webinars
- Matrix response: List out content types in the first column. Label the rows across the top: Very likely to consult, Likely to consult, Very unlikely to consult, Definitely would not consult
Questions about Published Content

Content can be used to enhance the overall public perception of your business or industry. To create content that addresses existing concerns or highlights your company as an industry leader, you should ask content marketing questions about their existing opinion of content that has been published. Questions to ask include:
- Please select the appropriate response to indicate how you feel about the following content formats:
- Use a matrix to list existing or proposed content formats (e.g. blog posts, white papers, newsletters, videos, podcasts, etc.) in the first column. Then across the top, use responses such as: Love them / Like them / Neither like nor dislike / Dislike them / Hate them.
- How do you feel about our interactive content?
- Multiple choice: I find interactive content interesting and educational, I think interactive content is fun, but not very informative, I don’t enjoy interactive content.
- Which devices do you currently use to consume content? Select all that apply.
- Multiple-choice with multiple selections allowed: Smartphone, computer, tablet, eReader, MP3 player.
- What other types of content would you like to see our company publish?
- Text entry field.
Use Surveys to Enhance Content Marketing Efforts
Content marketing surveys are one of the most exciting ways to gauge the success and potential of your existing content marketing efforts, along with dictating how to successfully build new ones. As such, all businesses should consider making routine surveys part of their ongoing content marketing plan.
This allows you to routinely check in with your audience to ensure your efforts are on track or course-correct as needed. The use of online survey platforms makes it easier than ever to connect with your audience and gain this valuable information.
You can simplify your efforts by choosing a strong survey platform that allows you to auto-generate questions based on content that your audience has viewed.
Whether you decide to conduct a comprehensive content marketing survey before you create a content plan or deploy surveys on a routine basis, the right content marketing questions will yield valuable information that can guide your efforts.
Frequently asked questions
What are some types of content marketing questions that researchers can use?
Researchers can use content marketing questions as multiple-choice questions to better understand product features or descriptions of technical requirements. They can also be used as matrix responses, binary responses, or open-ended questions.
Why are content marketing questions important in market research?
Businesses want their content to convince customers to make a purchase or create brand awareness. However, it can be challenging to track such actions as many marketing efforts occur offline too. Therefore, businesses can learn how content may or may not influence offline customer behaviors with the right content marketing questions.
What questions about published content should researchers ask?
Content marketing questions should address customers' experiences, preferences, likes, and dislikes as they pertain to the content. The questions in this kind of survey should ask respondents about their opinions on content that has already been published, whether recently, or long ago.
How does content impact users' decision-making?
Content marketing aims to increase your company offerings' visibility while enhancing the "trust, like and know factors" that increase prospects' chances to convert. To provide valuable content that can impact decision-making positively, it is imperative to be aware of the kinds of content that your intended audience craves, along with the types that drive them away.
How can surveys enhance content marketing efforts?
When it comes to gauging the success of your content marketing efforts, surveys are an excellent way of discovering your prospective customers’ potential, dictating how to attract them better. Additionally, you can streamline your efforts by selecting a robust survey platform that enables you to automatically generate questions depending on the content that your visitors have viewed. This also presents you with an opportunity to frequently check in with your customer base to make sure that your efforts are going as planned, making it easier than ever to interact with your audience and get valuable insights.

Maintaining a Market Research Budget with a Platform of Relentless Quality
Maintaining a Market Research Budget with a Platform of Relentless Quality

While many businesses rely on a set marketing budget, few allocate funds specifically towards a market research budget. This is troubling, as it shows that budgeting for market research is secondary if not completely swept under the rug.
When businesses aren’t heedful to a market research budget, they either fall behind on their market research needs or wind up over-spending — and it shows in the numbers, as businesses spend up to $50,000 on market research alone.
But does high marketing spend yield considerable profits for businesses? Are they obtaining a steady ROI on their investments? And most importantly, are their market research investments bringing them any value?
This article delves into the market research budget and how a market research platform that offers relentless quality can support it to its maximum potential.
Understanding the Market Research Budget
Despite the importance of market research, many businesses forgo budgeting towards it, which can carry several consequences, including the aforesaid risks of over-spending or ignoring market research in its entirety.
First off, it is crucial to fully understand the market research budget along with its associations.
A market research budget is a portion of designated funds set aside for market research specifically. In regards to its portion aspect, this budget itself is a portion of a marketing budget, which includes all the subsets of marketing, specifically the kinds that are used by a business, as not all businesses will use the same marketing functions.
The following lists several key components of a marketing budget:
- Market research
- Advertising
- Branding
- Brand tracking, brand equity
- Public relations (PR)
- Website development and redesign
- Website management
- SEO and SEM
- Content marketing
Market research requires its own budget, given its importance to a business’s success and the various market research techniques, components, tools and methods. Much like with a marketing budget, not all businesses will require all using all the items in this budget.
The following enumerates the key considerations in a market research budget:
- Qualitative market research
- Quantitative market research
- Syndicated research
- Field Research
- Focus groups
- Interviews
- Survey panels
- An online survey platform
Market Research Budget Recommendations Vs. Actual Market Research Expenditures
The overall expenditure in a market research budget is chiefly dependent on the business that intends to conduct market research. However, there are still some recommendations and guidelines for setting up a solid market research budget.
Firstly, businesses should design a marketing budget, as this is the encompassing budget that will include all market research plans. As such, businesses should settle on a specific amount to cover all of their marketing-related activities.
Beginning at the broader marketing budget level, the U.S. Small Business Administration recommends a marketing spend of 7-8% for businesses, that is, if a company has a net profit margin of 10-12% after all expenses.
This recommended range, however, is not the reality for businesses across various verticals. Businesses are allocating between 8-12% of their funds towards marketing, according to a study by the marketing insights firm CMO Survey.

High-growth technology companies and SaaS businesses in particular, run the highest expenditures, with a whopping 80-120% of their revenue being funneled towards marketing.
As far as market research spending in particular, there are specific spending guidelines for different market research assets. According to marketreseach.com, researchers should divide expenditures for projects based on these assets in the following categories:
Full-Market Reports $1,500 – $8,000, most commonly $3,500 – $4,000)
Product Detail Market Reports $15,000 – $35,000
However, both syndicated research and custom research providers can offer subscription-based services that can run businesses into plans in the tens of thousands. In fact, some market research projects cost up to $100 thousand, with average costs existing in the $35-55,000 range.
Evidently, businesses spend too much on their market research efforts, exceeding many of the recommendations of a marketing and more specifically, a market research budget.
Unused and Underused Data
Given that the recommendations for a market research budget and the reality of business expenditures do not line up, businesses have to rethink their market research budget. But most importantly, businesses must reconsider their entire market research efforts.
Why is that? Because while many businesses claim to be data-driven and even go so far as to assert that they use agile data, their data provides very little use. This is because, in an attempt to prove these claims, businesses amass large quantities of data that is left unused.
Also known as dark data, most of the data that businesses collect, be it via market research, web analytics or other means, goes unused. 68% of data is not used by businesses who invest in it — that’s over two-thirds of data gone to waste.
But there’s much more to data than the data itself, which is often the result of a market research project. That’s because dark data is a manifestation of wasted efforts. When businesses have two-thirds of underused or unused data, the following has essentially been squandered:
- Planning
- Meetings across teams and within departments
- Finding a market research method
- Finding a market research tool
- Money allotted towards the research
- Time spent conducting the research
- Survey data analysis (if the data was slightly used, but not to its full potential)
There is a major disconnect between the data that a business thinks it needs and the data it uses when over two-thirds of data is never looked at or underused. But the chief concern, in this case, is what the point was in actively planning, amassing and retrieving data when most of it goes unused.
Only a market research platform that is heavily focused on the quality of the research can resolve these issues. Therefore, such a platform optimizes all aspects of its market research techniques.
Relentless Quality to Fortify a Market Research Budget & Remedy Unused Data
A market research provider, such as an online survey platform can avoid poor market research budgeting, gaps in data usage and even the accuracy of the extracted data. But it must provide relentless quality.
Unfortunately, swaths of online survey tools account for the 68% of dark data (percentage of unused data) that they provide for businesses. These platforms are not all designed to suit a market research budget, especially their enterprise plans, which can run for thousands of dollars a month.
Effectively, the patrons of these market research providers are spending thousands on their data a month and exceeding maximum expenditures on research budget guidelines — all while abandoning 68% of their data.
In turn, dark data goes beyond exhausting the funds in a market research budget, as it creates damage in an overall market research campaign. This damage to market research includes:
- Inaccurate and bias-riddled data
- This is because researchers must analyze all of their data, certainly not just 32% of it.
- An enlarged margin of error
- Being a poor representation of a target market with no basis for statistical significance
- An incapability of making informed predictions and perform prospective research
- Difficulty to take action or make changes

When a survey platform or other market research provider offers an approach with relentless quality, it can avoid and overcome all of these obstacles. Thus, such a platform can avoid unused data and a waste of time, money, resources, et. al.
A platform that offers relentless quality brings first-rate quality to all aspects of the research process — from a massive network of publisher sites and apps to the dashboard of the platform, to the way the data is collected and presented.
When all points of the research provide optimal quality, researchers and the businesses they work for are not left wondering what went wrong, which answers are faulty, why it takes a long time to aggregate the data and more.
Thus, researchers can set up a market research budget properly and actually be able to adhere to it without compromising the quality of their research.
Deciding on a Market Research Platform that Provides Relentless Quality
When opting for a market research provider, businesses ought to turn to a provider that offers relentless quality through a number of ways. The Pollfish platform delivers on the promise of relentless quality.
First off, businesses can maintain a market research budget while performing various campaigns, as the Pollfish platform is one of the most affordable ones in the online survey platform niche.
The platform deploys surveys in a vast network of top online sites and apps and does so with a mobile-first agile data approach. Businesses, therefore, gain quick results even when distributing surveys to a large sample size, such as one with thousands of respondents.
The data is processed with artificial intelligence and machine learning to avoid survey fraud, biases, low-quality answers, the margin of error and other issues that mar the quality of the data. Thus, the data itself is of a high quality.
It is presented on a user-friendly dashboard that makes it easy to interpret the data. Thus, this is going to be seen as less of a chore that market researchers put off… and off, indefinitely. Researchers can also integrate Pollfish with other SaaS providers should researchers prefer to consolidate their data analysis.
When the data is quickly extracted, avoids faulty respondents and is easy to deploy and use, businesses are naturally more likely to use it. Thus the Pollfish platform offers an augmented survey experience, one that suits many market research budgets and campaigns at large.
Frequently asked questions
Why is having a market research budget important for businesses?
A market research budget should be derived from an overall marketing budget because a lack of research may lead to overspending or inefficient allocation of resources.
What are some key considerations in a market research budget?
The key characteristics of a market research budget include expenditures in qualitative research, quantitative research, field research, focus groups, interviews, survey panels, and online survey platforms.
How should businesses set up a market research budget?
First, determine the overall marketing budget because research would go under this banner. Next, identify your objectives. Know what kind of information you need, if it's proactive or reactive, and who gets to use this info. After that, study available market research and reports to see if they fulfill your informational needs. And finally, report these findings to the decision-makers to prioritize market research as one of their financial goals for the upcoming year.
What are the consequences of unused data in market research?
Unused data may lead to inefficient planning, money wasted on market research, and unnecessary meetings. It may even skew research results causing further damage. Therefore, businesses should know the difference between knowing how much data they need and how much data will be left unused once they've used it.
What should businesses consider when deciding on a market research platform?
A robust online survey platform should offer a myriad of features and draw out quality data. Moreover, it should be fully customized for the questionnaire and screener, deploy the survey to intended individuals, seamlessly filter the data once the survey is completed, and leverage artificial intelligence to carry out quality checks that eradicate poor quality data. The platform should also provide valuable customer data and insights with several easy-to-use question formats, advanced skip logic, RDE, mobile-first design, etc., enabling a business to make data-driven decisions.

Diving Into the Customer Effort Score (CES) Survey
Diving Into the Customer Effort Score (CES) Survey
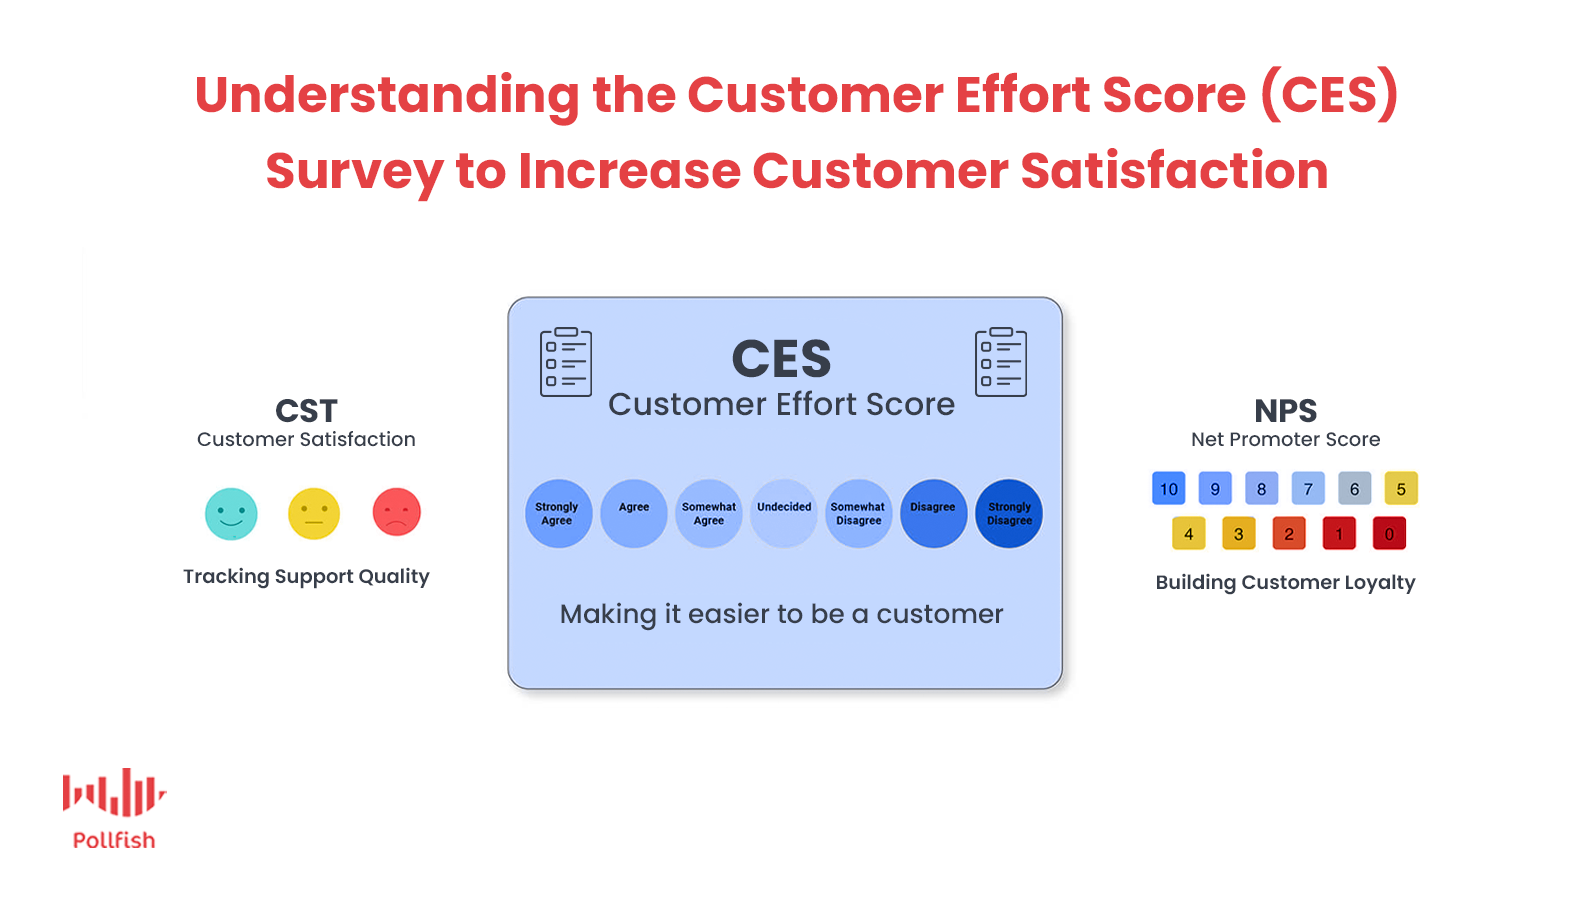 The Customer Effort Score survey, or CES survey, is one of the foremost customer satisfaction surveys. As a business owner or marketer, you ought to know that customer satisfaction holds colossal importance for your business.
It can help drive customer loyalty, the key force behind retention, which ensures your customers return to your business instead of making one-time only purchases. Additionally, when brands produce high levels of customer satisfaction, they are increasing their customers’ Customer Lifetime Value (CLV), which incites higher value from customers.
Furthermore, customers want to know that their input is collected and valued, as 52% of worldwide customers believe that businesses need to take action on their feedback.
The CES survey is a potent survey tool to assess customer satisfaction — but it takes a very specific angle — that of measuring customer effort.
This article delves into the CES survey, explaining customer effort, why it’s important to measure it and all other key information so that your business makes the most out of this survey type.
Defining the CES Survey
Like its name implies, the Customer Effort Score survey measures customer effort, which is the degree or amount of effort that a customer puts into a certain interaction with a company.
Specifically, the CES survey is a survey that calculates the eponymous Customer Effort Score, a key customer experience metric that gauges customer effort.
Understanding Customer Effort
Customer effort refers to the degree of difficulty a customer has undergone to try to get an issue resolved. Additionally, it also generally refers to the ease (or difficulty) that a customer experienced with a certain service or experience with a company.
Understanding the Customer Effort Score
The Customer Effort Score is the heart of the CES survey. A customer experience (CX) score, it asks customers to rate the ease of completing an action — the customer effort in question; this is usually expressed on a scale of either “very difficult” to “very easy.”
The Customer Effort Score has a flexible setup: it can be derived from a scale of 1-5 and 1-7; it can be numeric and text-based.
There are 2 versions of the CES scale:
- In the older version, a 5-point scaled question asks: “How much effort did you use to complete this task?”
- In this scenario, 1 represents a very low effort, while 5 represents a very high effort.
- Thus the lower the number, the better the CES score, while a higher CES score meant more difficulty, therefore a bad score.
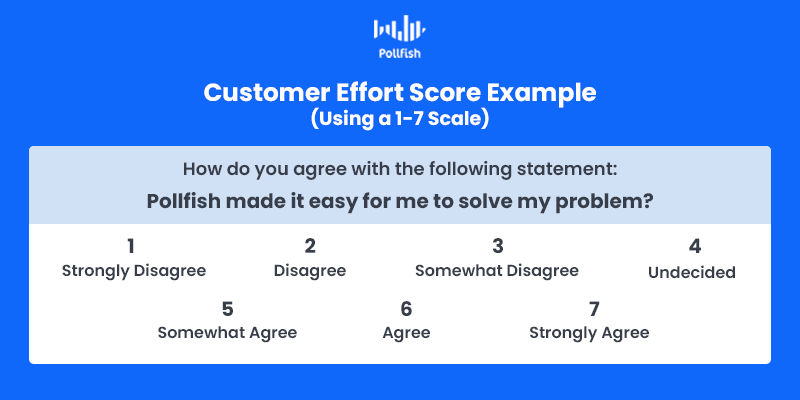
- In the newer version, a 5 (or 7, or 10-point) scaled question asks: “How much do you agree with the following?: The company made it easy for me to handle my issue.”
- This version presents a disagreement/ agreement rating scale.
- 1 represents “strongly disagree” while 5 or 7 represents “strongly agree”, so the scale is from negative to positive, (a higher number represents a better CES score), unlike the first version.
Calculating the Customer Effort Score
As you can gather, there are various ways to crunch customer effort, that is to derive a rating on customer effort. Once you’ve gotten a number from the scale (based on what your respondents answered with), you can take this further to determine the CES score.
There are several ways to calculate the Customer Effort Score. You can use whichever method you prefer for your CES survey. Either way, you’ll be a step closer to working out your customer satisfaction, most notably the degree of your customer effort.
Here are the three calculations to determine your CES:
- Average score: Used with the 1-10 scale. Get the complete sum of all the CES scores and divide it by the number of responses.
- Ex: total CES scores= 600, total respondents = 100
- 600/100= 6, CES= 6, i.e., 6 out of 10
- Via the Agree/Disagree scale or emojis (happy faces): Can be used with 1-5 or 1-7 scales. Subtract the percentage of positive responses from the percentage of negative responses. Do NOT use the neutral responses in the calculation.
- Ex: Total respondents = 300, positive responses =250, negative responses= 50
- % of positive responses = 83.33%, % of positive responses= 16.666%
- 83.33%- 16.666% = 66.664%
- CES score = 66.664%
- Via the 1-7 Disagree/Agree scale: Divide the total number of 5-7 responses (Somewhat Agree – Agree – Strongly Agree) by the total number of respondents. Then, multiple the result by 10 or 100 (if you prefer a percentage).
- Ex: total respondents = 200, 95 = number of positive responses
- 95/200 = 0.475
- 0.475 x 10 = 4.75, CES = 4.75 or
- 0.475 x 100 = 47.5%, CES = 47.5%
Remember, the higher the CES number is on the scale, the greater the Customer Effort Score. So which numbers are positive and which are negative?
- On a 1-7 scale, 5-7 are the positive answers, as they represent somewhat agree – agree – strongly agree.
- 1-4 are the negative responses; 5 is neutral.
- On a 1-5 scale, 4 and 5 are the positive responses.
- 1-2 are the negative responses; 3 is neutral.
- On a scale of 1-10, numbers 8-10 are the positive responses.
- 1-5 are the negative responses; 6 and 7 are neutral.
Why Your Business Needs a CES Survey
A high Customer Effort Score, to put it plainly, is good for business. As such, businesses need to measure their CES score periodically, to track how their customer effort is faring with customers.
A high score signifies that your company is making things easy for your customers.
A low score denotes that interacting with your business — even if it only concerns one aspect of it — is difficult for customers, as it requires too much effort from them.
Exceeding customer expectations is of the essence when it comes to retaining them. In order to create customer loyalists, you need to maintain a high Customer Effort Score, as it is the primary factor of customer satisfaction, along with loyalty and disloyalty.
According to Gartner Research, customers are 4 times more likely to be disloyal after they’ve had a service interaction. These unsatisfied customers negatively affect a company, as they spread their dissatisfaction via social media, forums, online reviews and word of mouth.
What’s more, is that a whopping 96% of customers with low CES scores become more disloyal to a business, as opposed to the meager 9% with high CES scores.
Brands need to make their CX as seamless as possible, so that customers require little to no effort when navigating through brands’ services and experiences.
A CES survey is the aptest instrument for measuring the Customer Effort Score, as it allows businesses to ask the CES question plainly in various parts of a customer journey.
Additionally, this survey is not limited to merely one question, as brands can allow respondents to expound on their score with follow-up questions particular to the interaction customers had just rated.
When to Use a CES Survey
Businesses ought to use a Customer Effort Score survey at various points in their customer experience. Here are a few of the most critical moments to send a CES survey to your customers and customer base:
- After a customer service interaction: whether it’s via phone, email, in-store or via chat, these are critical interactions that must be kept effort-free.
- Following a browsing session: after a customer visited several product pages, send the CES survey to understand whether it was easy for them to find what they were looking for.
- After an on-site search or navigation: Piggybacking off of point 2, gathering customer effort feedback is crucial after customers searched for pages within your site, via a search tab or navigation, as this shows you whether they can easily find what they need.
- After a purchase: This can be used to evaluate the ease of use of the checkout, including all of its steps, or about the steps (pages visited in the customer journey) that led to the purchase.
- Site revisit after no purchase: While it’s disappointing that customers left your site without purchasing if they’ve returned to your site, that’s good news. The CES survey allows you to gain insight into what about the checkout or other aspects of their CX led them to leave without purchasing.
The Pros and Cons of the CES Survey
The CES survey offers businesses a variety of benefits. There are also some setbacks to bear in mind before you launch a CES survey campaign. The following lists the advantages and disadvantages of the Customer Effort Score survey:
The Pros:
- Measures specific actions and events in a customer journey, allowing brands to zero in on what needs improvement the most.
- Allows companies to understand how to improve their CX at an overall level.
- Shows customers that your brand cares about their ease of use with your experiences.
- Boosts customer retention, as customers with high CES scores tend to make repeat purchases (as aforesaid).
- Low-effort interactions create lower costs — 37% less than a high-effort experience (Gartner, see above link) for a business.
- Increases customer loyalty, as fewer customers abandon a business that they are loyal to.
- Helps improve other customer satisfaction metric surveys, such as the NPS.
The Cons:
- Less adoption than the CSAT and NPS surveys.
- Less usage also means fewer benchmark data available to understand which scores are ideal, which are natural, etc.
- Limited to specific experiences.
- Not every customer will want to take a survey at every touchpoint.
Using Customer Effort to Scale Business
Customer satisfaction is the core of a business’s success, as happy customers will return, while dissatisfied ones will not only abandon a company, but leave their mark of discontent on the internet and elsewhere.
Businesses, therefore, need to monitor their customer satisfaction. There are several surveys that help businesses determine the state of their customer satisfaction. The CES survey, however, is unique in that it is the only survey dedicated to measuring customer effort.
Customer effort is a key hurdle (or non-hurdle when it’s low) to satisfaction. A high effort (meaning a low CES score) damages customers’ CX, thereby causing a dent in their customer satisfaction.
Your CX must be as seamless as possible so that the effort required to take any action from customers is hardly noticeable. This may seem like a tall order, but it isn’t, largely due to the CES survey. This survey helps brands study their customer effort at virtually any part of their CX.
The key is to find a strong online survey platform that can facilitate the Customer Effort Score survey process.
Frequently asked questions
What is a CES Survey?
Customer Effort Score (CES) survey determines the amount or extent of effort a specific customer puts into a particular interaction with a business.
What is customer effort?
Customer effort refers to the level of difficulty a particular customer has experienced to resolve a problem. In addition, it also typically refers to the difficulty or ease that a customer experiences with a specific service of a company.
How can you determine the CES score from a CES survey?
Businesses can deduce their CES score in 3 ways:
Average Score: Surveys using a 1-10 scale point can get a sum of all the CES scores and divide it by the number of responses
Agree/Disagree Scale: These surveys have a 1-5 or a 1-7 scale. Subtract positive responses from negative responses to get a CES score
1-7 Agree/Disagree Scale: These are responses that vary between the options of Somewhat Agree – Agree – Strongly Agree – Disagree – Somewhat Disagree, and so on
Why does your business need a CES survey?
CES (Customer Effort Score) is essentially used by businesses to track how effective their customer care is at dealing with customer's complaints and issues. To maintain a steady influx of buyers, companies should strive to maintain a higher CES score.
When should businesses use a CES survey?
Essentially, a business should use a CES survey to assess how easy or difficult a particular touchpoint has been for their customers. It is conducted to gauge the customer experience.

How to Identify Your Target Market with an Online Survey Platform
How to Identify Your Target Market with an Online Survey Platform

To achieve business success, you need to be able to identify your target market, the most important segment of the population, business-wise. Even more important is being able to properly market your products and services to the members of your target market.
In order to do so, you need to understand your target market comprehensively. While this may sound like a feat, the proper online survey tool can make this task effortless — in the literal sense, as you won’t need to do any outreach efforts yourself.
A target market is not simply a target audience, it is a specific segment of the population that’s most vital to your business. This article explains this population, how to identify it and how to engage with it using an online survey platform.
Defining the Target Market
To identify your target market, you need to be well-acquainted with what it is composed of and what it entails.
A target market is a group of customers to whom a business targets its marketing efforts so as to prompt them to make purchases or continue patronizing a business. This group shares certain characteristics that make it unique and differentiable from a larger geographic or psychographic population.
At the broadest level, this group represents all the consumers in a particular market (for example, solar energy). While this group is a good starting point for conducting market segmentation, it is too wide-ranging to target, let alone assure its members will become your customers.
This is due in large part to the fact that when a business develops a plan, whether it is a content marketing strategy, an advertising plan or even a general business plan, it needs to have a precise target market to aim all of its efforts towards. Otherwise, they will be wasted efforts.
Why the Target Market is of Utmost Importance
Regardless of whether your business is aiming to acquire new customers or retain existing customers, neither of these objectives will transpire if you’re appealing to the wrong people.
Therefore, a target market is not merely a group to whom a business aims its marketing and sales efforts.
Instead, a target market is marked by its greatest utility: a group of people that are most willing and most likely to buy from you and engage in customer loyalty.
As such, it should not be considered the other way around, that of being a group of consumers a business wants to sell to, as this group represents the people most likely to buy from your business.
When you sell to a concrete group of people, those most inclined to be your customers, your business is more likely to receive a higher ROI. Additionally, you’ll save time and money by avoiding resource expenditure on people who are less likely to buy from you.
Therefore, it is essential to identify your target market, keep track of it and market to it based on its desires and needs. You can do so with a highly targeted campaign via the aforementioned market segmentation.
The Characteristics of a Target Market
Before you conduct market segmentation, you ought to understand the exact makeup of a target market. There are various qualities among buyers and knowing about all of them will propel you towards correctly identifying your target market and marketing to it successfully.
An awareness of target market characteristics will allow you to know which ones to seek and group together when performing market segmentation and market research at large. Many times, these characteristics may dictate your target market’s behaviors, attitudes and inclinations.

The following lists the characteristics that identify your target market, with which you should perform market segmentation and finally, targeting.
- Demographics: age, gender, race, ethnicity, occupation, marital status
- Geographic location: continent, country, US census region, state, city, zip code, etc.
- Buying power: salary, income, job position, company, buying habits, buying pains
- Behaviors: Store visits, online browsing, lifestyle, hobbies, device preferences, tendencies to buy (seasonal, vs regular)
- Needs: Typical problems that your product/service solves, gaps in the industry in relation to needs, interests, desires
- Psychographics: values, beliefs, aversions, opinions, personalities and inclinations
- Firmographics: (for B2B surveys) niche, company size, company type, employee count, business goals
How to Identify Your Target Market with an Online Survey Platform
Now that we laid out the makeup of a target market, it’s time to move on to identifying your target market, using the above characteristics in tow.
You can identify all of the above characteristics of your target market by performing market segmentation, the process of further subdividing your target market.
But, if you do not have a solid picture of your target market, you can start from scratch. Here is how to identify your target market from the beginning.
Step 1: Placing Your Business into Context
Consider the type of business you operate or plan on starting up. Which industry does it belong to? Moreover, find the niche within that industry that your business most closely falls under. Once you do this, consider the pain points customers in this niche face and who they may be. This will give you a contextual starting point.
Step 2: Mapping Out Your Broader Target Market
When mapping out your broader target market, do so from a high level with the following questions:
- Is there a market for my business? What are its niches?
- Where does my business fit within any of those niches?
- Who would most likely need my business offerings?
- Who can afford my offerings?
- Who would mostly buy from my business?
- Where is my business primarily located?
- Am I going to target other locations, if so, which ones?
Try to answer these questions to the best of your ability. If not, move onto the next step.
Step 3: Conduct Secondary Market Research
Next, conduct secondary market research for your startup or established business. This involves looking at research that has already been conducted and made available. While not all of the resources you may come upon will be free, they provide an invaluable starting point into your target market.
Pay attention to publications, blogs, trade magazines, statistics websites, etc., that discuss the target market, customer base and customers in general. Consider this: Does any of the target market information that you discover appear relevant to your business?
If so, use it to answer the questions in Step 2.
Step 4: Put Together Your Questions & Answers, Having Assembled at Least 10
As you derive the answers to the above basic questions, add more questions as extensions of available questions for a deeper read of the makeup of your particular target market.
Assure that you have identified at least 10 target market characteristics. (If you still feel as though you don’t have all the information about your target market, don’t fret, you can perform more market segmentation later).
After you’ve conducted a viable amount of secondary market research, put together a list of the characteristics you have identified about your target market. Include the areas in which you are lacking information.
Step 5: Creating a Survey
Create a survey in a few steps to identify your target market in greater depth. This is a key step, as surveys can help you discover many aspects of your target market that secondary research does not have the capacity to do.
It’s virtually impossible to have all your questions answered and available in secondary sources. On the other hand, surveys allow you to ask virtually any question about your target market directly to its members.
First off, surveys allow you to target any group of customers via the screener. The first stage of the survey process for respondents, the screener asks them to fill out key demographic information. Additionally, it includes a question portion, which can include psychographic, behavioral, needs-based or any other kinds of screening questions.
This dual approach in the screener ensures that only the respondents that make up your target market are allowed to participate in the survey.
Once they enter the survey, you can further segment them by asking questions that pertain to the aforesaid characteristics of a target market (such as behaviors, psychographics, etc.). By asking questions about these characteristics, you can also tie the survey to another campaign, such, such as an ad campaign or one that measures brand awareness.
The Need to Study Your Target Market Continuously
Catering to your target market goes far beyond being able to identify your target market alone. Once you have a sense of who makes it up, you have to assure that your products, services and experiences live up to their needs and expectations.
There is no other way to understand all of this, aside from deploying online surveys. Surveys allow you to keep track of your target market, which, to reiterate, is the most important portion of the population for your business.
With needs and standards that evolve alongside changes in technology, rising trends and industry updates, it is critical to be able to anticipate your target market’s changing needs along with them.
Additionally, some market segments have a tendency to change their minds and even their spending habits. Consider for example, a market of recent college graduates who have landed their first job. They may soon change their spending habits and develop an interest in more products, due to their increased spending power.
As such, it is essential to keep track of your target market. Online surveys help you do just that along with gaining key insights to various other campaigns.
Frequently asked questions
What does the term "target market" mean?
A target market is a customer group that businesses target to compel them to purchase their products or services. This group of customers shares specific characteristics that make them different from a broader psychographic or geographic population.
Why is it important for businesses to know their target market?
Businesses need to know their target market because it allows them to identify those most likely to make a purchase, get a consultation, register for a demo, etc. It also helps businesses save time and money by limiting funnel research and ensuring that budgets are spent on leads with the highest potential for profitability.
What are some characteristics of a target market?
When sampling a target market, consider their geographic location (continent, state, city, zip code), demographics (age, race, gender, occupation, marital status), psychological patterns and behaviors (store visits vs. online visits, past purchase history, tendencies to buy (seasonal or regular customer), and income (salary, occupation, buying habits, elasticity to price change, etc.).
How can you conduct secondary market research on your target market?
Businesses can conduct secondary market research by looking at publications, trade magazines, websites, and data analytics and statistics. This provides them with a starting point to learn more about their target market.
How can you identify your target market via an online survey platform?
A strong online survey platform is a reliable tool for accurately identifying your target market's behaviors, opinions, lifestyles, wants, needs and aversions, because they allow you to target any group of customers. The first stage (the screener) usually asks customers to fill in their information like demographics and location, as they filter survey participation qualifications.

River Sampling Versus RDE Sampling: Which is Superior for Market Research
River Sampling Versus RDE Sampling: Which is Superior for Market Research

River sampling versus RDE (Random Device Engagement) sampling: it’s a showdown for the ages. As two of the foremost players in survey sampling methods, these two always appear to compete head-to-head for the attention and execution of market researchers.
As prominent players in the survey research sector, both the RDE and river sampling methods are considered superior to using survey panels for market research.
As the two dominant means of obtaining a survey sample, which forms the core of any market research campaign, it is crucial to be diligent when deliberating over which method to use for your survey sampling.
This article posits river sampling and RDE sampling in a showdown, so that market researchers and general researchers comprehend which is more fitting for their market research needs.
Defining River Sampling
River sampling is an online survey sampling method — the earliest and simplest of its kind. This non-probability sampling method obtains survey respondents by requesting online visitors to take a survey via clicking on a link that routes them to the survey.
The link is placed somewhere in a webpage, email or another area in the digital space. Typically, respondents are scouted through web elements such as banners, ads, promotions and offers.
When site or app users click on the link used in river sampling, they are first routed to the screener portion of the survey and if they fit the requirements set in the screener, they are then routed to the questionnaire portion.
River sampling derives its name from the metaphorical idea that researchers net their study subjects by catching them in the river that is the internet, specifically the flow of traffic in a website.
Also called intercept sampling and real‐time sampling, this method extracts respondents by engaging them while they take part in some other digital activity.
The Two Types of River Sampling
River sampling exists in two forms. While they may appear to be vaguely interchangeable, each form includes a unique method for procuring respondents. In the showdown of river sampling versus RDE sampling, it’s important to understand the workings of each.

Stratified River Sampling
This kind of river sampling involves drawing samples in real-time from online promotions, those that are disseminated through banners, ads, pop-ups and hyperlinks. Market researchers would choose the websites for survey deployment based on statistics on such websites’ traffic.
Convenience River Sampling
This submethod of river sampling involves the placement of promotions and hyperlinks across websites without previously analyzing the websites’ traffic numbers and types of visitors. As such, market researchers deploy surveys in a completely blind manner. The point of this form of sampling is to derive maximum data at a minimum cost.
The Pros and Cons of River Sampling
A commonly used method of sampling respondents, river sampling has several advantages and disadvantages. Understanding them is important for researchers, should they consider using this method, or learning how it differs from other sampling methods, such as RDE sampling.
The Advantages
- Serves as a powerful replacement for survey panels by providing new respondents, those that have not been influenced or conditioned to take part in a survey.
- Engages users in their natural digital environments.
- Its survey callouts/ links exist in easily noticeable digital properties.
- Creates a faster alternative to the focus group, which involves a group discussion where dominant participants can take charge and make it difficult for more demure participants.
- Ensures complete anonymity of respondents.
- Exists as a simple method of data gathering, since all researchers need to do is wait for the data to be aggregated.
- An inexpensive source of sampling.
- A flexible method that collects respondents in the moment, rather than being profiled prior to the survey and recruited manually.
The Disadvantages
- The devices used by potential and opted-in respondents are completely unknown.
- There is no access to an advertisement’s ID.
- Fraudsters can therefore take the same survey twice or more to increase their incentives or the chance to win a prize.
- No degree of demographic, geographic or individual targeting is possible.
- Banner ads generally have insufficient response rates.
- Banners are pushed through ad networks, diminishing the user experience.
- Ad-networks optimize their delivery by fighting against random sampling.
- As such, users are picked due to a higher likelihood of responding, from unobserved variables (to the researcher) correlated with how they will respond. At any rate, none of the data is shared, so it is impossible to correct.
- It is difficult to reach an acceptable level of representation, as respondents are not tracked.
- Surveyors have no inkling of who will participate in the surveys due to the lack of tracking and profiling.
- This method is prone to receive straight-lining from the respondents.
Defining RDE Sampling
RDE sampling, also known as Random Device Engagement is an advanced method of non-probability sampling, one that falls in diametrical opposition with survey panels. It is completely random and organic, with no pre-recruitment and no website monitoring.
RDE sampling refers to the sampling practice of engaging online users on all the devices they are already using, be it within advertising networks, mobile apps and other portals on various devices.
This involves the careful placement of surveys in gaming interfaces and virtual reality, allowing market researchers to offer non-monetary incentives to respondents. These include coins or points in a game, or the ability to win a major virtual in-game prize.
RDE sampling can be disseminated through digital elements similar to the ones used in river sampling, such as banners, ads and other positions on a webpages, such as buttons. These survey callouts e.t. al., must be placed strategically, so that respondents can easily spot them. They must also be created in a way that sparks the curiosity or interest of the webpage’s visitors to click on them in the first place.

RDE engages potential respondents in their natural digital environments and respondents enter the survey voluntarily. This method also ensures complete randomization, as no pre-recruiting efforts are involved.
Respondents are also completely anonymous, in terms of their identities, thus, there is no pressure to answer questions in a particular way, such as one that adheres to societal norms and expectations.
The Key Differences Between River Sampling and RDE Sampling
Many of the traits in RDE sampling render this method to seemingly mimic river sampling, with no apparent distinguishing features. But this is false — there are several ways in which RDE sampling diverges from the river sampling method.
Unlike river sampling, RDE sampling offers a monitoring functionality, which tracks the unique identifier of respondents’ devices. The survey software that carries out RDE sampling works natively with the device when it is optimized correctly. For example, a strong example of this would be a mobile-first survey platform.
Furthermore, unlike river sampling, in which respondents are not tracked or identified by demographics, etc., RDE tracks respondents through a unique ID, one that notifies the researchers when the same respondents are changing devices.
RDE also relies on artificial intelligence to weed out poor quality responses, such as gibberish answers and users who are on a VPN.
The Pros and Cons of RDE Sampling
Random Device Engagement sampling carries various benefits and drawbacks that all market researchers should be aware of, even if they do not choose this sampling method. That is because it is critical to weigh these advantages and disadvantages against those of river sampling for a true comparison.
The Advantages
- A higher quality of data due to AI functionality and automatic quality checks.
- Respondents are not conditioned through pre recruiting tactics or pressured to answer questions in a certain way due to being in their natural digital environments.
- Offers various telemetry data prone to bias correction, involving location history and application usage.
- Has a high coverage due to the heavy usage of mobile phones; phones carry a high penetration of about 70% and decent response rates.
- Avoids fraud from SUMAs (single users on multiple accounts); respondents can only answer once and therefore VPN respondents are disqualified.
- Tracks different devices that respondents use, important given the uncertainty of the future use of phones.
- RDE is fast and cost-effective.
- Able to supplement attitudinal data with a vast array of para or telemetry data.
- For example, those who partake in surveys are rather different than those who don’t. As such, it is necessary to get roughly 30 more demographic, attitudinal, and lifestyle questions to understand social trust and how survey respondents are unusual.
The Disadvantages
- Given that this method involves tracking location and application usage, it is not as anonymous.
- In reference to Point 1, the researchers will have to add the necessary disclaimers to their surveys.
- Surveys on RDE networks may not exist in as diverse a set as they do in river sampling.
- Is still prone to several kinds of survey bias.
- Does not offer perfect coverage or known probabilities for every respondent.
- Respondents may be subject to survey fatigue if the survey is too long and not built with best practices.
The Verdict of the River Sampling Vs. RDE Sampling Showdown
In conclusion, who comes up victorious in the showdown between river sampling and Random Device Engagement sampling? In the spirit of remaining unbiased, the true victor is up to the market researcher, the business owner, or the marketing department of a business.
This is because each business and operation will envision their market research campaigns differently and thus will have different requirements and standards for their campaigns. This includes how they will execute survey sampling.
Both methods secure the privacy of respondents, as respondents are never matched with their identities. However, the major point of difference between these two methods is that river sampling does not capture the devices and app usage of the respondents, while RDE does, given that it tracks respondents through unique IDs.
Thus, when using either of these sampling methods, they will have to be dealt with differently.
In regards to this, market researchers can make the judgment of which sampling method is best. We believe that based on the better data quality and representativeness of the sample, RDE is the superior survey sampling method.
With river sampling, researchers must assess the stability, span and relevance of the promotions used in tandem with the surveys. Additionally, market researchers will need to check security and quota controls during the sampling process. SIngle users participating multiple times must be thwarted with specialized software.
With RDE sampling, the online survey platform must cooperate with the publishers and their networks, so that market researchers can design a native experience with surveys on their platforms. (In river sampling, banner ads are pushed through the ad network instead). Thus, RDE sampling is objectively the stronger sampling method, given that it seamlessly prevents fraud and poor data from its capabilities of tracking down device usage and fending off VPNs, users take part more than once and other nefarious behaviors that mar the data and sample collection process.
Frequently asked questions
What is river sampling?
River sampling is an online survey sampling method that obtains survey respondents by requesting online visitors to take a survey via clicking on a link that routes them to the survey. It is entirely random and organic, with no website monitoring. RDE sampling, on the other hand, refers to the sampling practice of engaging online users on all the devices they are already using, be it within advertising networks, mobile apps, and other portals on various devices.
What is RDE sampling?
Objectively speaking, RDE sampling is better as it provides a more robust sampling method given that it integrates well with AI to prevent instances of fraud and insufficient data. It also tracks device usage and can notify researchers and marketers if a respondent changed the device, unlike river sampling, where there is no such device tracking.
What are the two types of River Sampling?
The two types of river sampling are stratified and convenience river sampling. Stratified river sampling means drawing samples in real-time from online promotions, such as website banners, ads, pop-ups, and hyperlinks. In contrast, convenience river sampling involves placing advertisements and hyperlinks across websites without analyzing the websites' traffic. This enables marketers to gain maximum data at minimum cost.
What are some pros and cons of river sampling?
The most significant advantage of river sampling is that it makes the surveys accessible to everyone, even respondents who were not conditioned to take part in a survey. It also ensures the complete anonymity of respondents and is a relatively inexpensive way of conducting surveys. However, since these surveys ensure anonymity and there is no link to a respondent's ID, people can take the same survey repeatedly and distort any chance of accurate results.
What are some pros and cons of RDE sampling?
RDE sampling can detect different devices that respondents use, decreasing the chance of any fraud. It also provides high-quality data due to AI functionality and automated checks. However, the drawback is that RDE surveys may not exist in as diverse a set as they do in river sampling.

How Surveys Improve Content Marketing Strategy
How Surveys Improve Content Marketing Strategy

To survive in the modern age, your business needs a solid content marketing strategy. Content speaks volumes about a business — and not solely about business offerings. Rather, it gives marketers the chance to posit their business as a thought leader in their space.
Surveys help businesses on a variety of matters, one of which is enhancing content strategy, proving the vast extent of the aptitude of survey research. This is largely due to the ability to extract unique and concrete insights from your target market.
This article explains how surveys improve a business’s content marketing strategy and the various times most apt for using surveys.
Defining Content Marketing Strategy
Many marketers believe that content marketing strategy involves posting a blog every week — and that is where they are regrettably mistaken.
While blogs are key content components, they are far from the requirements of a content marketing strategy.
As its name indicates, content marketing strategy is a strategy designed for the subdiscipline known as content marketing.
Content marketing must always be strategic in its approach in order to yield any results. As such, the basis of its strategy includes creating and delivering valuable content. Moreover, the content must be relevant, timely, consistent and interesting to attract and maintain an audience.
After all, when your content allures your target market, its members are more likely to view your content, i.e., give you impressions. The more impressions you gain, the more likely you are to produce conversions.
But businesses shouldn’t focus on one-time conversions, as customer retention is more valuable than customer acquisition. For example, there is a 60-70% greater success rate in selling to existing customers than new ones.
A strong content marketing strategy allows brands to increase customer retention and surveys contribute to this. This is because it is favorable to use surveys for customer loyalty.
How Surveys Improve Content Marketing Strategy
As aforementioned, putting surveys to use can help businesses develop the highly sought-after objective of customer loyalty. But before you create enough campaigns and measure customer satisfaction with surveys, you need to build customer loyalty from the ground up (or enhance it if you are a seasoned business).
Surveys can help you do just that.
There are several ways surveys help aid your content marketing strategy. The foremost benefit of surveys is granting your business with customer data, the kind that comes directly from them, rather than being based on trends and other data you would extract from secondary research.
While the latter is useful and can help you form aspects of your content strategy, it is only a small aspect of building effective survey studies for valuable market research.
Surveys, on the other hand, empower your market research and by extension, your content marketing strategy, as they provide insight at virtually any stage in your overall market research campaign.
Although survey research is conducted following secondary research, it can be the starting point of your research campaign as well. For example, exploratory and descriptive research are conducted to lay out a problem and situation along with its hypotheses and details, before studying correlations, causes and solutions.
These early research surveys are useful in setting up your content marketing campaigns, as they provide you with the key problems and settings of your target market and niche.
Let’s pore over the specifics of survey benefits for content marketing strategy.
What Surveys Measure for a Content Marketing Strategy
Surveys are NOT the end all be all when it comes to market research for your content marketing strategy. They do, however, offer several benefits. These manifest in the kind of data you can extract for your content marketing needs.
The following lists the things that surveys help businesses measure:
- Key demographic, behavioral and geographic information of respondents. These help you perform market segmentation to understand the precise makeup of your target market and its individual segments.

- Opinions about your business. This is an encompassing topic that covers everything from their customer experience (CX), to perceptions about your ads and communications, to feelings about your customer support.
- Thoughts on your industry and niche. This helps you form content ideas. For example, let’s say you sell apartments in a particular area. A community survey can reveal the biggest qualms and desires your target market has about a particular neighborhood or real estate business (in relation to apartments) in general.
- Impact of your content: You can create surveys about particular content assets and content elements. This helps you learn which assets are resonating, which are lackluster and what kind your target market is most interested in reading/consuming.
- Reactions to competitor content: You can be discrete in these surveys, i.e., not mention competitors by name. Instead, you can create surveys that ask about specific content aspects, including comparisons with your own.
- Insights into customer pain points: Understanding the pain points of your target market is ideal for all business practices, especially for products/services, as you can market your offerings as anecdotes to customers’ problems. Additionally, you can use customer pain points as the foundation for various content assets.
- Ex: blogs, case studies, reports, etc. can all address pain points but their value lies in positing your business/product/service as the solution to those pain points.
- Social media reactions: Surveys allow you to inquire into the sentiment around your social media experience. You can be upfront in your questionnaire by asking respondents which posts are boring, which provide the least amount of value and which they enjoyed reading or viewing.
- Customer expectations: These can waver, especially as customers come and go. Surveys grant you direct insights into what customers desire, which you can later use in your content marketing efforts. Content that speaks to customer needs and feedback generally reaps positive results.
What Surveys Help You Discover for Content Marketing
Aside from the above section, which delineates the customer insights surveys can provide from your content marketing strategy, surveys can do so much more. Surveys animate your content, as they can provide you with original content, the kind your competitors won’t be able to reproduce.
Here are several ways surveys enliven your content marketing efforts:
- Building brand awareness: As aforementioned, when more people view your content, i.e, when you generate more impressions, the likelihood of netting converting customers rises. Additionally, the more content you create, the more you have to update your social accounts with.
- Branding: Branding is all about your reputation, brand image and presentation. As such, it is almost always present in content (think logos, company colors, taglines, etc.). Surveys provide market research for branding, so you can make any necessary tweaks to your branding based on customer feedback. These will thus naturally bleed into your content.
- Data-driven content: Surveys don’t necessarily have to be about customer feedback in relation to your business. Survey campaigns foster exploring a variety of topics within your niche. The best part is that no one can copy the data you extract for this content and claim it as theirs — they’ll have to give you credit and link to your content.
- SEO Benefits: Piggybacking off of point 2, when other companies, blogs and websites link their content back to yours as their reference, it is fruitful for your SEO. Gaining backlinks is difficult, but when you release original, data-driven content, others will reference your work and link back to your website or webpage that contains the insights.
- Additionally, search engines like Google admire long, insightful content pieces.
- Establishing thought leadership: Posting content with original insights is invaluable for establishing thought leadership and credibility for your company. Brands with thought leadership are fostering a strong sense of trust with their target market. It also keeps a company fresh in the minds of its target market.
When and Where to Use Surveys in Your Content

In order to master a content marketing strategy, businesses need to deploy them, well… strategically. You don’t want to bombard your respondents with surveys left and right; that will damage your digital CX. In order to sustain high survey response rates, you need to release surveys at appropriate times and places.
The following lists when and where to use surveys in your content to boost your strategy:
- Blogs, webzines, evergreen posts
- When: On a weekly basis
- On the homepage or first page a special user lands on
- When a user returns to your website after several visits OR
- When a user bounces but returns some other time or day.
- Landing pages
- When: On a weekly basis, so long as the landing page is live OR
- Once, if a user converts, i.e., signs up for a service, or joins a content list.
- Reports, whitepapers and other gated and downloadable content
- Just once for authorized respondents, those that leave their real names and emails.
- Publisher sites
- Daily
- This helps expose random users to your brand who may have otherwise not known about it.
Positioning Your Brand in the Way You Intend With Surveys
Your content marketing strategy is an opportune way to not only nurture your leads further down the sales funnel and grow brand awareness. Instead, it sets the tone and style of your brand, allowing you to position it in the way you seek.
Surveys are an apt means to support this end, as surveys allow your content to posit you in a desirable light, one that differentiates you from your competitors.
They show your customer base that you care and value their feedback, not just about delivering good products/ services, but for a productive content experience, one that offers value instead of thinly valued brand propaganda.
A strong content marketing strategy will ensure your brand is considered a trusted resource, the kind that draws continual interest and impressions from your target market. Surveys are auspicious tools to help you reach this end. The key to using surveys as a content marketing strategy conduit is to use the most robust online survey platform.
Frequently asked questions
Why is a content marketing strategy important?
The point of having a content marketing strategy is to create targeted, valuable content for the audience. This approach ensures that content is relevant, timely, consistent, and engaging enough to attract and retain an audience. Moreover, the more traffic your content attracts, the more likely it is to gain impressions.
How can surveys improve your content marketing strategy?
The primary benefit of surveys is that they provide marketers with accurate customer data that comes directly from them instead of relying on customer trends and secondary research. This collected data helps make a targeted content strategy that marketers know will interest their customers instead of adopting the trial-and-error method.
What information do surveys measure for a content marketing campaign?
Survey questions help measure respondents' behavioral, demographic and geographic information that enable marketers to segment their strategies and create targeted content. In addition, survey questions can be tailored according to what marketers want to know, such as their opinion on competitor's content, their sentiments regarding the launch of a new product, etc.
How can surveys help to bring your content marketing efforts to life?
Surveys can make your content unique, as all the information you collect is unique to your business, which your competitors won't reproduce. It can revitalize your content marketing efforts by building brand awareness, establishing your brand as an authority. It also enables marketers to gain data-driven content and create SEO-optimized survey questions that can expand your business's reach further.
Where should you use your surveys?
Surveys can be displayed everywhere, from blogs and magazines to your website's landing pages and newsletter. However, make sure you have different times for publishing your surveys on other mediums. For example, put up surveys on landing pages weekly, on evergreen blog posts almost daily, and on white papers and downloadable PDFs just once. This helps expose random users to your brand who may have otherwise not known about it.