
How a Mobile-First Approach Creates Agile Data for Market Research
How a Mobile-First Approach Creates Agile Data for Market Research
Mobile-first is an invaluable approach in regards to creating agile data — and as you know, you need data, particularly on your customers and market to keep your business intact.
A data-driven workforce is 58% more likely to surpass revenue goals, underpinning the need for businesses to have access to agile data solutions.
In order to reap this kind of data, you must conduct market research, which can be a feat given all the efforts that make up market research techniques come in conflict with the notion of agility.
Implementing the correct solution can remedy this conflict — if it is mobile-first. This article explains how a mobile-first platform yields agile data for market researchers, marketers, analysts and business owners.
Understanding Agile Data
Agile data is a method used by IT professionals, in which they employ a range of strategies for various situations so that they can work in sync effectively on the data component of software systems.
The agile data approach does not rely on one technique; rather there are many that form the backbone for providing data at speed. These include:
- An agile design
- Lean data governance for development teams to foster and maintain high-quality data assets within an overall IT ecology
- Agile data warehousing
- Database testing and more
However, establishing agile data is not solely an internal methodology. In order for it to be of any use to businesses and their employees, it must manifest in the front end, so that its users feel the effect.
In market research, a potent online survey tool can be a vessel for providing agile data. While there are many attempts at fomenting agile data, providing a mobile-first tool is the most powerful of all, in that mobile usage has skyrocketed in recent years.
The Importance of Agile Data
Just as many companies falsely deem themselves to be data-driven, many of them also fall prey to solutions that claim that agile is the norm for them, when in fact, they provide substandard data. Whether it is in regards to its frequency, quality or other capabilities, many solutions fall short of the heavy demands of agile data.
Companies need agile data in that it delivers speed to insights, i.e., data aggregation delivered at speed. But agile data depends on more than speed. It consolidates speedy insights with high-quality data.
As aforementioned, there is no single approach to delivering agile data. IT professionals and UX experts must work hand in hand on a market research platform’s backend to ensure a smooth and efficient data collection, parsing and filtering. This way, the receivers of the data — the market researchers — have a high-quality set of data.

In market research specifically, this is centered on receiving data from the correct respondents. This does not solely refer to the people in your target market, or even the ones you’ve preset in the screening portion. Instead, an agile source of data should quickly disqualify respondents who provide inaccurate or low-quality responses.
There are several ways that an agile platform can eliminate poor responses, such as gibberish answers, one-word answers irrelevant to an open-ended question, untrustworthy responders, such as those using a VPN and more. This is often achieved via technical checks on the market research platform.
However, in the true spirit of agile data, the market research platform must be designed with a mobile-first approach.
Defining Mobile-First
Mobile-first is a kind of design practice in which a digital experience is designed for mobile-first, as its name implies, prior to designing the same experience for other devices, such as desktop or tablet.
Mobile-first prioritizes the development of the mobile experience as a means to optimize it from the jump. As the project progresses, it eventually works towards designing the desktop version of the experience.
A mobile-first approach allows developers to scale up as the project evolves, rather than down, as they would in a desktop-first approach. This ensures that the mobile experience is adequate, rather than an inferior version of a desktop experience.
In a desktop-first design, the mobile experience appears to be a downgraded version of the desktop experience, as many graphics and site elements simply do not fit a mobile experience, given its much smaller screen size. A mobile-first design avoids this subpar effect in the mobile experience, therefore, it is of the utmost importance — and on several accounts.
Positioning a mobile-first methodology is also crucial, given that mobile traffic has consistently exceeded desktop traffic, ever since mobile had first surpassed desktop traffic in 2016. Therefore, mobile use has a far greater impact on reach.
This is critical for attaining agility in market research, as you need your survey sample to be representative of your target market. This is especially necessary if you have a massive target market or intend to survey over a hundred people. It would be nearly impossible to achieve agile data in this regard if not for a mobile-first design.
How Mobile-First Creates Agile Data
A mobile-first design optimizes the experience of mobile users. Since mobile users surpass desktop users, more of them are going to be the targets of an online survey platform.
Thus, a mobile-first design in the online survey platform itself is imperative. Even if a mobile site or app provides a mobile-first experience, your market research is in peril if the platform you use to deploy surveys on that mobile-first mobile property is not itself mobile-first.
This is because a poor experience will turn respondents away, causing survey attrition. Or, the frustration respondents undergo while taking your mobile survey will cause them to provide inaccurate answers or other manifestations of survey bias.
A mobile-first approach avoids these issues along with many others. It also allows an online survey platform to obtain agile data. When a survey for a mobile site or app is developed with a mobile-first approach, it eliminates points of friction. Thus, users are more inclined to take and complete the survey. This efficiency, in turn, produces agile data.

Furthermore, a mobile-first online survey platform removes the sense of inferiority in mobile in comparison to desktop. In this regard, it does not appear as if something in the mobile survey experience is missing. This creates an enhanced experience in a twofold manner:
- It allows the market researcher to set up a mobile survey that includes all of their needs. This includes the capabilities of:
- a wide variety of questions including Matrix questions
- The addition of multimedia elements in appropriate formats
- Multiple selection questions, open and close-ended questions
- Advanced skip logic
- Survey incentives
- It enhances the experience for respondents, thus they are more likely to complete a survey and in a quickened manner.
- Quick responses allow for the survey platform to faster meet all of its quotas, thereby fostering agile data.
A mobile-first approach can also help market researchers save money. This is due to the fact that the performance of many surveys largely depends on survey incentives. Most people do not have time to spare and those that do will want compensation for their survey participation.
Survey incentives make this possible — but they can be costly. In mobile surveys, rather than provide monetary incentives for mobile users, the online survey platform should allow for gaming incentives. The majority of digital users play games on mobile devices (Android, iOS).
As such, a mobile-first approach in an online survey platform would grant in-game perks to gamers who agree to take part in a survey. For example: in order for players to pass to another level, the incentive can be offered as coins/ tokens in the game.
Consequently, mobile players would much rather take part in a mobile survey that rewards them in their games, as opposed to offering them nothing. Thus, their willingness allows market researchers to reach insights sooner, buttressing agile data.
Obtaining Agile Data in Market Research
Many online survey platforms promise agile data but end up underperforming on this front. This is largely due to the absence of several in-platform components that forge agility.
A mobile-first approach in such a platform helps produce an optimized mobile survey experience, which retains respondents and eases the market research process. Market researchers should thereby select their online survey platform wisely.
They should opt for a platform that not only promises agile data, but corroborates it. The Pollfish platform does this via a mobile-first approach along with various quality checks and platform functionalities.
Frequently asked questions
What is the meaning behind mobile-first?
A mobile-first experience means that websites, apps, and other digital properties are specifically designed for the mobile experience, as opposed to fitting all the regular elements used on a desktop. Mobile-first surveys can easily adapt to a mobile screen, as UX designers and web developers ensure that the most important content is displayed and optimized for mobile devices. It is a cost-effective approach that allows the researchers to save money that was spent on conducting countless surveys that may or may not be accurate.
Why is a mobile-first approach important?
A mobile-first approach is cost-effective as it helps researchers save money spent on conducting countless customer surveys that may or may not be accurate.
How can agile data be used in surveys?
Agile data can eliminate low-quality or inaccurate responses from a survey and help in making accurate inferences. They also disqualify participants who use a VPN, give unworthy responses to open-ended questions, or give gibberish answers just for fun, helping to save time organizing data.
What is the link between mobile-first experience and agile data?
A survey optimized for mobile use eliminates all loopholes and points of friction, thus increasing customer satisfaction towards completing the survey. Hence, this efficiency produces agile data.
What is your agile data collection method for companies?
Companies require agile data to deliver speedy and high-quality data. And since there is no one way to approach agile data, our researchers have to work hand-in-hand with UI and UX developers to ensure a smooth data collection method.
Why do companies need agile data?
Companies need agile data in that it delivers speed to insights, i.e., data aggregation delivered quickly. But agile data depends on more than speed. It consolidates speedy insights with high-quality data so that businesses can make effective decisions that reduce organizational risks.

How to Minimize Survey Fatigue for Quality Research
How to Minimize Survey Fatigue for Quality Research
Although survey respondents from far and wide have undergone different experiences, they’ve all come upon one regrettable issue: survey fatigue. This phenomenon is one of the greatest detriments to survey research, as it hampers respondents who already have begun participating in a survey.
Valuable survey responses are hard enough to come by as it is, so when your respondents are hit with a bout of survey fatigue, it makes it even more difficult to retrieve needed responses.
This is because respondents who experience survey fatigue are less inclined to complete their survey, or do so in an accurate manner.
This article explains survey fatigue, including its four different types and how to minimize them so your survey research is never blighted by low-quality responses.
Defining Survey Fatigue
This occurrence denotes the phenomenon in which survey respondents become exhausted, bored or uninterested with a survey they’re taking or are about to take. This incurs several problems for survey research, in that when respondents are fatigued, the quality of their responses tarnishes.
The Two Main Types of Survey Fatigue
 Eliminating this negative phenomenon hinges on understanding where and how it occurs. First, you ought to know that there are two main manifestations of survey fatigue.
- Pre-Survey Response Fatigue: This takes place before prospective respondents take a survey. This kind of fatigue comes about due to repeated requests to take a survey. Sending too many prompts or reminders can thus cause this kind of fatigue.
- It is the chief cause of a low survey response rate.
- Fatigue During the Survey: This occurs as respondents are taking their surveys and can be caused by a variety of in-survey issues. As such, researchers should consider several practices to create effective surveys.
- This kind of fatigue is responsible for survey abandonment during the survey-taking process.
How Survey Fatigue is Damaging to Businesses
Survey fatigue is not merely a problem for survey respondents, who can certainly do without feeling fatigued from a tool that ultimately benefits its creators, i.e., the researchers. It is generally best to avoid surveys prone to cause fatigue, as online respondents will associate negative feelings towards surveys and be disinclined to take them again, even when offered with survey incentives.
Here are a few other main ways that survey fatigue damages not merely your survey research, but your business, by extension.
- Tarnished answers: Fatigue naturally leads to poor quality answers. This outcome is extremely damaging to survey data quality. There are a number of ways that fatigue creates substandard answers. Here are a few examples:
- Survey biases such as acquiescence bias, flatlining, random response bias and many more.
- Gibberish answers to quickly complete the survey.
- Answers with little to no thought on the questions, thus inaccurate or not fully representative of the respondents’ true opinions and experiences.
- Skipping open-ended questions or answering them with one word just to rush through the survey.
- Survey attrition: The most severe instance of survey fatigue will lead to survey attrition, in which respondents abandon their surveys, rendering them incomplete and since they’ve not been submitted, useless. Survey attrition also refers to nonresponse attrition, which refers to the first type of survey fatigue, in which would-be respondents do not take part in a survey. This form of attrition is called nonresponse attrition.
- Waste of resources and money: Whether you hire a survey panel or run online surveys, surveys bound to generate fatigue waste the efforts of your respondents. It’s best not to trouble respondents as they are part of your target market, or target population. As aforementioned, a bad survey experience will repel them from taking part in future surveys, which is damaging since you either selected them (in panels) or managed to get them to participate via an online survey. Regardless of whichever method you brought them to your survey, fatiguing them wastes time and money.
- Negative Perceptions of your business: Fatigue does not simply cause negative associations with surveys, but it posits your brand in a negative light. This is especially true for B2B brands, as B2B surveys are targeted to partners and existing business clients, who are obviously aware of the brand behind the survey. Even leads will form an opinion of your brand, as they often land on surveys via a digital experience with your brand. B2C brands may also suffer poor brand perceptions by way of survey fatigue, as some surveys will require mentioning the brand and its operations. Ex: in a survey measuring an ad or marketing campaign, or in a customer feedback survey.
The Causes of Survey Fatigue & How to Avoid Them
There are several factors at play when it comes to this phenomenon. The most evident cause is a poorly formed survey. Whether it is the question structure of the survey, the nature of the questions themselves, or poor targeting, these unfavorable structural elements all contribute to survey fatigue. The following are some critical causes to consider, as they all factor into survey fatigue.
- Incorrect targeting: you may set specific demographics quotas to your survey, but are they correct? You ought to understand your target market to a T before sending them any surveys. If the content of the surveys feels irrelevant, respondents will easily incur survey fatigue. Solutions:
- Study your target market via secondary and primary research before sending surveys aimed at them, especially if you operate a niche business and the survey is in relation to a niche subject matter.
- Conduct market segmentation to divide your target market into even smaller segments. This way, you can send relevant surveys catered to each type.
- Long questionnaires: Some surveys require more questions than others. However, long questionnaires tend to be tiresome and quickly cause respondents to disengage. Also, if some interruption occurs (spotty Wifi, etc.), all their responses will be gone and they’ll be reluctant to restart and go through the entire process. Solutions:


- Keep surveys as short as possible.
- Break up a long survey into smaller ones when possible.
- Offer incentives and an estimated completion time to respondents.
- Over-surveying: Continuous prompts for respondents to take part in surveys can be bothersome. As such, this may cause both of the survey fatigue types, as respondents will be too bored to begin a survey and may become bored while taking one, when they’ve done so several times. Solutions:
- Consider the need for your surveys; if it is not all that necessary, eschew it.
- If you require follow-up surveys to the exact same panel, consider planning out how many surveys you’ll need and letting the panelists know in advance.
- Repetitive questions: These will frustrate and bore your respondents, not to mention, make the survey longer than it needs to be. Solutions:
- Avoid using Matrix questions consecutively.
- Route users to appropriate questions via skip logic.
- Keep questions as disparate as possible, unless they’re follow-up questions respondents get via skip logic.
How to Minimize Survey Fatigue
There are plenty of other causes of this kind of survey repellent. Even the most vigilant researcher can fall prey to creating a fatigue-inducing survey. This is because getting bored is part of human nature, so plenty of respondents may inadvertently experience some level of fatigue.
To combat survey fatigue, here are a few considerations and best practices to put into use that are not mentioned in the previous section with solutions.
- Be concise with questions. Do not cram two inquiries into one. They may be related, but this forces the respondent to think more and can lead to feeling overwhelmed.
- Ex: Instead of asking: “Which brands have you heard about and which is the best one in your opinion?”
- Form two questions: “Which brand have you heard of?” Use skip logic if they've heard of at least two to the following question: “Which is the best one in your opinion?”
- Provide all possible answers if you’re using multiple-choice questions. However, keep this to a minimum if you’re using a scaled or Matrix question.
- Leave no ambiguity on your questions. If your questions or answers leave respondents scratching their heads, they’ll unlikely care to finish their surveys, let alone truthfully.
- Limit open-ended questions. Open text fields require writing, something many respondents will be hesitant to do, especially if pressing a button in a multiple-choice becomes too laborious for them.
- Be consistent with scaled questions. Avoid confusion by keeping scales consistent. For example, if you choose a 5-point Likert scale, keep it at five points throughout. Don’t mix and match scaled questions.
- Ex: If the following is used in one answer range;
- Extremely satisfied
- Somewhat satisfied
- Neither satisfied nor dissatisfied
- Somewhat dissatisfied
- Extremely dissatisfied
- Then the following answers should follow suit
- Keep the language consistent with the target market/population. Some populations will understand professional terms and jargon, while others won’t.
- The same applies when surveying different generations in the same survey; if the lingo is only understood by one demographic, do not use it in a survey with various demographics, as they may not understand it. Looking up terms while taking a survey can lead directly to fatigue.
- Keep surveys culturally relevant. Do not ask the same questions to members of different countries, geographical districts and cultures, as fatigue will inevitably ensue.
- Ex: listeners of pop music may not know anything about country.
Relying on a Potent Online Survey Tool
Using a strong online survey tool is the best solution for eliminating survey fatigue. This is because a valuable online survey platform offers various ways to structure questions, provides quality checks (for example, on gibberish or flatlining answers, etc.), avoids survey fraud and allows you to thoroughly screen respondents so only the most relevant ones take part.
These aspects cannot be provided with survey panels alone.
Additionally, researchers ought to be heedful of the online survey platforms they choose. After all, the survey experience is at the heel of the platform. A strong survey platform can avoid fatigue, even when rookie researchers set out on their first survey campaign.
Frequently asked questions
What is survey fatigue?
Survey fatigue is the phenomenon where survey respondents lose interest in the survey they are taking, reducing the attention they pay to the questions, causing them to provide inaccurate answers and at worse, survey attrition .
What are the two types of survey fatigue?
The two types of survey fatigue are pre-survey response fatigue and fatigue during the survey. Pre-survey response fatigue usually results from overspending prompts and reminders. Fatigue during the survey often results from in-survey issues.
How does survey fatigue damage businesses?
Survey fatigue can lead to tarnished answers, survey attrition, waste of resources and money, and a negative perception of your business. Plus, online respondents will be less likely to take surveys in the future if they have a negative experience.
What causes survey fatigue?
Survey fatigue is most often the result of poorly created surveys. Specific causes can include incorrect targeting, long questionnaires, over-surveying and repetitive questions.
How can you minimize survey fatigue?
You can minimize survey fatigue through the following methods: being concise with your questions, providing all possible answers (in the case of multiple- choice questions), avoiding ambiguity, limiting open-ended questions, being consistent with scaled questions, keeping language consistent with your target market/population and keeping surveys culturally relevant.

How to Conduct Healthcare Market Research Like a Pro
How to Conduct Healthcare Market Research Like a Pro

Healthcare market research is essential to providing optimal patient care, which is much needed in an industry hailed as people-centric, especially in a world rife with a pandemic.
Market research allows healthcare industry professionals to gain a deep understanding of the needs and behaviors of their patients — the kind they otherwise wouldn’t have. Additionally, it allows practice providers to expand their patient network, and increase their patient retention rates by helping them provide products and services tailor-made to the needs of their patients.
This article expounds on how to conduct healthcare market research for healthcare market researchers.
Defining Healthcare Market Research
Market research is the process of researching the viability of a new product or service through both primary and secondary sources. Primary sources use techniques like in-depth interviews, focus groups, and ethnographic studies to understand how products are used, how they can be improved, and how they can be streamlined.
Secondary sources involve a wide variety of research that has already been conducted such as statistics publications, scientific journal articles, and market research articles.
Healthcare market research applies the concept of market research to the healthcare industry. Instead of gauging how products are used, healthcare industry professionals use market research to learn about how their services can better benefit patients (and how they can reach and retain more patients).
The Importance of Conducting Healthcare Market Research
While the healthcare industry relies on services and products to keep patients healthy, market research specific to this industry is seldom conducted.
Healthcare market research needs to be prioritized because it creates a path to better care, and this is what the healthcare industry is fundamentally all about. The best way for healthcare providers to succeed in the industry is to form a clear understanding of this target market through market research methodologies.
Gaining access to the proper research can be a gateway to building a strong reputation, attracting more patients, garnering good reviews, and being a community go-to. As you learn more about your patients’ wants and needs, your quality of care will increase and you’ll build patient trust.
The Makeup of Healthcare Market Research
When conducting healthcare market research, you’ll need to conduct both primary and secondary research for a holistic market research campaign. Combining these methods yields powerful insights with the potential to transform patient care.

Primary Healthcare Market Research
Primary market research in the healthcare industry involves communicating directly to existing or potential patients. You do this to learn about your target market, which gives you the ability to perform market segmentation. Dividing your patient base into narrow market segments allows you to address a specific sector of your target audience.
You can conduct primary research using these methods:
- Online Surveys
- Surveys include questionnaires and screeners that you can deploy to your target market via an online survey tool.
- A 3-minute survey will yield more responses than a 5-minute survey, so try to get the information you need in as few questions as possible.
- With online surveys, you can reach a specific segment of your target audience while saving time and maximizing responses.
- In-depth interviews
- In-depth interviews are one-on-one interviews that can happen over the phone or in person.
- Time estimates range from 20 minutes to over an hour.
- This intimacy and time-frame allow the researcher to get detailed feedback, as healthcare can be a sensitive topic.
- Personal interviews make it easy to gather information without privacy concerns. An average study might interview 10-50 participants.
- Ethnographic research in healthcare settings
- Ethnographies are field studies that use observation and interviews to study how people use products, interact with technology, and find/use services.
- Ethnographic research allows the researcher to record behavior in addition to participant feedback.
- It can be performed in-person or by software.
- While recall methods rely on participant’s memories, this real-time observational method is more reliable.
- Customer journey mapping can be integrated into this technique to see how patients interact with a healthcare provider's website and how they locate services from providers through phone referrals or word of mouth.
- Focus Groups in Healthcare Settings
- Focus groups are a great technique for healthcare market research, especially when a product or service is new.
- The group-brainstorming format stimulates ideas and feedback that you might not be able to get out of an individual.
- A great healthcare marketing research method is a hybrid of focus groups and ethnography studies.
- This lets you observe your consumers in their natural setting before bringing them together for a brainstorming session.
Primary Healthcare Market Research
Secondary market research is the process of gathering already published data. You can speed up this process by purchasing high-quality market research reports. They provide in-depth data, statistics, and results that reveal areas and topics that need to be explored through primary research.
Here are some secondary market research sources for the healthcare industry:
- Published market research reports are a great source of information. The healthcare market research section of marketresearch.com is a great place to get started.
- Consumer reports and industry reports are a perfect starting point for researching target markets and trends. Visit Statista for reliable reports relevant to the healthcare industry.
- Healthcare provider websites, i.e., those of your competitors are often a natural starting point for market research. You can find relevant annual reports, presentations made for investors, and other information that shows you where you’re positioned in your field and what areas you need to focus on with your primary market research.
- NCBI is full of secondary research information pertaining to patient care.
- UpToDate is a medical resource providing clinical decision support that’s been proven to improve patient care.
- BMC Health Services Research offers a collection of journal articles on topics relating to healthcare practices like policy, the health workforce, health services research methodology, protocol, and more.
- Census data can also be helpful in exploring demographic information.
Tips for Healthcare Market Research Surveys
Healthcare market research surveys are nothing without responses. Follow these tips to boost your response rates:

- Target Your Population: Choose a target population relevant to your survey goals. If this population is hard to reach, consider using software to find survey takers who meet your criteria.
- Prioritize Question Clarity: Keep your questions simple with the least number of steps possible. The easier your survey, the more responses you’ll get.
- Be Mindful of Survey Length: As a healthcare industry professional, you know how valuable time is. Make sure your survey doesn’t take too much time to complete so that respondents can easily fit it into their schedules.
- Shoot for between 5 and 15 minutes. You can make it even more manageable by using skip logic to let respondents only answer the questions most relevant to them.
- Offer Incentives: you can boost your survey response rate by offering extrinsic survey incentives like discounts, coupons, gift cards, or even cash rewards.
Healthcare Market Research Use Cases
The above techniques are only helpful if you know how to use them, so let’s dive into use cases. Here are some ways you can use healthcare market research to expand the reach and improve the overall patient experience:
- Evaluate healthcare access: you can investigate benefits and barriers to healthcare among groups with limited access (for example, low-income and senior citizens). You can target populations in rural areas and inner cities for the best results.
- Improve business operations: this gauges the effectiveness of your business processes. It allows you to discover where you need more support and where systems could use some tweaking.
- Healthcare feedback questionnaire: this survey helps you find out if your patients are satisfied with their care if they were taken care of in a timely manner and if their needs were met.
- Women’s health research: This allows you to monitor the healthcare female patients received, which includes their opinions, concerns and fears. This is especially important for gynecologists and those who provide health services targeted at women.
- Healthy lifestyle programs: This divulges whether patients are interested in secondary health programs such as health and wellness classes, smoking addiction aid, stress relief, weight management, mental health support, pain management, etc.
- Teen health survey: this gives teens a confidential place to provide info on teen health habits, tobacco, drug, and alcohol abuse, bullying, and family issues. You can use this info to tailor-make special programs to aid your teen patients.
Upgrade your Patient Care with Healthcare Market Research
Healthcare market research can help you understand your patients and what they need to feel healthy and happy with their patient care. Staying on top of your healthcare practice isn’t limited to the day-to-day — it also involves the need to monitor patient satisfaction to keep your practice’s online perception in check. Surveys can come to your rescue on this matter.
Healthcare market research is important, but it shouldn’t take time away from patient care. That’s why you need a robust online survey platform to aid your in healthcare market research efforts. With an online survey platform, you can collect the data you need to better your practice. Plus, online surveys are one of the only kinds of primary market research where you don’t have to meet with someone in person (making them pandemic-proof). They’re the best way to listen to your patients’ needs and improve your practice accordingly.
Frequently asked questions
What is healthcare market research?
Healthcare market research is research that helps healthcare industry professionals understand the needs of their patients, expand their patient network, and increase their patient retention rates.
Why should you conduct healthcare market research?
Healthcare market research is important because using it to guide your practice improves patient care, strengthens your practice’s reputation, attracts patients, garners good reviews and establishes your practice as a trusted one in your community.
What are some primary healthcare market research methods?
For primary healthcare research, use surveys via an online survey tool, focus groups, phone calls and ethnographic (field) research.
What are some secondary healthcare market research resources?
For secondary healthcare market research, look for resources like published market research reports, consumer reports and industry reports, healthcare provider websites (like your competitors), NCBI for patient care research, UpToDate for clinical decision support, BMC Health Services Research for healthcare best practices and census data for exploring your demographic information.
What are some tips for healthcare market research surveys?
For the best healthcare market research surveys, target your population well, prioritize question clarity, keep your survey length to a minimum and offer incentives to up your survey participation.

The Quick Guide to Customer Experience Survey Questions
The Quick Guide to Customer Experience Survey Questions

Businesses need to form the right customer experience survey questions in their surveys to reap valuable insights on their customers. Regardless of the industry you operate in, providing an optimal customer experience (CX) is vital to the success of your business. Customer experience can make the difference between acquiring new customers and losing them to a competitor.
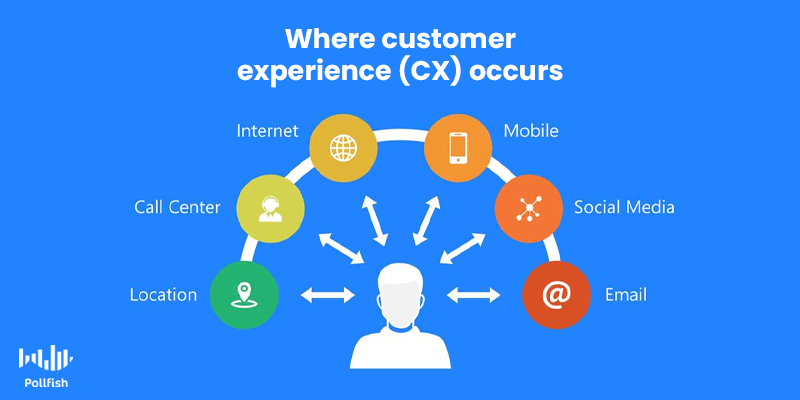
Customer experience is an umbrella term that refers to all the impressions your customers harbor about your brand e throughout all the stages of their interactions with your brand, which includes the customer journey before and after generating sales.
A remarkable CX can improve the overall customer lifetime value, while a poor one can contribute to a high customer churn rate.
As such, if you intend on attracting and retaining customers, you must establish an optimal customer experience from the moment they become aware of your brand until they seize their keyboards to write a review.
This article will provide you with the various types of customer experience survey questions you can ask your customers in order to refine your brand’s CX.
Using Customer Experience Survey Questions to Measure Your CX
Since the success of your business hinges on customer experience, you should continually check in with your customers to ensure that you provide them with an excellent CX. Online surveys are one of the best and easiest ways of doing this.
Customer experience survey questions are the key to measuring the strengths and weaknesses of your customer experience. This research technique can shed light on how your CX can be improved at every step of the buyer’s journey.
In order to make the most of your research efforts, however, it is important that you create customer experience survey questions that will yield valuable and accurate results, which will help you enhance your brand’s CX.
The following will acquaint you with the various kinds of customer experience survey questions with examples.
Questions about the Discovery Process
The first step in the buyer’s journey happens when they become aware of your brand. From their earliest encounter, a customer is already forming opinions about your company, which is why your CX needs to be flawless. After all, first impressions matter. Customer experience survey questions to ask about the discovery process include:
- How did you first learn about our company?
- Multiple-choice answer (i.e. “Social media” / “Google search” / “YouTube ad” / “Recommended by a friend” / “Other”)
- Multiple-choice answer (i.e. “Social media” / “Google search” / “YouTube ad” / “Recommended by a friend” / “Other”)
- Think back to the first time you visited our website. On a scale of 1 – 10, how easy was it to find the information you were looking for?
- Scaled response (1 = very difficult 10 = very easy)
- How did our Instagram channel influence your feelings about our brand?
- Multiple-choice answer (i.e. “I did not visit your Instagram channel.” / “I visited your Instagram channel, but did not find the content interesting.” / “I learned a few new things about your brand from Instagram.” / “Your Instagram channel is what convinced me to purchase from your brand.”
- Which of the following features did you use while considering which product to purchase?
- Multiple-choice answer, with multiple selections allowed (i.e. “Live chat” / “Ratings and reviews” / “Support videos” / “Product comparison matrix”)
Questions about the Consideration Process
Once familiar with your brand and offerings, customers often shop around to find a better price or ensure they choose the product or service that best suits their needs. By understanding your customers’ thought process during this phase, you can enhance the CX to ensure your products and services are seen in the best light. Questions to ask include:
- While you were deciding which product to purchase, how easy was it to find the information you needed on our website?
- Scaled response (1 - 10, with 10 being very difficult)
- Multiple choice (i.e. “Very easy: / “somewhat easy” / “difficult” / “very difficult” / I did not find the information I was looking for on the website.”)
- What other companies did you consider before choosing our company?
- Multiple-choice answers with multiple selections allowed – list out your main competitors in these responses.
- Based on the response to this question, you can use skip logic to route respondents to the appropriate questions to understand how you measure up to competitors.
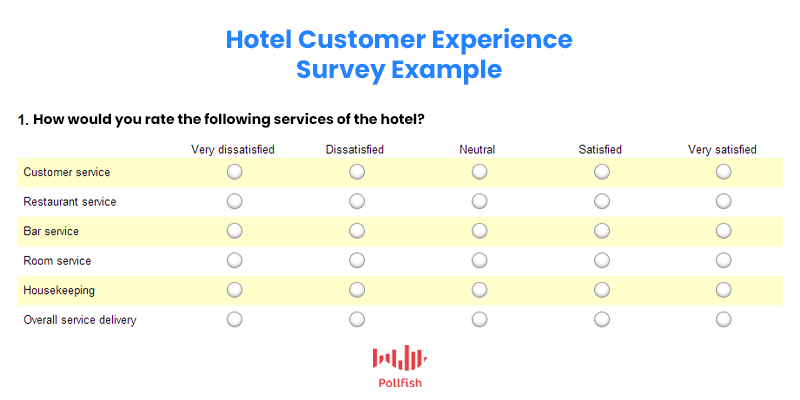
- When choosing our product, how well did we convey the following aspects of our product :
- Use a matrix to list out items you want to assess (i.e. product features, product quality, ease of use, pricing options)
- Allow users to rate each of these by providing a scale of 1 – 5 (1 = unclear, 5 = very clear)
- What was the best part about browsing our website?
- Multiple-choice answer (i.e. “The interactive design that let me explore product features” / “The videos” / “The blog with personal stories.”)
- Open-ended answer
Questions about the Purchase Process

Once someone has decided to purchase from your company, it is imperative that your purchase process provides a smooth and enjoyable customer experience. Barriers in this process can result in abandoned carts, bounces or, even worse, a prospect choosing your competitor instead.
- Where did you purchase this product?
- Multiple-choice answer (i.e. “On your website” / “On another website” / “At one of your stores” / “At an independent retailer”)
- How easy was it to purchase this product on our website?
- Visual rating system with 1 – 5 stars
- Multiple choice (i.e. “Very easy” / “Somewhat easy” / “Difficult” / “Very difficult”)
- What can we do to improve the purchase experience?
- Text entry field to allow the respondent to provide unique insights about the checkout experience
- Multiple choice (i.e. “Allow guest checkout” / “Provide the option to check out using PayPal” / “Improve the mobile checkout experience”)
Questions about Usage & Support

Customer experience doesn’t end at the checkout. CX is equally important once your customer has the product in their hands or starts using your services. Ease of use plays into the overall experience, as does the support customers receive when they encounter issues. Understand how your customers use your products and access support by asking the following:
- Did you have any problems using the product at first?
- The response can be binary (yes/no) to the first question. For those who answer “yes,” use skip logic to route them to the next questions.
- Or multiple choice (i.e. “No, I was able to use the product immediately.” / “I had some problems, but I was able to figure out how to use the product eventually.” / “It was very difficult to use this product.” / “I was unable to use the product.”)
- What problems did you experience when you first used the product?
- Open-ended answer.
- What actions did you take to resolve the problems you had using the product?
- Multiple choice (i.e. “I contacted customer support” / “I used your support forum” / “I watched videos on your YouTube channel”)
- For those who answer “I contacted customer support,” you can use skip logic to get a better understanding of their customer support experience.
- How satisfied are you with the support our customer service team provided?
- Customer Satisfaction Score survey (CSAT) format, with responses provided on a 1 – 5 scale, with 5 indicating “very satisfied.”
- Visual rating system with various emoticons.
Questions about Retention
Your customers are successfully using your product or service, so your job is done, right? Not quite. As long as your customers use your product, you will need to provide support and prompt them to make repeated purchases, be they to cross-sell or up-sell.
As such, it’s important to understand how long your customers will use your product. To understand this, the following questions are helpful.
- How likely are you to continue using this service?
- Likert scale with responses ranging from extremely unlikely to extremely like.
- Would you purchase this product again?
- Multiple choice (i.e. “Yes” / “Maybe” / “No”)
- Use skip logic to route to additional questions to explore why someone would not purchase your product again.
- How long do you think you will use this product?
- Multiple choice (i.e. “A few weeks” / “A month or longer” / “A year” / “More than one year”)
Applying Your Findings to Improve Your CX
Today, customers have multiple resources at their fingertips to help them assess your brand. As such, the customer experience you provide can make the difference between retaining a customer for life or losing them to a competitor.
While your customers shop around, the experiences they encounter along the way will influence their final purchasing decisions. Once they purchase your product or service, will they keep it and stay a loyal customer? Your CX may be the deciding factor.
Once the responses from your customer experience survey questions are in, you can start to sift through your findings and identify areas to improve CX at every step in the journey. You’ll be one step closer to attracting the right types of customers and keeping them satisfied throughout their entire relationship with your brand.
Frequently asked questions
What are some customer experience survey questions that ask about the discovery process?
To learn about the discovery process, you can ask questions about how customers first learned of your company, their first impression of your website, how your social media influences their feelings about your brand and what website features they utilized while making purchase decisions.
What are some customer experience survey questions that ask about the consideration process?
When researching the consideration process, you can ask questions about how easy it was for customers to find information on your website, what competitors they considered before choosing your company, how well customers think you conveyed certain aspects of your product and what customers believe to be the best aspect of browsing your website.
What are some customer experience survey questions that ask about the purchase process?
You can learn about the purchase process by asking questions about where customers purchased a product, how easy it was to purchase the product on your site and what you can do to improve the overall purchase experience.
What are some questions about usage and support?
You can learn about usage and support by asking questions about any problems customers might have encountered while using the product, what actions they took to overcome these problems and overall satisfaction with customer support and service.
What are some questions about retention?
To learn about customer retention, you can try asking questions about customers’ likelihood to continue using the service, if they will be repurchasing the product and how long they think they’ll be using the product.

Using B2B Surveys for Lead Generation & Scaling Your Business
Using B2B Surveys for Lead Generation & Scaling Your Business
 B2B surveys may appear to rarely be in use, but they are invaluable tools for B2B companies.
Although survey research is commonly used for B2C companies to better understand their target market, specific market segments and to test their own customer experience, B2B companies have plenty to gain from launching a survey campaign.
Even B2C companies benefit from B2B surveys, in that aside from catering to consumers, these companies must also bolster their relationships with their partners and business customers.
Surveys largely fuel B2B market research, but they are also the chief drivers of lead generation. This article explores B2B surveys and how B2B companies can use them for lead generation and scaling their business.
Defining B2B Surveys
A B2B survey is a survey designated for business professionals to complete so that a B2B business can better understand its target market and specifically, its partners, business clients and prospects.
The former two targeted respondent types are crucial for retention, while the latter is used for incoming business, i.e, lead generation. All three spheres are critical in the upkeep of a B2B business and as aforesaid, in B2C businesses at times.
As far as lead generation is concerned, B2B surveys provide a means for nurturing leads, bringing them closer to conversion.
How B2B Surveys Present an Important Force in the Sales Funnel
By nurturing leads, B2B surveys are crucial components of the sales funnel. Typically, these surveys are administered in the mid to late stages of the sales funnel, when prospects have some familiarity with a business and show some degree of interest.
Moreover, these surveys can also be sent to post-sales customers, i.e., partners, members and business customers. While surveys to those in the mid to late stages of the sales funnel help drive leads, post-sales B2B surveys encourage partner and customer retention.
This is because these surveys are used to probe business professionals on how to better serve them, which includes:
- Discovering pain points in your digital experience or content assets (reports, white papers, blogs, etc.)
- Identifying successful assets, experiences and communications
- Learning how to improve existing lead generation efforts (ex: questions on emails, assets, etc.)
- Understanding partners’ and prospects’ reactions to your product, solution or experience
- Finding the key information that prospects seek while using your product or navigating your content marketing assets.
How B2B Survey Differ from B2C Surveys
B2B surveys serve a different market and have different end goals than do B2C surveys. As such, although they are both surveys, they differ in several ways. As such, they each have their own set of challenges and benefits.
As we laid out the benefits in the above section, the below explains the differences between these types of surveys, so that you can properly differentiate and conduct a B2B survey.
Sampling Pool Methods and Size
The survey sampling methods are disparate between these survey types. First off, B2C surveys rely on random, aka, probability sampling, as they attempt to reach all consumers that fit under certain criteria as opposed to those who are in the mid-late stages of the sales funnel.
B2B sampling pools, on the other hand, are far more concentrated than their B2C counterparts. Thus, these pools use non-probability or non-random sampling. This relies on the researcher’s judgment instead of random selections and thus, not all members of a target population have an equal chance of being in the sample.
Since they only gather specific individuals to be part of the survey, B2B surveys are much smaller in the sampling pool size.
Targeting
B2B surveys are more targeted. As such, they may only seek professionals with particular job titles. This kind of hyper-targeting is not found in B2C surveys. With the targeting focused on specific individuals, these surveys tend to be qualitative in nature.
An example of targeting respondents in the mid-stages of the sales funnel involves those who already happened upon a B2B site and engaged with some of its digital offerings. For further reference: a VP of Marketing for a telecom company downloads a report from a B2B company that focuses on scaling in their vertical.
The survey can be attached to the downloadable asset, or emailed to the VP.
With B2B surveys, responses aren’t always anonymous. This is because they often ask respondents to fill in fields about their job departments, job titles and many times, their names as well. This is especially true in a nurture campaign, in which a business lead may for example, receive an ABM package, then discover a blog post, which leads to a report. Within this B2B phygital journey, they may be targeted, as B2B surveys help you keep track of your campaigns. A name is evidently the best identifier of the professional behind this journey.
Response Rates
Given that B2B surveys often rely on non-probability surveys, have smaller sample pools and are hyper-targeted, their response rates are commensurately smaller. This is not necessarily a negative aspect, as it allows market researchers to focus on the qualitative features of their research. Additionally, in a hyper-targeted campaign, researchers and B2B marketers take a more targeted approach to nurturing a particular professional, rather than a group marketing approach.
Survey Methodologies
B2B surveys don’t always generate responses from their first release. Sometimes they require sending multiple reminders to the respondents to complete their surveys. Other times, they may require different methodologies. If you’ve asked one of your partners or business clients to take part in a digital survey and they haven’t done so, consider conducting it over the phone. This is especially useful if you have meetings with such individuals regardless.
How to Use B2B Surveys for Lead Generation
There are several ways to generate leads and push prospects further down the sales funnel, or, at the very least, keep your current business clients and partners satisfied with your relationship with them. The following enumerates key actions that B2B surveys help you take in order to scale your business, whether that’s strengthening already existing business relationships, or creating new ones.
- Identifying valuable MQLs: B2B surveys provide key identifiers such as company names, positions, full names, emails and phone numbers. These identifiers alone can help you determine which respondents are MQLs, based on company size, funding stage and the respondent’s role. This also allows you to find the best content marketing asset to lead them to.
- Insights into Buying Readiness: These surveys allow you to see exactly who is ready to buy and who is considering a long-term business relationship. For example, SaaS companies often gain new customers via contracts. A B2B survey allows you to ask directly for answers to an MQL’s buying readiness, whether it’s a 6-month contract or a one-time purchase.
- Improving Your Content Strategy: For leads that require more nurturing, B2B surveys grant you insight into your leads’ content needs and preferences. Perhaps some leads prefer short-form content such as infographics and data bites. Or perhaps, they don’t care what kind of content piece it is, as long as it shows your product (ex: software, etc.) in action. Perhaps you need to inject more relevant content into your nurture program. A B2B survey can discover that, and even reel in trends within your industry by asking questions about them.
- Eliminating Pain Points: B2B surveys point you to your leads’ pain points. These can exist in your products/services themselves, in which case these surveys give insight into their user experience (UX). If so, these are insights you can use to improve your retention, so that current customers stay customers. Or, you can also reel in more leads, by finding the pain points within the sales funnel. Perhaps there is a webinar that your leads thought missed key information. Either way, knowing about these pain points is a critical step towards eliminating them, so that your leads feel that you take their considerations seriously and offer solutions.
- Providing Incentives: Your B2B survey strategy can benefit from providing incentives. Unlike consumer survey incentives, B2B incentives should be business-oriented. Therefore, a 20-dollar gift card or points on a mobile game won’t do. Rather, consider offering a small business promotion. For example, offer an enhanced trial of your offering. Ex: A SaaS company grants respondents a week of freemium access to their software.
Putting B2B Surveys into Action to Scale Your Business
There are many marketing efforts that have measurable scaling effects on businesses. With the current mobile-first digital age, content is king. However, content marketing alone is insufficient when it comes to catering to your B2B clients, partners and leads.
You need to understand their preferences, aversions and desires similarly to how you would with a consumer audience. This is how surveys make their way into the picture. B2B surveys help scale your business on a number of fronts.
From understanding your business customers for retention, to obtaining new leads and nurturing them down the funnel, these surveys are key for your business to scale — and in today’s competitive landscape, survive.
Frequently asked questions
What are B2B surveys?
B2B surveys are surveys designed for B2B purposes and therefore business professionals to complete. They provide firsthand feedback from the target market of the business. They can also be used by B2C businesses for gathering feedback from partners and vendors.
Why are B2B surveys an important part of the sales funnel?
B2B surveys are an important part of the sales funnel because they help nurture leads by helping B2B businesses understand the needs and wants of their audience. They’re often used in the middle/toward the end of the sales funnel when prospects are already interested in the business. Surveys sent in this stage help drive leads, while surveys sent post-sales to promote partner and customer retention.
How can B2B surveys be used to better serve business professionals?
B2B surveys can be used to identify various aspects of the digital experience, such as pain points, successful content assets, communication preferences, site elements, along with everything that the B2B respondents seek. . They can also bolster lead generation, by way of extracting key information that prospects crave while using your product or content marketing assets.
How are B2B surveys different from B2C surveys?
B2B surveys serve a different market than B2C surveys, and they have a different end goal, too. Instead of gathering information on how a business can help their audience, B2B surveys gather information on how a business can help other businesses. To accomplish this, they also have different survey sampling methods. B2B surveys tend to be more targeted and have a lower survey response rate.
What are the benefits of B2B surveys?
B2B surveys provide information like company names, positions, emails and phone numbers. They help B2B businesses find out who is ready to buy, as well as what businesses want a long-term relationship. B2B surveys also inform content strategy by providing insight into prospects’ needs and preferences. They can also help you eliminate pain points by revealing them to you.

How to Create a Customer Experience Survey to Retain Customers
How to Create a Customer Experience Survey to Retain Customers
A customer experience survey is a necessary tool to implement in your organization’s customer experience program. With CX carrying a major influence of the success of your business, it’s crucial to keep track of it.
This is because even in the competitive environment of B2C businesses, the product and cost alone are not sufficient enough to provide customer satisfaction, let alone to build loyalty.
The brands of today and the future are thriving due to the customer experience they provide.
A customer experience program refers to a methodical approach centered on improving the way a business interacts and engages with customers to improve their CX. Often this sort of program relies on a strong voice of the customer (VoC) in place.
That’s where the customer experience survey comes into play. This article explains this kind of survey in full depth so that you business can retain its customers.
Elucidating Customer Experience (CX)
Customer experience involves a variety of experiences that customers undergo in their interactions with a business. This involves all the stages in their customer journey, from viewing an advertisement to arriving at a landing page, to browsing your website, to making a purchase and all post-purchase experiences.
There are various elements that come into play with the CX; they all form a customer’s impression of a brand. These impressions are critical when it comes to maintaining customer loyalty. A bad CX incurs the risk of losing customers, as a 1 in 3 customers will leave a brand after just one poor experience.
There are more damning statistics, for example, even if a brand provides a good CX 9 out of 10 times, the one time that it fell short can lead to losing customers (even loyal ones).
As such, brands need to have a strong customer experience program as part of their business strategy. A customer experience survey is a potent tool, usually the main supplier of a customer experience program. By studying your CX with this survey, you’ll be able to improve your CX, thereby retaining customers.
Defining the Customer Experience Survey
A customer experience survey is a survey conducted to gauge various aspects of the customer experience. Brands can zero in on one component of their CX, or attempt to understand several.
Since CX involves the totality of customer interactions, behaviors and feelings, this survey can exist in a number of survey types. The following list enumerates the surveys that help you determine the state of your customer experience.
These surveys show the macro-levels, i.e., the disciplines within marketing, business, et al., that you can base around your customer research. As such, they all include their own specific types of surveys, subtypes that show you how deep and granular survey research can become.
The survey types fortifying customer experience research:
- Customer satisfaction survey
- Helps brands focus on multiple factors of customer satisfaction
- Includes the Net Promoter Score (NPS), Customer Satisfaction Score (CSAT), Customer (CES), visual ratings and custom surveys
- Product satisfaction survey
- Focuses on the product side of a business
- Includes surveys on product glitches, shipping experience and product retention
- Business survey
- Deals with key areas of business like understanding customer personas and discovering how the competition ranks against your CX.
- Measures brand awareness as it ties with several business aspects focused on the business itself
- Cross-sectional survey
- Studies a particular population at one particular point in time.
- It helps you determine your CX at a snapshot level, within a particular respondent group or market segment.
- Customer loyalty survey
- Measure the chief objective of CX: customer loyalty
- Includes surveys hinging on the Customer Lifetime Value (CVL) and the Customer Lifetime Value (CVL).
What It Helps You Study In the Customer Experience
There are multiple touchpoints in customer journeys. The customer experience survey is meant to address them all by capturing customer sentiment within each of them. These touchpoints make up the customer lifecycle; understanding how CX is relevant to them will help you form your survey, improving your experience as a result.
Mapping Out the Customer Experience in Key Stages
This is a critical phase of the customer journey, including multiple stages that a customer undergoes before making a purchase. These include:
- Early sales funnel experiences
- Online portals, billboards, physical advertisements and all else that brings awareness to your brand or a specific offering.
- Middle of the funnel interactions with customer representatives, digital journeys and social media visits.
- Late-stage experiences such as saving products for later, comparing products and using the checkout.
- Post-sales experience
- Involves ensuring that customers are happy with your products.
- Regular post-sale checkouts via surveys, emails, etc.
- This phase digs back into the previous one to collect feedback on the brand/sale discovery and ordering experiences.
- Upselling vs Returns
- Finding opportunities for upsells, cross-sells or repeat purchases, i.e., surveying customers on their future engagement or lack thereof with the company.
- Includes surveying unsatisfied customers who cancel, downgrade or return their purchases.
Creating a Customer Experience Survey
After you decide which stage of the customer experience you need to study based on the sections above, consider the following list. Many times, delivering the best customer experience involves surveying customers across all stages. Here are the steps to form an informative CX survey:
- Put together your most pressing curiosities about your CX.
- Organize them into several groups based on shared characteristics.
- Based on these groupings, filter each with a corresponding CX stage by referring to the above section.
- Find the most proper campaign within the phase you choose to study first.
- Ex: Let’s say you’re studying early sales funnel experiences. You decide you’d like to survey customers on how they found your brand and whether they enjoyed the experience. As such, you will want to study your ad campaigns, be they digital or physical (subway ads for example, in a particular city).
- Once you connect your sales funnel stage with a broader campaign, divide that campaign into several smaller, more specific survey premises.
- In reference to the above example, you may have multiple ad campaigns; base your survey on one of those campaigns, or create one that tests respondents on whether they are aware of one or multiple advertisement campaigns.
- Decide on which kind of survey best fits your particular survey campaign from the above list.
- Next, choose a specific survey from the survey types you’ve selected above.
- Put together several questions, these can begin as high-level questions and wade into those that specifically ask respondents to rate their experience. Examples:
- What was the best part about browsing our site?
- How did you feel about [example] element?
- What can we do better to improve your experience?
- Did you find it easy or difficult to [browse our site, speak with our rep, ex]?
- If you choose visual ratings questions (ratings via stars, numbers or some other visual element), consider providing open-ended follow-up questions to understand the reasoning behind their responses.
- Remember to thank your respondents at the end of the survey (or beginning) and remind them that their participation helps your brand improve the experience for consumers like them.
Making the Most of Your Customer Experience Survey
Although you are assessing your consumers’ experiences through this survey, the survey itself is another customer experience for your consumers. This is predominant in this survey type, as it doesn’t simply mention your brand.
Rather, it is based solely on the feelings and attitudes surrounding your brand’s CX, rather than general customer habits like, for example, a regular consumer survey, a longitudinal survey and others. Such surveys depend on understanding customers and external influences, whereas a customer experience survey focuses on your business.
As such, keep in mind that as yet another experience, this survey will shape your customers’ and target market’s perception about your business, so follow the above best practices, along with the many others, such as what to look for in online survey tools. In this regard, the survey platform you use is equally important to the CX of your CX survey.
Frequently asked questions
What is a customer experience survey?
A customer experience survey is a survey that collects data on different aspects of the customer experience. Brands can use customer experience surveys to narrow their focus on one component of the CX or even examine their overall CX.
Why is a customer survey experience important?
A customer experience survey is important because of the weight CX carries in influencing the success of your business. Customer experience surveys are usually the main supplier of customer experience programs. Studying them helps you improve your CX and retain customers as a result.
How do you create a customer experience survey?
To create a customer experience survey, you must first choose an area of your CX to study and select the campaign that matches this characteristic. Then, decide which survey type will fit your campaign and put together questions that require visual ratings or are open-ended. Finally, thank the respondents at the end of the survey and consider offering incentives.
How is a customer experience survey different from a regular consumer survey?
A customer experience survey revolves around your customer experience, which includes all the feelings and perceptions your brand incites in a customer journey, rather than general customer habits.
Why is the survey platform you use important to the results of customer experience (CX) survey?
Using the proper online survey platform helps streamline the survey research process. With the right platform, you can reach your intended target audience, screen them for behavioral and psychographic needs, ask of variety of question types, route them to correct questions based on previous answers and gain insights at speed.

What is the Margin of Error & How to Reduce it in Your Survey
What is the Margin of Error & How to Reduce it in Your Survey
You may have pondered, what is the margin of error during your survey research, as this figure is sure to come up when analyzing data and forming an accurate reading of survey results.
In survey research and statistics, this pesky error rears its ugly head omnipresently. Commonly called the margin of error, this phenomenon is also referred to as the confidence interval. Despite the latter name, it is in the best interest of researchers to keep this metric low.
This is because, no matter who you survey or how many people, it is impossible to garner responses that represent everyone in the target population of your study. This is where the core of the margin of error lies, as it shows researchers how much of a survey’s results represent the views of its target population.
This article explains what is a margin of error and how to reduce it in your survey.
Defining the Margin of Error
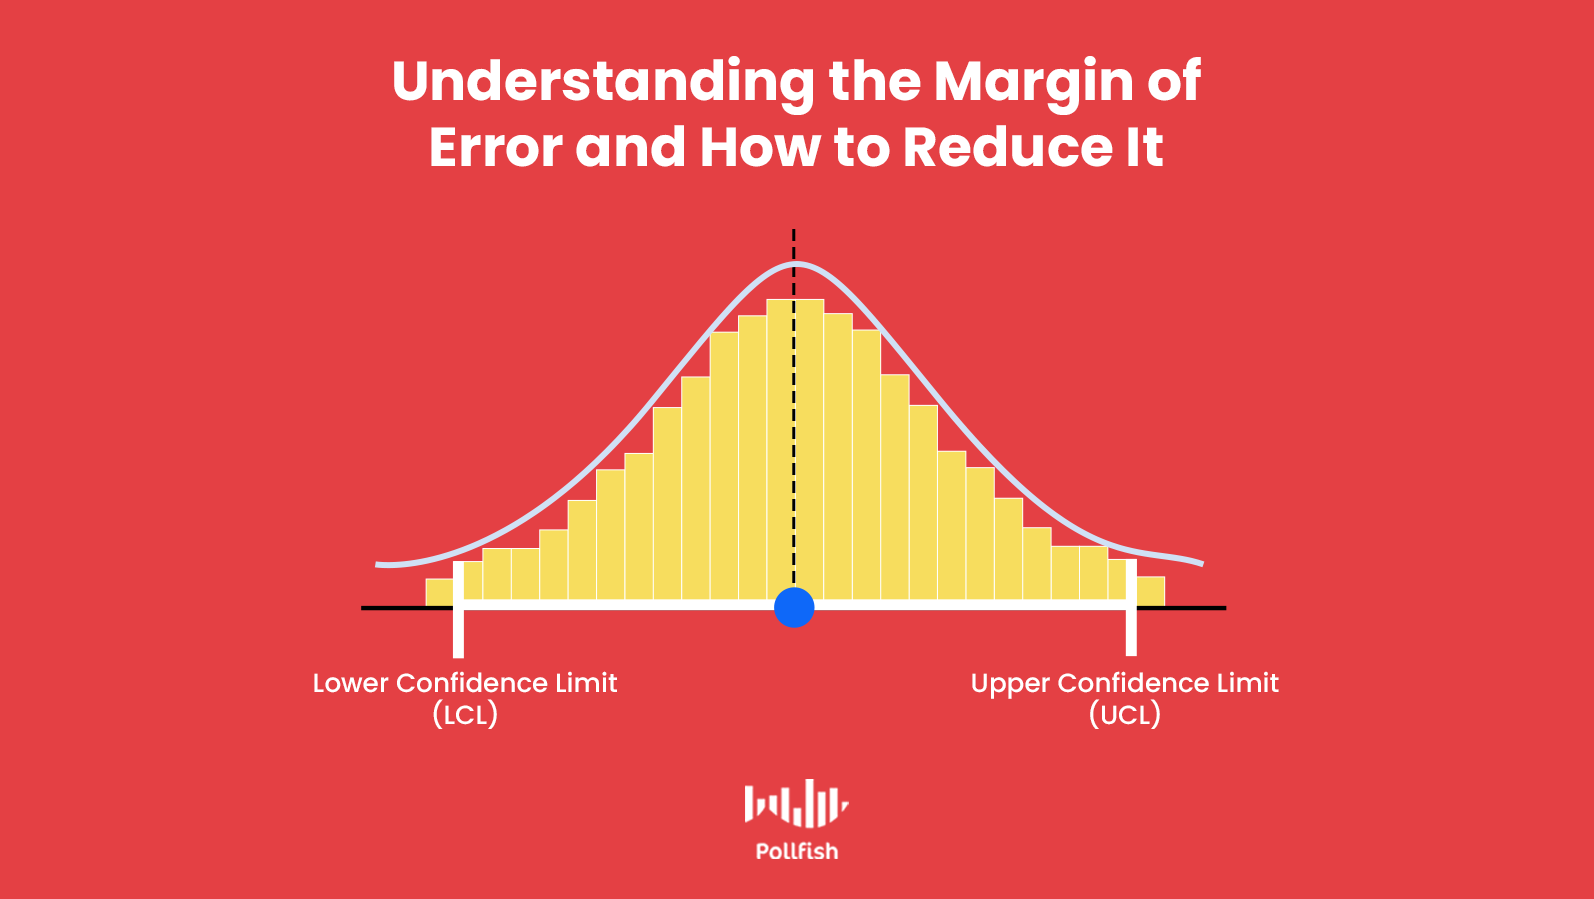
The margin or error — or the confidence interval — is a measurement of error in the results of a survey, specifically one that relies on the random sampling method. This metric shows researchers the degree to which they can expect survey results to reflect the views of the overall studied population.
As aforesaid, it is imperative to keep the margin of error low, as a high one points to a smaller likelihood of survey results to reflect the true views of your target population. As such, a higher margin of error renders your survey less reliable and inconclusive.
Moreover, a higher confidence interval (a misnomer as it may be) makes your survey unable to be used for statistical methods, such as in quantitative studies. It also debilitates descriptive and qualitative research.
Researchers should thus aim for a lower margin of error, as it denotes higher confidence of a survey results’ accuracy, whereas a higher one signifies the opposite.
The Utility of Studying the Margin of Error
While this statistic may be a frustrating reality in survey research, it is crucial to keep track of it. This is because survey data, necessary and enlightening as it may be, is imprecise. Why? Because survey samples represent a chunk (usually a small one) of your target population, and an even smaller one if it is in relation to your entire target market.
Since a sampling pool (survey respondents) represents a larger population, there will always be the presence of uncertainty and imprecision.
The confidence interval is useful in that it calculates this inherent imprecision to allow researchers to see how trustworthy their survey results are in representing a certain population.
Additionally, the margin of error helps researchers determine the accuracy of a value, by expressing it in a range. The margin of error supports this, since the resulting answers of a survey question get assigned a percentage for statistical survey analysis.
But since it is impossible to survey every last member of a target population, this percentage is only representative of the sampling pool. The margin of error allows this percentage to be expressed as a range to more accurately represent the answer in relation to the entire target population.
For example, if a survey’s results show that 40% of respondents sit while listening to music, this figure is incomplete. When you calculate the margin of error, on the other hand, it helps turn this figure into a more precise representation. If the margin of error turns out to be 4%, the percentage of 40% can be expressed as a range of 36-44%.
How to Calculate the Margin of Error
Calculating the margin of error requires plugging in a few variables into a formula. These include your sample size and the population standard deviation. The latter variable requires a calculation of its own.
The standard deviation is a measure of the spread of scores in a data set that pertains to a specific population. A low standard deviation entails that most of the scores are closer to the average one, while a higher standard deviation shows that the scores are more dispersed. In short, this metric is also used for the purposes of data reliability.
These variables are just a few of the key aspects of calculating the margin of error. Below is the formula in its entirety.

The Formula Explained in Steps:
- Find the population standard deviation (σ) and determine your sample size (n).
- Get the square root of your sample size.
- Divide the population standard deviation (σ) by the result of the square root calculation.
- Multiply this result by the z-score that corresponds with your desired confidence level — not to be confused with the confidence interval (which is the margin of error).
*Use the table below to find the z-score.
| z*-Values for Selected (Percentage) Confidence Levels | |
| Percentage Confidence | z*-Value |
| 80 | 1.28 |
| 90 | 1.645 |
| 95 | 1.96 |
| 98 | 2.33 |
| 99 | 2.58 |
How to Reduce the Margin of Error

As a researcher or business owner studying your target market, you are probably wondering how to reduce the margin of error. After all, a more reliable survey is going to be far more useful and one less obstacle to contend with.
Here are several best practices to input into your survey research, to reduce the confidence interval. This will help make individual answers, as well as their ensuing variables (such as mean and average), become more precise.
- Reduce the data variability. This will lessen the margin of error, as the less data variation you have, the more accurately you can estimate a parameter surrounding the population. When you reduce variability, the standard deviation also narrows, causing the margin of error to follow suit.
- Do this by changing how you gather the data. Ex: make precise measurements, make your process more orderly.
- Enlarge your sample size. Using a larger sample size allows you to make more observations. In turn, this will create a smaller interval around your sample statistic. By collecting more data, you can acquire a more exact estimate of a population parameter.
- Bear in mind that a larger sample size may require more time and resource allocation.
- Use a lower confidence level. A lower confidence level grants your margin of error with more precision, causing it to narrow. The drawback to this action is that the margin of error will then have less confidence in carrying the population parameter you need to find.
- You should thus only lower the confidence level if the benefit of more precision (a reduced margin of error) outweighs the disadvantage of a lessened confidence level.
- Example: If increasing the sample size is too costly for you, then lower the confidence level for a decreased confidence interval. Just remember, your confidence level has declined.
- Reduce the data variability. This will lessen the margin of error, as the less data variation you have, the more accurately you can estimate a parameter surrounding the population. When you reduce variability, the standard deviation also narrows, causing the margin of error to follow suit.
- Implement a one-sided confidence interval. This has a smaller margin of error than a two-sided confidence interval. This interval signifies only if a parameter is either smaller than or greater than a cut-off value.
- It doesn’t show any information about the parameter on the opposite side. As such, use this to increase an estimate’s precision of an estimate only if you fear the estimate will be greater or less than a cut-off value, i.e., not both.
Using the Correct Survey Platform
Can using a strong online survey tool help decrease the margin of error? The answer is rather complicated. On one hand, a strong survey tool will help you avoid inaccuracies (think gibberish answers, straightlining, etc.) and illogical questions. It can also help ambiguity with open-ended questions.
These aspects are certainly crucial in helping eliminate ambiguity. But there are things that affect the margin of error that a survey simply has no control over.
For example, the population size and confidence level are factors outside of a survey and its hosting platform.
With this in mind, you should understand that the margin of error cannot be fully diminished. It is impossible to perfectly align with the population you’re surveying. Especially when certain respondents have a tendency to change their minds. However, you can still determine how close you are to precisely reflecting their views by determining the margin of error yourself, or by calculating it with a designated tool (such as the one hyperlinked at the very beginning of this article).
What’s most important about an online survey platform is that it can deliver peace of mind on so many aspects that go into survey research, minimizing the labor that you need to exert into your studies and making the process much smoother and easier when it comes to reaching results (and analyzing them).

Understanding the 3 Main Types of Survey Research & Putting Them to Use
Understanding the 3 Main Types of Survey Research & Putting Them to Use
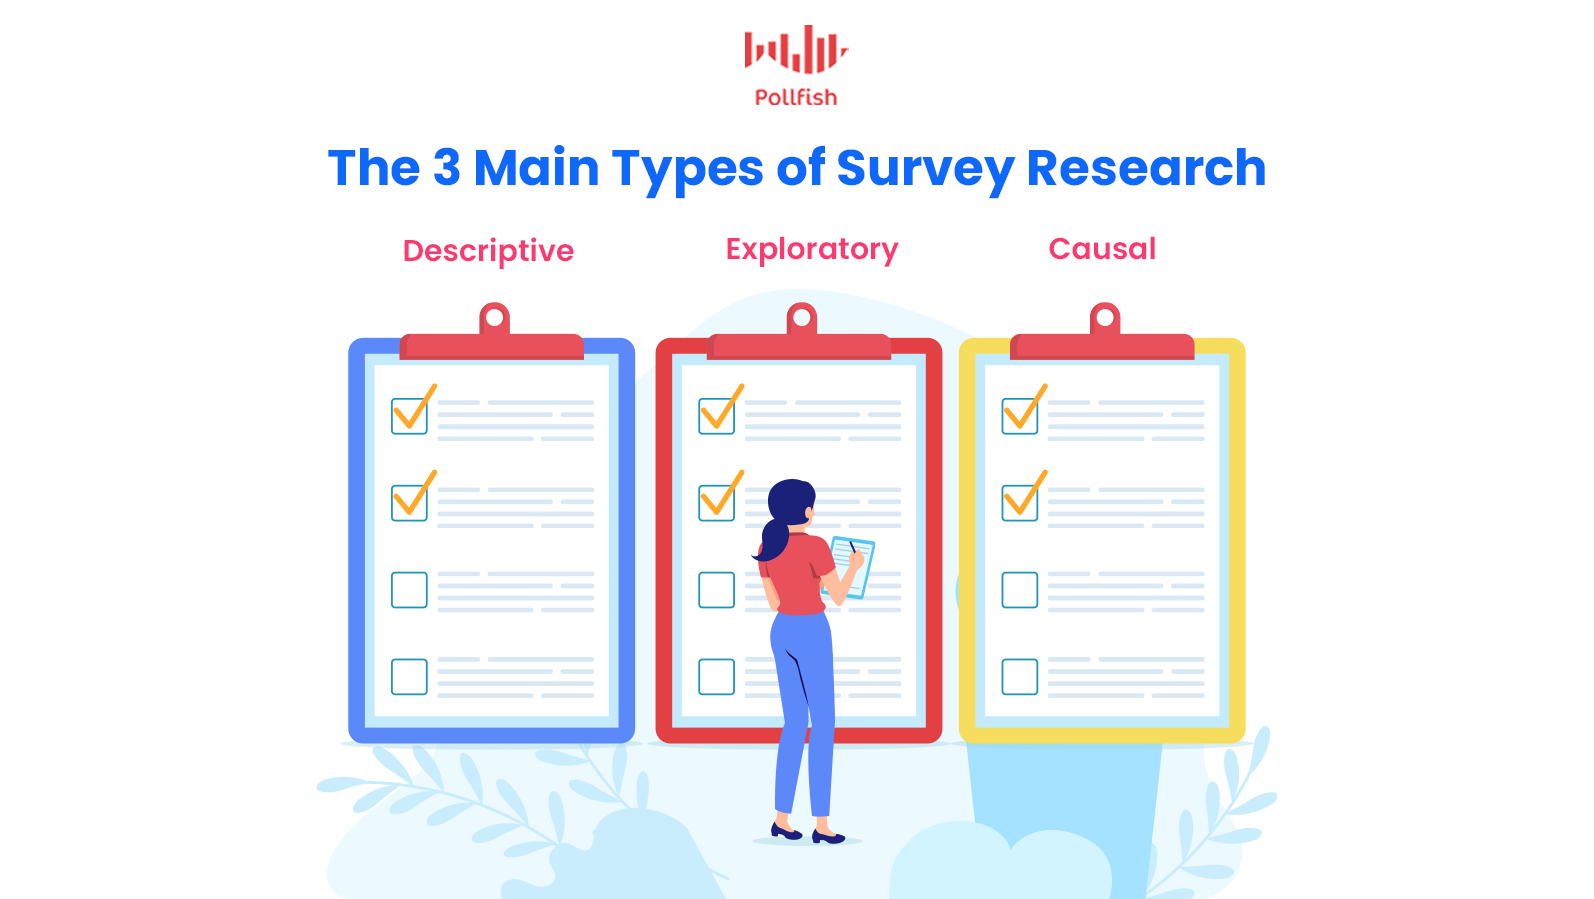
Surveys establish a powerful primary source of market research. There are three main types of survey research; understanding these will not merely organize your survey studies, but help you form them from the onset of your research campaign.
It is crucial to be proficient in these types of survey research, as surveys should never be used as lone tools. A survey is a vehicle for granting insights, as part of a larger market research or other research campaigns.
Understanding the three types of survey research will help you learn aspects within these forms that you were either not aware of or were not well-versed in.
This article explores the three main types of survey research and teaches you when to best implement each form of research.
Putting the Types of Survey Research into Perspective
With the presence of online surveys and other market research methods such as focus groups, there are ever-growing survey research methods. Before you choose a method, it is critical to decide on the type of survey research you need to conduct.
The type of survey research points to the kind of study you are going to apply in your campaign and all of its implications. The survey research type essentially hosts the research methods, which house the actual surveys. As such, the research type is one of the highest levels of the process, so consider it as a starting point in your research campaign.
Remember, that while there are various research types, the three presented in this article delineate the main types used in survey research. Researchers can apply these types to other research techniques (such as focus groups, interviews, etc.), but they are best suited for surveys.
Descriptive Research
The first main type of survey research is descriptive research. This type is centered on describing, as its name suggests, a topic of study. This can be a population, an occurrence or a phenomenon.
Descriptive research is often the first type of research applied around a research issue, because it paints a picture of a topic, rather than investigating why it exists to begin with.
The Key Aspects of Descriptive Research
The following provides the key attributes of descriptive research, so as to provide a full understanding of it.
- Makes up the majority of online survey methods.
- Concentrates on the what, when, where and how questions, rather than the why.
- Lays out the particulars surrounding a research topic, but not its origin.
- Handles quantitative studies.
- Deemed conclusive due to its quantitative data.
- Provides data that provides statistical inferences on a target population.
- Preplanned and highly structured.
- Aims to define an occurrence, attitude or opinions of the studied population.
- Measures the significance of the results and formulates trends.
- Can be used in cross-sectional and longitudinal surveys.
Survey Examples of Descriptive Research
There are various types of surveys to use for descriptive research. In fact, you can apply virtually all of them if they meet the above requirements. Here are the major ones:
- Descriptive surveys: These gather data about different subjects. They are set to find how different conditions can be gained by the subjects and the extent thereof. Ex: determining how qualified applicants are to a job are via a survey checking for this.
- Descriptive-normative surveys: Much like descriptive surveys, but the results of the survey are compared with a norm.
- Descriptive analysis surveys: This survey describes a phenomenon via an analysis that divides the subject into 2 parts. Ex: analyzing employees with the same job role across geolocations.
- Correlative Survey: This determines whether the relationship between 2 variables is either positive or negative; sometimes it can be used to find neutrality. For example, if A and B have negative, positive or no correlation.
Exploratory Research

Exploratory research is predicated on unearthing ideas and insights rather than amassing statistics. Also unlike descriptive research, exploratory research is not conclusive. This is because this research is conducted to obtain a better understanding of an existing phenomenon, one that has either not been studied thoroughly or is lacking some information.
Exploratory research is most apt to use at the beginning of a research campaign. In business, this kind of research is necessary for identifying issues within a company, opportunities for growth, adopting new procedures and deciding on which issues require statistical research, i.e., descriptive research.
The Key Aspects of Exploratory Research
Also called interpretative research or grounded theory approach, the following provides the key attributes of exploratory research, including how it differs from descriptive research.
- Uses exploratory questions, which are intended to probe subjects in a qualitative manner.
- Provides quality information that can uncover other unknown issues or solutions.
- Is not meant to provide data that is statistically measurable.
- Used to get a familiarity with an existing problem by understanding its specifics.
- Starts with a general idea with the outcomes of the research being used to find related issues with the research subject.
- Typically exists within open-ended questions.
- Its process varies based on the new insights researchers gain and how they choose to go about them.
- Usually asks for the what, how and most distinctively, the why.
- Due to the absence of past research on the subject, exploratory research is time-consuming,
- Not structured and flexible.
Examples of Exploratory Research
Since exploratory research is not structured and often scattered, it can exist within a multitude of survey types. For example, it can be used in an employee feedback survey, a cross-sectional survey and virtually any other that allows you to ask questions on the why and employs open-ended questions.
Here are a few other ways to conduct exploratory research:
- Case studies: They help researchers analyze existing cases that deal with a similar phenomenon. This method often involves secondary research, unless your business or organization has case studies on a similar topic. Perhaps one of your competitors offers one as well. With case studies, the researcher needs to study all the variables in the case study in relation to their own.
- Field Observations: This method is best suited for researchers who deal with their subjects in physical environments, for example, those studying customers in a store or patients in a clinic. It can also be applied by studying digital behaviors using a session replay tool.
- Focus Groups: This involves a group of people, typically 6-10 coming together and speaking with the researcher, as opposed to having a one on one conversation with the researcher. Participants are chosen to provide insights on the topic of study and express it with other members of the focus group, while the researcher observes and acts as a moderator.
- Interviews: Interviews can be conducted in person or over the phone. Researchers have the option of interviewing their target market, their overall target population, or subject matter experts. The latter will provide significant and professional-grade insights, the kind that non-experts typically can’t offer.
Causal Research
The final type of survey research is causal research, which, much like descriptive research is structured, preplanned and draws quantitative insights. Also called explanatory research, causal research aims to discover whether there is any causality between the relationships of variables.
As such, focuses primarily on cause-and-effect relationships. In this regard, it stands in opposition with descriptive research, which is far broader. Causal research has only two objects:
- Understand which variable are the cause and which are the effect
- Decipher the workings of the relationship between the causal variables, including how they will hammer out the effect.
The Key Aspects of Causal Research
The following provides the key traits of causal research, including how it differs from descriptive and exploratory research.
- Considered conclusive research due to its structured design, preplanning and quantitative nature.
- Its two objectives make this research type more scientific than exploratory and descriptive research.
- Focuses on observing the variations in variables suspected as causing the changes in other variables.
- Measure changes in both the suspected causal variables and the ones they affect.
- Variables suspected of being causal are isolated and tested to meet the aforesaid two objectives.
- This experimentation shows researchers whether it is worth investing in a variable or to get rid of it.
- For example, an advertisement or a sales promotion
- Requires setting objectives, preplanning parameters, and identifying potential causal variables and affected variables to reduce researcher bias.
- Requires accounting for all the possible causal factors that may be affecting the supposed affected variable, i.e., there can’t be any outside (non-accounted) variables.
- All confounding variables that can affect the results have to be kept consistent and controlled to make sure no hidden variable is in any way influencing the relationship between two variables.
- To deem a cause and effect relationship, the cause would have needed to precede the effect.
Examples of Causal Research
Causal research depends on the most scientific method out of the three types of survey research. Given that it requires experimentation, a vast amount of surveys can be conducted on the variables to determine if they are causal, non-causal or the ones being affected.
Here are a few examples of use causal research
- Product testing: Particularly useful if it’s a new product to test market demand and sales capacity.
- Advertising Improvements: Researchers can study buying behaviors to see if there is any causality between ads and how much people buy or if the advertised products reach higher sales. The outcomes of this research can help marketers tweak their ad campaigns, discard them altogether or even consider product updates.
- Increase customer retention: This can be conducted in different manners, such as via in-store experimentations, via digital shopping or through different surveys. These experiments will help you understand what current customers prefer and what repels them.
- Community Needs: Local governments can conduct the community survey to discover opinions surrounding community issues. For example, researchers can test whether certain local laws, transportation availability and authorizations are well or poorly received and if they correlate with certain happenings.
Deciding on Which of the Types of Research to Conduct
Market researchers and marketers often have several aspects of their discipline that would benefit off of conducting these three types of survey research. What’s most empowering about these types of survey research is that they are not limited to surveys alone.
Instead, they bolster the idea that surveys should not be used as lone tools. Rather, survey research powers an abundance of other market research methods and campaigns. As such, researchers should set aside surveys after they’ve decided on high-level campaigns and their needs.
As such, consider the core of what you need to study. Can your survey be applied to a macro-application? For example, in the business sector, this can be marketing, branding, advertising, etc.
Next, does your study require a methodical approach? For example, does it need to focus on one period of time among one population? If so, you will need to conduct a cross-sectional survey.
Or does it require to be conducted over some period of time? This will require implementing a longitudinal study. Once you figure out these components, you should move on to choosing the type of survey research you’re going to conduct. However, you can also decide on this before you choose one of the methodical methods.
Whichever route you decide to take, you’ll need a strong online survey provider, as this does, after all, involve surveys. The correct online survey platform will set your research up for success.
Frequently asked questions
Why is it important to understand the types of survey research?
The type of survey research informs the kind of study you’ll be conducting. It becomes the backbone of your campaign and all its implications. Basically, the types of survey research host their designated research methods, which house the surveys. Therefore, the types of survey research you decide on are at the highest level of the research process and act as your starting point.
What is exploratory research?
Exploratory research is the most preliminary form of research, establishing the foundation of a research process. focuses on unearthing ideas and insights rather than gathering statistics. It’s not a conclusive form of research-- rather, it is conducted to bolster understanding of a specific phenomenon. It is typically the first form of research, setting the foundation for a research campaign.
What is descriptive research?
Descriptive research focuses on describing a topic of study like a population, an occurrence or a phenomenon. It is performed early on in the overall research process, as it paints an overall picture of a topic, while extracting the key details that you wouldn’t find with exploratory research alone.
What is a cross-sectional survey?
A cross-sectional survey is a survey used to gather research about a particular population at a specific point in time. It is considered to be the snapshot of a studied population.
What is causal research?
Causal research is typically performed in the latter stages of the entire research process, following correlational or descriptive research. It is conducted to find the causality between variables. It involves more than merely observing, as it relies on experiments and the manipulation of variables
How can you decide which types of survey research to conduct?
Take a look at the core of what you need to study. Are you trying to focus on one period of time among a population? Does your survey research need to be conducted over a period of time? Questions like these will lead you to the right research type.

Improve the Customer Experience with a User Testing Survey
Improve the Customer Experience with a User Testing Survey
Regardless of the size or vertical of your business, it can benefit from a user testing survey. This specific survey helps you capture how your customers use your product, engage with your online portals, assess their customer journeys and form their overall view on their customer experience (CX).
User testing is the gold standard for understanding how people interact with a product or interface in order to improve it. Unfortunately, the high cost associated with usability testing causes some business owners to forgo the process altogether.
While the insights provided through professional usability testing are invaluable, a user testing survey is an alternative for business owners who do not have the time or budget for traditional user testing. It’s also a good option for anyone who wants quick feedback at several key points in the product or interface development cycle.
This article explores how a user testing survey can yield critical information that helps your business boost the overall user experience
Defining the User Testing Survey
A user testing survey might be the right tool for you if you need to to learn exactly how people interact with your product, service, or a multitude of customer experience interfaces, but don’t have the time or budget to commit to the process of usability testing. Before we explore the nuts and bolts of a user testing survey, it’s important to have a basic understanding of usability testing.
User Testing Overview
Also known as usability testing, user testing is a method used to evaluate how people use and interact with a product or user interface. User testing gives business owners, product developers, along with all those on the digital team an opportunity to see their offerings in action to reveal their strengths and weaknesses.
Usability testing is most commonly used to test consumer products, websites or applications, and computer interfaces including the vast experiences and elements thereof.
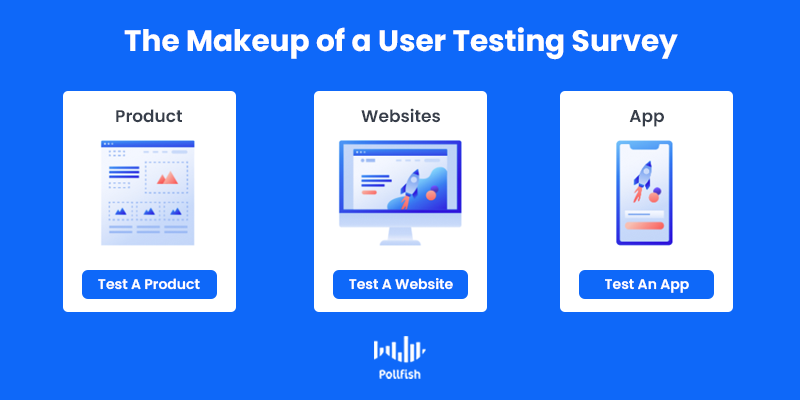
During user testing, researchers will systematically observe how customers interact with a business’s vast array of offerings. or products. In most cases, user testing is performed with individuals who have never encountered or used the product before. This helps business owners quickly identify barriers that may impede product adoption.
While user testing has countless applications, it tends to share three main goals regardless of the user experience that is under evaluation. These are:
- Uncovering problems in the design of a user experience.
- Identifying ways to enhance the user experience of a product, service, online experience and all other customer experience (CX) types.
- Understanding how customers use the interface and how they feel while doing so
User testing is an involved process that typically involves planning, execution, and analysis phases, so many businesses rely upon a usability company to conduct user testing. Larger product development and computer or web development companies often have an internal usability department because user testing is integral to the success of their business.
Relying on a User Testing Survey
Given the expertise and time required to conduct user testing, hiring a usability company often comes with a steep price tag. As a result, budget-conscientious companies may avoid conducting user testing, which can be a costly mistake.
If your goal is to improve the user experience around your offering, but are constrained by a tight budget a user testing survey may provide an appropriate alternative to traditional user testing. In the usability survey process, a survey is distributed to customers who have used the product in order to gain insights about their experience.
The survey contains detailed, targeted questions about the user experience. In addition, brands can stand to include questions about the respondents’ feelings or opinions throughout their user experience.
While not ideal for diving deep into the issues that people encounter when using your product, user testing surveys can be used at certain key touchpoints when more general information is needed.
The Pros & Cons of a User Testing Survey
In comparison to traditional usability testing, a user testing survey offers some distinct benefits, but there are also some limitations associated with this tool. It’s important to have a clear understanding of the advantages and disadvantages before deciding to conduct a user testing survey.
The Advantages
- Cost-effective. You can develop and distribute a survey yourself, rather than hiring a usability company.
- Fast and easy to repeat. You can create a survey and distribute it within a day if needed. This makes it easy to quickly gather insights with each product iteration.
- Easy to collect feedback from a broad range of respondents. With traditional user testing, users are typically observed one at a time by the researchers. This naturally limits the number of users that can be observed within a given time period or budget.
- Gather large amounts of demographic data. By collecting demographic data at the outset of the survey, you can also gain a better idea about how demographics influence usability.
- Ability to compile both qualitative and quantitative answers. You can use a combination of open-ended and close-ended questions in order to obtain personalized and detailed responses, as well as those that can be quantified for easy analysis.
The Disadvantages
A user testing survey is not the perfect solution for every company or development iteration. Some limitations of a user testing survey include:
- Loss of direct observation. Traditional user testing lets you view exactly how your target audience uses your product. This enlightening and rewarding experience is not possible to replicate through a user testing survey.
- User recall may decrease the accuracy of the results. In traditional user testing, a researcher observes and talks to the participant in real-time. When you conduct a user testing survey, the participant is answering questions in retrospect. This may result in less accurate answers than you would get from direct observations.
- Insights may be broad, rather than specific. Sometimes, you will need to focus on very minute, specific interactions, which can only happen via direct observation.
The Applications of User Testing Surveys
User testing surveys can be used to gain deeper insights into many different types of products. Here are some examples of how user testing surveys can be used to:
- Understand user preferences for font style, size, or spacing on a website.
- Learn what emotions a new logo design invokes.
- Gather feedback about the level of frustration experienced with certain aspects of a shopping experience.
- Determine user preference for two distinct design styles in a website redesign process.
- Learn how users feel about their initial experience with a new phone.
- Test a new landing page to ensure it will convert well.
- Gauge the success of a new feature in a dashboard of a customer portal.
- Assess whether a new checkout flow is user-friendly.
- Determine if a chatbot provides an acceptable level of customer support.
- Understand how users access supplemental information about product sizing on a clothing website.
Remember that user testing is different from market research. It extends beyond simply gathering information about preferences, and seeks to identify barriers in the user experience.
Take It to the Next Level with a User Testing Survey
A user testing survey is a useful tool to quickly gather insights into the ease of use of a wide variety of your experiences. If you’re on a budget or under a tight deadline, a user testing survey may be the only way that you can gather vital information you need to make informed decisions about your product’s evolution.
In other cases, you may wish to utilize user testing surveys to complement a more in-depth usability testing process. By supplementing formal usability testing with surveys, you can gather insights from a larger group of users and use quantitative data to identify trends among user segments.
The applications of these surveys are endless and the cost to experiment with this form of usability testing is low. For this reason, user testing surveys are steadily gaining a foothold within businesses’ usability efforts.
Frequently asked questions
What is a user testing survey?
A user testing survey is a survey that helps you understand how your customers engage with your product and online portals as well as assess their customer journey and their perception of their customer experience (CX).
What is the user testing process?
The user testing process has three phases: planning, execution, and analysis. During this process, researchers observe how customers interact with a business’s offerings or products. In the usability survey process, surveys are distributed to customers who have used the product. The survey provides information on customer insights and their experience using the product.
What are the main goals of user testing?
User testing has three main goals: uncovering design problems, identity areas of improvement for user experience and customer experience and understanding how customers use the user interface and how they feel about it.
How much does user testing cost?
User testing cost depends on the online survey platform a researcher uses. Since you can develop and distribute surveys yourself, it is way more cost-effective than hiring a usability company. It’s also a faster option and can be easily repeated.
Is user testing the same as market research?
While it’s not the same as market research, it is a practice that market research can also gather. Specifically, it looks into how customers interact with the products or services a business offers. User testing is a specific type of market research that extends beyond gathering information about preferences to reveal issues with the user experience.

How to Conduct Telecom Market Research Like a Pro
How to Conduct Telecom Market Research Like a Pro

As 2020 began, it was hard to imagine a scenario that would cause our society to become even more dependent upon the telecommunications industry. Yet, 2020 did exactly that by demonstrating that we could create a “new normal” thanks to the incredible power of telecommunications.
Telecommunications companies enabled the world to keep moving, albeit in a completely new way. While people around the world scrambled to set up home offices, classrooms, and new distribution channels, telecom companies raced to keep up with increased demands on the network.
Now a year after the crisis began, telecoms are ready to move out of survival mode and into growth mode. As the traditional players and telecom startups think about post-COVID growth, they rely upon telecom market research to help them understand the demands of this evolving landscape.
An Increased Demand on Telecoms
Woven into nearly every aspect of daily life, the telecom sector already powered business transactions and communications, connected increasingly smart homes, kept a steady stream of entertainment on tap, and facilitated conversations across the entire globe.
Yet, our true reliance upon telecommunications was demonstrated when the world was forced to find new ways to work and communicate as the COVID-19 crisis unfolded. Almost overnight, we found ourselves even more reliant on telecommunications.
A dramatic number of new businesses began to operate remotely and were able to do so because of the existing telecom infrastructure. Education moved almost entirely online. Cinemas and concert venues closed, sky-rocketing the demand for online entertainment.
Even our happy hours moved online, as we sought ways to connect with friends, family, and colleagues from afar. From the safety of our homes, we discovered that telecoms could keep the world connected and our economy afloat while we remained physically apart.
Reasons to Conduct Telecom Market Research in 2021
After the disruption brought by COVID, strategists are once again able to identify areas for growth in the telecom market. Here are some of the ways that telecom market research can help businesses thrive in 2021:
- Understand how customers’ needs have changed. Everything has changed, from the way companies work, to how we shop, to how we access entertainment. Market research can help understand how the needs of various market segments have evolved and what a practical outlook for the future is.
- Rethink entertainment experiences. With cinemas and live venues closed, consumers are looking for new sources of entertainment. Content and distribution are more intertwined than ever. Telecoms must rethink their entertainment bundles and partners to stay abreast of consumer demands for new experiences.
- Measure the new financial reality. While 25% of consumers plan to subscribe to more media services in the next year, many of them will have smaller budgets now. Market research can help companies explore tiered subscription opportunities and in-experience ads to offset costs.
- Identify new products and services. With an increased reliance on telecoms, there is ample opportunity to introduce new products and services into the market.
- Determine how to leverage next-generation technology. As the rollout of 5G continues, telecom market research can provide insights into new business opportunities that will be available with increased mobile speed.
The Makeup of Telecom Market Research

As with other types of technology market research, telecom market research involves collecting both primary and secondary sources of information.
For example, in 2017, Vodafone conducted a breakthrough market research project to study the target market of 18 - 24 year olds. Their research efforts culminated in the production of video ads that outperformed other telecom brands and resulted in an impressive 65% increase in brand recall.
This is just one example of how market research can provide dramatic insights that can revolutionize how a telecom creates and markets its services.
Primary Research Methods for Telecoms
When conducting telecom market research, primary information is capable of providing detailed and unique insights about your target market. This is because you will gather and analyze information directly from first-hand sources.
While it can take some time to plan out primary research, you can expect the rich rewards of highly relevant information, which can give your business a competitive edge. The best methods for collecting primary information for telecom market research include:
- Online surveys distributed to existing customers or new target markets.
- Survey Panels to understand how telecom needs have changed since early 2020.
- In-person or phone interviews
- A focus group provides an intimate setting where a small, targeted group of people can openly discuss their current and future telecommunication needs.
- User testing, which is especially useful when considering new entertainment channels or experiences
- Consumer research panels can help evolve products or ideas by facilitating an ongoing dialogue with the same group of people between product iterations.
Secondary Research for Telecoms
Secondary research involves collecting data from existing, published sources. This is a great way to power the initial stages of your market research project. Once it is completed, you can identify the areas that require more specific research and expand upon these through primary research.
The most useful sources of secondary information for telecoms are:
- Telecom market research papers
- Industry reports
- Research agencies that specialize in gathering info for telecoms
- Case studies and white papers
- Statistic sites
- Government sites
- Keyword research and SEO sites
Secondary Research Sources for Telecom Market Research
The following is a compiled list of some of the best sources of secondary information for your telecom market research project. These sources can provide you with a better understanding of the current landscape and how it may evolve in the short and long-term.
- Telecom Global Market Briefing: Covid 19 Impact and Recovery: Published by the Business Research Company, this detailed report contains data about the industry as a whole, size, areas of growth, market segments, competitive landscape, trends, and post-COVID strategies for growth.
- World Telecommunication ICT Indicators Database: Access a massive database of global telecom statistics. The database is compiled and managed by the International Telecommunication Union, a specialized agency that oversees matters related to information and communication technology for the United Nations.
- Statista’s Telecommunication Services - Statistics & Facts: This is a good starting point for exploring a variety of statistics and data about the telecom industry. Some reports and statistics are accessed free of charge. Other reports, such as the reputable Dossier on Telecommunications, requirement payment.
- MarketResearch.com Telecom Market Research Reports: Explore a variety of reports that offer information about the industry as a whole as well as reports with more detailed findings on various sub-sectors.
- Deloitte’s Digital Media Trends Survey Results: This interactive webpage lets you explore findings from Deloitte’s annual digital media survey. Given the dramatic change that occurred in 2020, Deloitte chose to conduct a second survey in order to understand the impact COVID had on our use of telecommunications and consumption of media.
- OECD Telecommunications and Internet Statistics: A subscription to this database has been updated every 2 years since 1980 and provides annual data about various telecommunication modes across the 37 member countries of the Organisation for Economic Co-operation and Development.
Seize Opportunities for Growth with Telecom Market Research

Telecom market research can help you understand exactly what your customers need and how you can reach them in the new reality. With increased demands for services online — from business to entertainment to education — the need for reliable telecom services has never been greater.
Given the increased reliance that the world will have on the telecommunications sector for the foreseeable future, there are plenty of opportunities for existing players and startups alike to expand their reach and claim new market segments.
Now is the perfect opportunity to stake a claim in an ultra-competitive industry or reinforce your position as an industry leader. Market research is the key to understanding where and how to grow in the coming years.
Frequently asked questions
What is telecom market research?
Telecom market research is the process of gathering primary and secondary sources of information specific to the telecom industry.
What are consumer research panels in telecom market research?
A consumer research panel is a group of individuals gathered to provide opinions, insight and feedback on products and services. Basically, it’s a method of primary telecom market research with the panel being the participating audience.
Why should you conduct telecom market research?
Telecom market research is an important step in overcoming the disruption caused by COVID-19 and thriving in 2021, as the pandemic resulted in a heavier reliance on telecommunications. Telecom market research shows how your customers’ needs have changed, exposes their new financial reality and helps you identify new products and services.
How can surveys provide primary research for telecom market research?
Online survey platforms provide an effective means for conducting primary research on the telecom industry. A strong online survey tool provides a suite of capabilities for easy survey creation, deployment and analysis. Telecommunications businesses can thus study their target market with ease.
Where can you find secondary research for the telecom industry?
Here are some secondary resources for the telecom industry: Telecom Global Market Briefing: Covid 19 Impact and Recovery, the World Telecommunication ICT Indicators Database, Statista’s Telecommunication Services – Statistics & Facts, MarketResearch.com’s Telecom Market Research Reports, Deloitte’s Digital Media Trends Survey Results and OECD Telecommunications and Internet Statistics.