Fostering Inclusive Marketing with Surveys
Fostering Inclusive Marketing with Surveys

Inclusive marketing is a critical aspect in marketing, allowing brands to effectively connect and serve diverse communities. Given that a target market is made up of diverse demographics (and psychographics), it is a must for companies to make everyone feel included and valued.
Inclusive marketing works towards achieving this end, along with cutting out cultural biases and stereotypes, so that all groups of people feel seen, heard, and valued by brands.
Creating content, other marketing messaging and campaigns that reflect the diverse communities that companies cater to is a requisite, as 61% of Americans consider diversity in marketing important.
In addition, 38% of customers are more likely to trust businesses that show diversity in their marketing. As such, there is clear evidence that inclusive marketing is appreciated and impactful for companies.
This article delves into inclusive marketing, its importance, current state, and how surveys foster inclusive marketing.
Understanding Inclusive Marketing
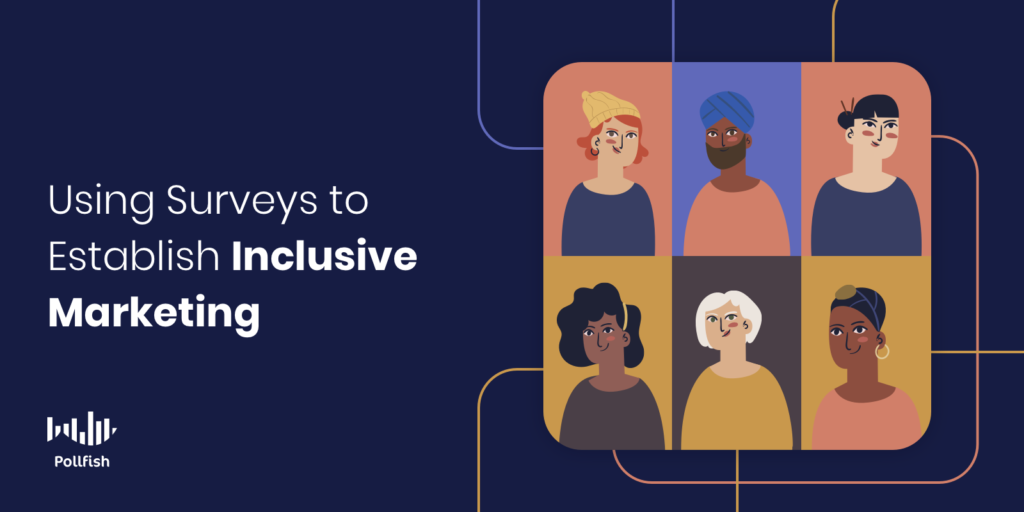
Inclusive marketing refers to the messaging, imagery, processes, and technologies that consider and accommodate all groups of people, allowing them all to fully engage with businesses, in turn. This includes enabling marginalized and underrepresented groups to fully experience and connect with brands.
These marketing campaigns embrace diversity by including people from various backgrounds and the experiences they relate to. In doing so, this involves creating campaigns that break down barriers along with stereotypes.
For marketing to be fully inclusive, it must consider all facets and layers of its target market’s identity. These include ethnicity, gender, age, sexual orientation, culture, language, religion/spirituality, size, physical/mental ability, and socioeconomic status.
It should also account for the fact that one person may be a part of many identities and dimensions. Additionally, brands should acknowledge that nuances are inherent in all of their customer personas, including their personality and preferences.
Aside from marketing campaigns, inclusivity reckons forming all of a brand’s products, services, and experiences in ways that can resonate with a diverse swath of people and make them feel included.
The Importance of Inclusive Marketing

Inclusive marketing is ever-important in an increasingly diverse country and a globalized world. As such, businesses must tailor their marketing and business offerings at large to a wide pool of target market members.
Brands must adhere to inclusive marketing practices, even in niche companies that have very specific target market segments. Doing so will ensure that all of their customers feel recognized and appreciated.
Another critical aspect of inclusive marketing is representation. Marketers must remember that as customers and as people, everyone wants to be represented. When people are not represented in any marketing messages or imagery, they understandably feel left out, as outliers and outsiders looking in, not encouraged to participate with others. In turn, they are being made to feel as the “other.”
Brands should avoid this at all costs. It is difficult enough to entice customers to buy from them; when a brand doesn’t forge inclusive marketing, it adds another layer of difficulty for the business to appeal to its customers. It also makes a business appear negatively in comparison to its more inclusive competitors.
It is not enough to declare acceptance of diversity and inclusivity. Businesses must practice what they preach by enacting inclusive marketing into all of their campaigns.
Inclusive marketing is also important, in that it opens the door to visibly encourage equality in a particular niche or industry. It makes strides towards backing equality, as brands can feature people in non-traditional roles in their marketing deliverables. For example, women in a male-dominated field or hobby.
In this regard, businesses can no longer be passive; they must actively show that they are inclusive to all identities and support participation from all, whether they are a B2B SaaS business or a sports equipment company.
When brands participate in inclusive practices, they satisfy consumer demands and create a vast amount of opportunities with all of their potential customers. Consequently, this will play a major role in building consumer loyalty.
Inclusive Marketing Versus Diversity and Inclusion
While both of these concepts are important for businesses and show appreciation and respect to a diverse group of people, they are not the same. Therefore, they should not be conflated or used interchangeably.
The basis of these two concepts is fairly similar: that of fostering inclusivity among all. However, they refer to different areas of practice and have different end goals.
Diversity and inclusion is a concept that typically refers to developing an inclusive culture within a workspace, whereas inclusive marketing involves stamping out exclusion via marketing efforts.
Diversity and inclusion is predicated on a workplace with a diverse personnel, one in which everyone feels equally involved and supported in all areas of the workplace.
Inclusive marketing, on the other hand, denotes marketing campaigns that take up diversity by including people from various backgrounds and displaying stories that are relatable to unique audiences.
Inclusive marketing efforts should make an effort to break stereotypes and biases, in addition to embracing and reflecting a diverse target audience. This involves becoming better acquainted with different cultures and experiences.
As such, diversity and inclusion practices have the end goal of diversifying a particular operation or institution, while inclusive marketing is inclined at providing representation and appreciation of a diverse marketplace.
Both of these concepts are crucial to a business — but serve different areas. D&L is an HR matter, while inclusive marketing concerns marketing departments, along with advertising, PR, and creative departments, depending on the organizational structure of a business.
How Surveys Create Inclusive Marketing
There are many best practices for inclusive marketing. These practices make up the overall marketing process, embedding into the preliminary stages of a campaign up until the review of a campaign’s performance.
For example, businesses should use inclusive language and avoid resorting to stereotypical assertions or messaging. But more importantly, businesses should address the unique needs, perspectives, and issues across demographics, including people with disabilities and from different lifestyles.
This is where survey research takes center stage. Surveys provide an invaluable method for deploying targeted questionnaires to a wide swath of audiences, extracting customer data in the process. This data represents a diverse range of consumers, allowing brands to tap into the minds of a diverse set of consumers.
As such, surveys solve the major issue of adequately marketing and serving diverse audiences, given that businesses must understand their customers to satisfy them, and diverse audiences have unique needs and interests.
Surveys provide brands with an easy method of reaching their target market and understanding all of its concerns, requirements, desires, aversions, opinions, and more. Surveys are essentially instruments of data for decision-making, which is much-needed across all industries.
Customer data carries massive value, as it drives a variety of business strategies and decisions. Without it, a business would be far less attuned to its customers and not be fully aware of how to serve them, including what to avoid.
Moreover, surveys are the most adept solution for inclusive marketing, as market researchers can set granular conditions in the screening section, dictating precisely who can take the survey.
Researchers can include a wide variety of demographics and psychographics to take the survey, depending on the data filtering capabilities of the survey platform they use. In this way, they will get easy, automated access to the group of respondents that they are seeking to study to then market to and serve.
Surveys allow market researchers to assess the results of each demographic group via post-results filtering in their survey. Thus, they can easily reap and review the data on a diverse set of customers with surveys.
Forging Inclusivity Across Campaigns
Inclusive marketing is no longer a nice-to-have option; it is the future of marketing. More and more brands are incorporating inclusivity into their marketing to avoid seeming non-inclusive, outdated and disrespectful.
Conducting market research is an apt way to become more accustomed with a diverse target market and its closely situated markets. Surveys provide the most potent way of extracting timely customer data, but the success of surveys is largely dependent on their online survey platform.
A strong online survey platform makes it easy and practical to set up screeners, target respondents at granular levels, deploy the surveys to a vast network of high-trafficked websites and apps, offer various post-survey visualizations, and much more.
Therefore, businesses and market researchers should choose their online survey platform wisely; a valuable one will make it easy to foster inclusive marketing, cater to customers and so much more.

How to Execute an Efficient Agile Research Strategy with 4 Steps
How to Execute an Efficient Agile Research Strategy with 4 Steps

Executing an agile research strategy goes far beyond working quickly. Rather, it involves agile software development methods, along with following several best practices. Coupling these key aspects allows businesses to become well-suited to performing agile research.
Becoming a truly agile organization has a powerful impact across departments, even affecting business expenditures. In fact, a Harvard study found that by the end of the agile transition, CEOs spend four times the amount of time on research strategy, at 10% - 40%.
93% of businesses that had fully adopted an agile research strategy before the COVID-19 pandemic outperformed businesses that hadn’t. Clearly, using an agile research strategy is a key component of business operations and success.
This article explains the meaning behind the agile research strategy, its importance, benefits, how to execute it efficiently with four steps, and how surveys are the best bet for software development methods.
Understanding Agile Research Strategy
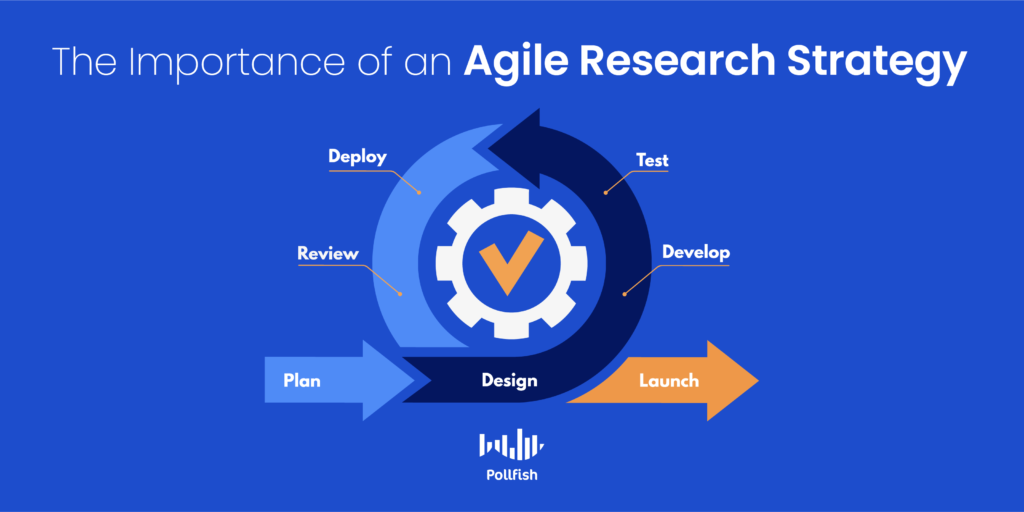
Agile research strategy is a four-step strategy that falls under agile market research, an approach characterized by accelerating market research operations and processes to ensure timely and efficient results.
There are several best practices that make up this strategy. Since it falls under agile market research, these strategies also involve using agile software and development methods that are iterative in nature.
The iterative approach involves taking small steps towards an end goal, where each step informs the next and involves iterating tests, as opposed to the waterfall approach, which involves completing a project in one go.
The agile research strategy builds off of this iterative approach and can be used in the strategic planning process. In order to truly be agile, this strategy requires coupling on-demand technology with a four-step iterative process.
The Importance of the Agile Research Strategy
Having an agile research strategy is important on many fronts. First and foremost, it is one of the major aspects that uphold agile market research, working in tandem with the agile technology that helps bring any research campaign to completion.
Secondly, this kind of strategy allows researchers and their business at large, to work much faster and become more productive. This is because the agile method relies heavily on using AI and automation market research platforms, the kinds that remove manual, repetitive work from the research process.
It’s also because the strategy involves a great deal of planning, testing, and understanding customers and other research subjects down to a T, as the following section explains.
This strategy allows businesses to perfect a variety of business campaigns, and to do so in an informed and data-backed manner. The agile research strategy works to improve everything from branding and brand visibility to concept testing and customer development.
Essentially, this strategy underpins and strengthens all the processes that are involved in various business campaigns — marketing or otherwise. It helps researchers and other team members better work together, as it typically involves collaborations across departments to reach alignment across goals.
In this way, it brings the democratization of data into play, meaning that all team members can work with data, even those who are non-technical. This is because each step in the strategy is methodical and one designed to help teams conduct and use market research better.
4 Tips on Best Practices for Agile Research Strategy
Brands can execute an informed agile research strategy by adhering to four stages, or steps. This section examines each of these four stages individually, what to do in each, and how these steps ensure quality results.
Foundational Learning
The first stage in the four-step strategy, foundational learning is used for building a strong foundation for the rest of the process. Brands build the foundation via compiling the needs of their target market. This includes their demographics, psychographics, desires, and needs.
Businesses must study their customers directly to obtain this data. They can do so by conducting a focus group, survey panel, or consumer survey. Brands must use the proper market research software or technology to be agile, as these methods can be increasingly time-consuming and difficult to perform in traditional ways.
However a business chooses to construct market research, it should ask questions that allow it to engage in foundational learning. As such, they should tap into areas such as demographics, brand awareness, customer behavior, preferences, and much more.
Businesses can get access to these insights with both qualitative and quantitative market research but must rely on an agile market research platform to deliver these insights.
Innovation Pipeline
The innovation pipeline stage deals with business strategy. This stage should apply the information that businesses garnered from the foundational learning step and apply it across various market research and marketing campaigns.
For example, businesses can use the data they reaped from the first step and use it to build customer personas, tweak their marketing messages, tailor products and innovate on product features, along with broadly connecting with their target market by addressing their needs or speaking with them via representatives.
To do so, brands should identify all kinds of customer behaviors to understand category opportunities and their consumers’ unmet needs. They should continue studying their customers' unique needs at a more granular level, such as with follow-up studies.
Product testing is another crucial element in this stage, as it is still early in the process and the most important iterations occur from survey responses on product ideas and sentiment. Doing so allows businesses to go to market with more confidence that their products meet their consumer needs.
Brands should also validate iterations against competitors’ products, as it will give them a competitive advantage.
When a business reaches parity or superiority in its benchmarks, and consumers detect it, the business will be in a sweet spot and can proceed to develop its campaigns.
Campaign Development
This stage involves developing marketing campaigns supported by strategic research in order to form brand equity, foster awareness, and drive demand. It shows that a good product is not enough to succeed.
Much like creating innovative products, businesses should rely on market research in this step, incorporating things like user panels, foundational learning, iterative tactics, alongside qualitative and quantitative research.
After businesses create campaign ideas based on their target market comprehension, they can test new ads with their consumers. The feedback from this activity is used to iterate and conduct tests. This allows businesses to fine-tune their campaigns and their corresponding messaging, and branding. By iterating and testing, brands can understand the effectiveness of their copy, imagery, and more.
Businesses should continue this work until their benchmarks are outperformed and campaigns are ready to go to market.
Shopper/ Tracking Support
While campaign development is a crucial step in the agile research strategy, it is not the final one. This is because markets and consumers are constantly evolving; businesses ought to remain agile and attentive to sustain a competitive advantage.
As such, there is work to be done after products are tested, iterated, and launched along with their marketing campaigns.
In this final stage, brands should evaluate their shopper and customer support experience. This involves studying the in-store experience, customer interactions with personnel, including those that offer support, along with studying retail assets.
This step is partially used to make forecasts on current markets to ensure effective future campaigns. Although it is impossible to precisely predict markets, businesses can still make accurate predictions by following this four-step strategy. But they must carry out these stages using the correct market research software, the kind that provides agile data.
How Surveys Complement Agile Research Strategy

Given that the majority of agile research strategy involves iteration and testing, surveys — particularly online surveys — are crucial and trustworthy tools to use. They enable brands to extract virtually any kind of customer opinion, sentiment, or need.
This is because surveys allow brands to ask any question and deploy the questionnaire to their target audience. Businesses can use surveys for any campaign, from branding and general marketing to product strategy, and customer experience evaluation. Some online survey platforms even allow market researchers to A/B test concepts concurrently with their surveys.
As such, researchers can iterate concepts with surveys on hand. If customers respond negatively or less enthusiastically than expected to on a concept, a business can test another one by simply deploying another survey.
Surveys can also be used to better understand the overall shopping experience, as described in the final step, as brands can deploy surveys that address their own CX. All in all, surveys can be applied to a variety of campaigns, including pre and post-campaign market research, allowing brands to establish an efficient agile research strategy.
Making Headway in Agile Research
Agile market research is no longer a buzzword, despite the fact that not everyone shares the same definition of it and applies it to slightly different areas of research, along with different objectives.
To reiterate, agile market research is the application of agile software methods (think iterative activities with market research practices, such as the agile research strategy. This strategy dictates how to test, iterate, and launch products, concepts, and campaigns more efficiently and quickly via a customer-centric approach.
In order to facilitate a strong agile research strategy, brands must use an agile market research platform. An online survey platform is brands’ and market researchers’ best bet, as it allows for customer targeting, survey creation, deployment, and post-results data filtering.
A strong online survey platform should obtain high-quality data, which can be executed with the RDE (random device engagement) sampling method. This method engages customers in their natural digital environments in a completely randomized way.
Such a platform must also rely on artificial intelligence to perform quality checks that ensure that brands extract only the highest quality of customer data. These checks should disqualify VPN users, gibberish answers, incomplete surveys, and other sources of poor data from appearing in the final survey results.
When a business uses such an online survey platform, it can seamlessly perform an agile research strategy.

How to Uncover and Minimize Business Risks with Surveys
How to Uncover and Minimize Business Risks with Surveys
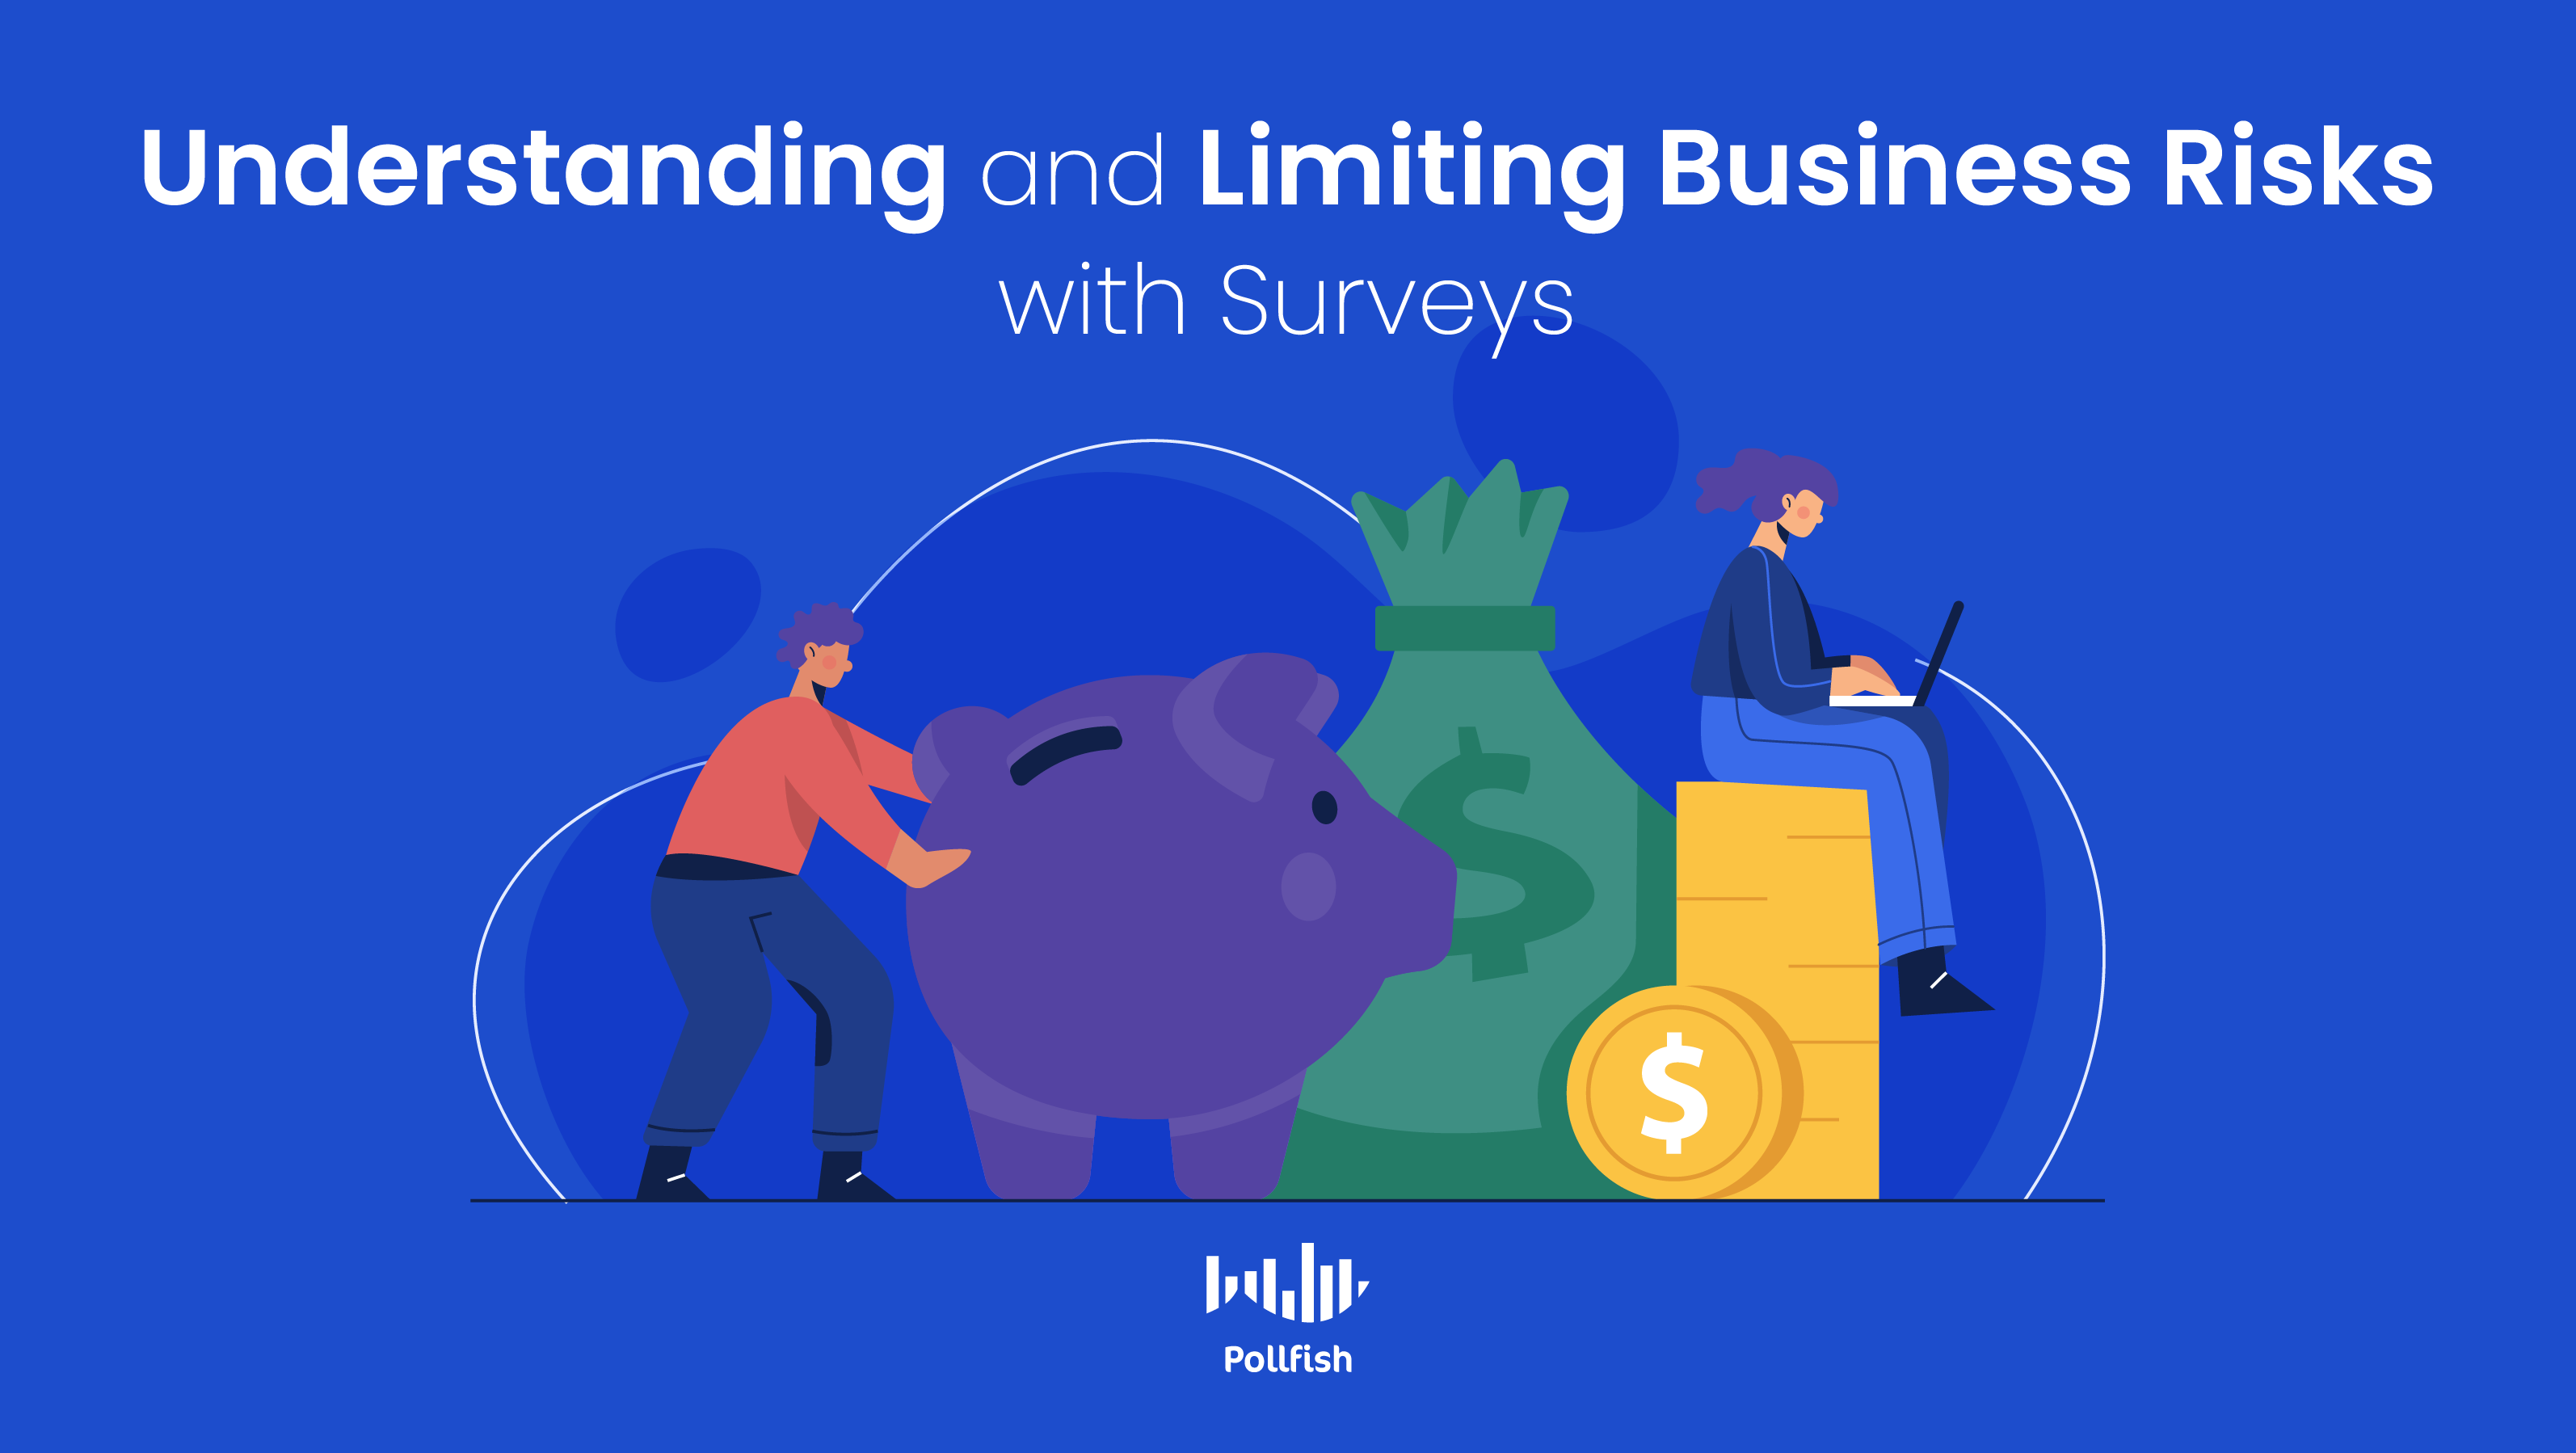
Businesses must work towards uncovering and preventing business risks, as running a business is often a risky operation — especially for fledgling companies. For a fourth of new businesses, failure is imminent, as 20% of businesses fail within the first year.
The leading worldwide business risk is business interruption at 41%, which includes supply chain disruption. The next most common risks for businesses are pandemic outbreaks – 40%,
Cyber incidents – 40% and market developments – 19%.
While it is impossible to be immune to all business risks, a well-prepared business can lessen and even avoid risks in some cases, with the use of data-driven decision making. They can also do this by honing in on their business strategy.
This article explores business risks and how surveys can be used to discover and minimize them early on.
Understanding Business Risks
Business risks refer to any threat a company may experience in its ability to achieve its financial goals. A risk can also mean that a business’s plans may not turn out as they were originally planned or that they do not meet their targets, objectives, or KPIs.
A risk can also include the chance of exposure to any factors that lower a business’s profit and chances of success. These factors can vary, ranging from internal business risk factors, such as technological, human, physical, structural, political, mismanagement, etc.
There are various risks that cannot be blamed on a business itself, which include external factors, such as increased prices of raw materials, a new pool of competitors, and government regulations.
Virtually anything that threatens a company from achieving its financial goals can be considered a business risk. As such, businesses need to be aware of all their possible risks, how to counteract them, and mainly, how to prevent them from causing any impact.
There are also external risk factors that a business can rein in or reduce, such as those present in target market demands, customer behavior, and tastes. To do so, businesses must take part in a strategic planning process and create business safety nets.
The Main Types of Business Risks
While there are various kinds of business risks, businesses can better identify them and remember them by understanding their broader categories. The two main types of business risks are internal and external. In this binary, each category has the power to affect the other.
The following lists the main types of risks businesses can experience, along with their various major subcategories
Internal Business Risks
Internal risks occur from within a company and can result in various setbacks every now and then. These risks can be predicted reliably, as they emerge from a business itself. Businesses have a good chance of reducing these kinds of risks.
Here are several major internal risks that a business can face:
- Human risks:
- Union strikes
- Employee performance, including idle workers
- Ineffective management and/ or leadership
- Poor relationships with external producers or suppliers
- Clients and customers who fail to pay on time
- Physical risks:
- Loss of or damage of company assets
- Loss or damage of office equipment and buildings
- In-office physical risks such as issues (even minor) in building/ wall structure
- Crimes such as theft and vandalism
- Technological risks:
- Product and service changes in the manufacturing, delivery, or distribution
- Outdated operating systems that decrease production or cause disruptions in supplies or inventory.
- A lack of IT staff investing that supports company systems
- Server and software issues leading to equipment downtime
- Production deficits
External Business Risks
These risks often include economic events outside of the business’s structure. External factors can be unexpected and take a turn for the worse, as they involve virtually any undesirable outside force or phenomenon. It can be more difficult to reduce these risks given that they cannot be forecasted effectively.
Identifying Business Risks
Risks are identified in a number of ways. Strategies to identify these risks rely on comprehensively analyzing a company's specific business activities. Most organizations face preventable, strategic, and external threats that can be managed through acceptance, transfer, reduction, or elimination.
The following are several major external risks that a business can face:
- Natural risks:
- Natural disasters that affect business operations such as remaining open.
- Damages to office buildings and merchandise
- Being forced to shut down temporarily or reduce hours of operation
- Political and legislative risks:
- Changes in the political, environmental, or governmental policy
- Changes in import and export laws, taxes, tariffs
- Legal risks
- Regulations that may seem unwarranted or affect a business negatively
- Compliance policies such as data protection and payment processing
- Economic risks:
- Changes in market conditions
- Economic downturns such as recessions
- Increased levels of unemployment
- Entry of new competitors
- Revenue loss
- Changes to customer buying behavior
- Security and fraud risks
- Hacking opportunities across channels
- Data breaches
- Payment fraud
- Reputation risks
- Dissatisfied customers
- Product failures or dissatisfaction with products
- Lawsuits
- Negative press
- Damage to brand equity
How Surveys Uncover and Reduce Business Risks
There are many ways to identify the two major risks within an organization. Given the varying nature of business risks, businesses must implement several strategies to uncover and reduce them, if not completely eradicate them.
These methods include conducting secondary market research to identify industry-specific risks, analyzing customer complaints via a VoC (voice of the customer program), conducting internal and external research, analyzing any suspected risk sources and other means.
Fortunately, surveys provide a direct approach to tackling many of these ways to uncover and reduce risks. This is because surveys can be used to study virtually any topic or concern of interest.
Surveys complement secondary market research, as they provide business-specific information, granting market researchers the opportunity to ask their own questions and to use a precise survey sample based on the required target population.
Surveys allow researchers to gain firsthand insight into their customers. They can dig further into customer complaints, by assessing the number of people within a target market that share the same concerns and may have the same complaints. In this way, they provide qualitative market research in addition to quantitative market research.
While there are many unforeseen changes that can occur, businesses can make them more predictable and therefore, manageable by conducting surveys. This is because businesses can use these tools to gain insight into various markets, including global ones via global market research.
They can assess whether external factors have any bearing on their customers and how to best respond to them. In this way, businesses can both uncover and minimize their risks with surveys. As such, surveys can also be used to compare a business with its competitors, helping to assure that the business doesn't fall behind and risk losing market share.
Implementing surveys is also valuable for branding, as they can be used for brand tracking, helping businesses keep track of their reputation, and warding off reputational risks.
In this way, market researchers can set up such survey campaigns to gain access into the public opinions of their business. They can research how their current branding, advertising, and PR campaigns are faring with their target market. They can also do this with A/B testing.
All in all, although business risks vary in nature and impact on a business, surveys help counter the risks by identifying them and preparing researchers to mitigate them.
Preventing all Undesirable Business Happenings
Businesses must equip themselves with all the necessary tools and strategies to help them identify and reduce business risks. As such, there is no single solution to these risks.
However, surveys provide an excellent source of customer and even competitor information that can inform businesses on their risk factors and overall environment. In order to reap the most benefits out of surveys and effectively reduce risks, businesses must choose the proper online survey platform. Such a platform should make it easy to create and deploy surveys and have the capability to distribute surveys to a massive network while ensuring they are answered by the targeted population.
In addition, a strong survey platform should extract quality data, which is made possible through the RDE (random device engagement) sampling method, which engages respondents in their natural digital habitats in a completely randomized way. It should also rely on artificial intelligence to perform quality checks that ensure the highest quality of customer data.
When a company uses an online survey platform of this caliber, it is setting itself up for success and mitigating its risks.

Diving into the Concept Testing Survey for Marketing and Product Development
Diving into the Concept Testing Survey for Marketing and Product Development

Using a concept testing survey to inform marketing and product development is like giving your target audience a seat at the table.
Concept testing refers to the market research practice you should perform early in the marketing and product development process. It helps you find out how your products will resonate with your customers.
While traditional market research requires respondents to choose from pre-existing criteria, concept testing requires them to provide unique feedback.
With a concept testing survey, your business can assure that it is putting out products that your customers will be fond of. Use this article as a guide to get started.
Defining a Concept Test Survey
 A concept test is a research method wherein your business accrues customer feedback about a new product before it launches.
A concept test survey, as its name implies, is a survey that utilizes a concept test.
Surveys are tools with questionnaires designed to elicit unique responses from your target audience in reference to your business’s new product or product feature idea.
Concept surveys differ from other surveys, in that they help your business to evaluate concepts before they go to market to understand how your customers will react. The concepts include anything that can be tested for marketing purposes, such as an advertisement, a slogan, imagery, emails, a particular service, and more.
Surveys act as a safety net for new products, helping your company predict whether they will succeed or fail.
Why Your Business Needs a Concept Testing Survey
A concept testing survey is important, as it provides insight into how products will be received. With proper concept testing, your business can avoid investing in concepts that won’t succeed (saving you a lot of money). On the flip side, you can increase investment in concepts where testing predicts success.
Basically, a good concept testing survey system can help your business save money and resources, while earning money at the same time.
Concept Testing Survey Methods
The first step to a successful concept test is choosing the right method. Here are the most common methods:
- Single Concept Evaluation (Monadic testing) – a full evaluation is given on one concept. Participants are made aware of features and prompted to discuss whether they approve or disapprove as their survey response.
- Multiple Concept Evaluation (Sequential Monadic) – full evaluations are completed for multiple concepts.
- Concept Selection (Comparative) – Respondents choose their most preferred concept.
- Concept Selection and Evaluation (Comparative Monadic) – Respondents choose their most preferred concept and provide a full evaluation of that concept.
Each product testing method has its advantages and setbacks. As a business, you should choose the one that best fits your specific needs, based on the concepts you want to test and the results you seek.
You should use survey software to ask questions about your products. Survey software is also helpful in pushing your surveys to your target audience.
The survey questions should include the following:
- What do you like most about this product?
- What do you like least about this product?
- How likely is it that you’d buy this product?
You can use more specific questions, just make sure they are relevant to your products for the most useful feedback.
Concept Testing Survey Use Cases
Concept testing can be used at almost every stage of the marketing and product development process. Here are some common use cases:
Logo Testing
A concept testing survey is an asset when conducting branding market research. For example, logo testing is a great way to see how your customers will perceive your business’s new logo.
You can use concept testing surveys to identify what your logo communicates to customers. Ultimately, logo testing is the best way to discover the logo that best embodies your brand.
Website Design
Concept testing surveys also come in handy when you redesign a site or launch a new one. Through concept testing, your brand can see how its design concepts will be perceived by a selection of people who will one day interact with your website. This gives you an inside look at how the sample of your target population thinks, guiding their design decisions for the best possible outcome.
Ads, Landing Pages, and Conversions
Split-testing is a popular way to test headers, images, and other website content to see which resonates most with an audience. Also called A/B testing, split testing is a random experiment where two versions of a piece of content are shown to your target audience. Whether customers see version A or version B occurs completely at random.
Through analytics, this method helps you identify which ad, landing page, or other pieces of content is most compelling for their audience. You can see which customers convert.
Concept testing takes this method to the next level by allowing your business to hear from your audience directly. As such, you won’t simply obtain numbers, as concept testing gives you qualitative feedback about the “why” behind the numbers.
Beyond just validating the numbers, this inside look into the minds of your audience could lead businesses in new directions and even spark new ideas.
Pricing and Upgrades
Concept testing is also a great way to project how upgrading products and services or altering your pricing system will be perceived. The best way to do this is by using migration path tests to gauge your customers’ initial thoughts and see what features and benefits they crave. Migration path tests compare migrated data with original data. Your business can create upgrade tests to predict how the new product will affect your sales.
Name Testing
Deciding on a name can be rather difficult when forming a new company or creating a new product. The impact a name has on overall success can be paralyzing, especially since it’s usually composed of only a few words.
Those few words have to convey what your business offers, its benefits, and how your brand should make customers feel to your audience.
By using concept testing surveys, your business will be able to test potential names and request evaluations on what your customers believe the names convey. This feedback will guide you on the correct track to choosing the perfect name for your business.
Price Testing
Have you ever considered how your customers feel about the value of your products? You can use concept testing to find out whether or not your customers are satisfied. You can also use price testing when you alter the prices of your products. This is an effective way to find out how your customers will receive any new redesigns or product innovations.
Package Testing
Packaging matters more than many a business may think. Do you know what your customers think about your current packaging? Using a concept testing survey for package testing is a strong method to discover if your customers are impressed or irritated by your business’s packaging.
Messaging
When your business is unsure about how its target audience will perceive your messaging, you can apply a concept testing survey to learn more. This shows them if your messaging resonates with your audience. As such, you can gather how it communicates the value of what you offer. You can use the insights from concept testing to create a style guide that informs future messaging.
Product and Concept Development
This might be the most obvious use case of them all. A concept testing survey is an essential part of transferring products and concepts from ideas to reality. Concept testing can reveal missing product features as well as features that offer no benefit and can be removed entirely. Your business can discover what its customers think about your new product’s quality and usability. Overall, product concept and usability tests are the ultimate way to make sure every product your business releases is up to par.
Step Up Your Product Development with Concept Testing Surveys

All businesses should use a concept testing survey at virtually any level of the marketing and product development process. Listening to direct customer feedback gives you an edge over your competition by equipping your business with key information about the specific wants, needs, aversions, and sentiments of your target audience.
Frequently asked questions
What is a concept testing survey?
A concept testing survey is a survey that uses a concept test. The survey asks questions that trigger unique responses from your target audience in response to a new product or concept. Concept testing surveys are unique surveys because they help businesses predict customer reactions before products are released.
Why should market researchers use a concept testing survey?
Market researchers and business owners should use a concept testing survey, as it informs product marketing decisions by predicting which concepts and products will succeed (and which will fail). It’s a way to ensure you’re putting out products your customers will love.
How do you to use split-testing in a concept testing survey?
Split-testing is a common method of testing headers, images and other website content to see what version customers respond to best. It helps brands optimize their website content so that it resonates with their audience. Concept testing surveys that use split testing give similar feedback, but they let you hear from your audience directly.
What are migration path tests used for in concept testing surveys?
Migration path tests compare migrated data with original data to gauge customers’ initial thoughts and to find out what features and benefits they’d like to see. They are useful in concept testing surveys meant to project how pricing changes and product upgrades will be received.
How do you use split-testing in a concept testing survey?
Split-testing is a common method of testing headers, images and other website content to see what version customers respond to best. It helps brands optimize their website content so that it resonates with their audience. Concept testing surveys that use split testing give similar feedback, but they let you hear from your audience directly.

How Relentless Quality in Market Research Perfects the Strategic Planning Process
How Relentless Quality in Market Research Perfects the Strategic Planning Process

Surviving in business depends on a well-established strategic planning process — and not just for new businesses. This ensures that a business establishes its priorities and correctly focuses its efforts and resources in order to obtain them.
Despite the importance of this process, up to 67% of strategic planning fails.
You can build an effective strategic planning process with market research, but you’ll need to use the proper market research tool.
That’s because in the demanding world of business today, market research tools must provide relentless quality in order to sustain a strategic plan.
This article explains the strategic planning process and how a market research platform that provides relentless quality can support this effort.
Understanding the Strategic Planning Process
This process involves all the activities that your business performs as part of strategic planning, the organizational management activity used to identify priorities, set goals, map out a direction, produce strategies, allocate resources, and make decisions to accomplish the goals.
This process plans the fundamental course that your business should take, along with its actions, while layings out what your business seeks to do, who it will serve, and why it will do so. It is built with a focus on the long-term.
In the strategic planning process, your business must cover as many bases surrounding itself as possible, including where it currently stands, where it is going, where it seeks to go, and what it’s striving to achieve. Additionally, the strategic plan must include all the actions required to accomplish its goals based on this evaluation.
The strategic planning process also includes measuring the effect of its activities and whether your business has achieved the kind of results it sought., It is therefore an exhaustive process that involves strategy, exchanging ideas, testing and implementation.
Essentially, the strategic planning process centers on a catalog of steps that managers must follow to form and implement a strategy within a company. This process aligns the entire company around its main goals and how to execute them. As such, it is also meant to create transparency, so that no employees are left wondering about the objectives of a company and how to incorporate them into their daily work.
The Importance of a Well-Executed Strategic Planning Process

It is critical to establish a solid strategic planning process for a number of reasons. Without clearly established goals and plans, your business would be navigating in the completely uncharted and unaided territory.
As for the process itself, your business must understand the steps it will need to take to tackle its goals, especially since many of them are mid-to-long-term goals. The following lists the various benefits of a well-executed strategic planning process:
- It sets a clear set of goals and an honest assessment of an organization’s strengths and weaknesses.
- It reveals what is most important, relevant, and actionable in business, removing the guesswork.
- It offers plans on how to achieve its goals, with different ideas that businesses can smartly put to the test.
- It helps companies understand how they can improve their performance.
- It shows businesses where their biggest challenges lie, whether it is in your business itself or external factors (laws, changing trends, customer behaviors, etc).
- It prevents businesses from performing tasks that will yield little to no growth or benefits.
- It enables businesses to respond to a change or an issue with preparation, lowering stress and the difficulty of handling the unknown.
- It fosters and upgrades the technical abilities of your workforce or product.
- It aligns employees and shareholders with business objectives and visions.
- It determines KPIs so that businesses can track progress based on data.
When to Use the Strategic Planning Process
Strategic planning is an ongoing activity, therefore its process should not be applied just once. Although mainly used by new companies and startups, strategic planning should be involved at various stages, especially those that are bent on making change.
As for scheduling the process, this will vary based on the needs and experiences of your business and its external settings, such as its niche, target market, or competitors.
The strategic planning process should be regularly carried out in a business that operates in a frequently changing industry, such as the SaaS industry, for example. In this case, this kind of process should take place 1-2 times a year.
If your business has existed for a long time and is in a slow-moving market, it can carry out a lesser frequency of one strategic planning process a year. This should involve updating in which only certain parts of the process.
Aside from new businesses, all businesses should perform strategic planning when taking on any new venture, whether it is an acquisition, a new department, product, or branding change.
Businesses that are in an unstable or semi-stable marketplace should conduct the strategic planning process at least once a year in preparation for the coming fiscal year. By doing so, they can identify the organizational goals to accomplish in the coming fiscal year, along with finding the resources to obtain the goals.
In this way, this process is a must for budget planning. However, businesses will not need to complete every step of the process each year, as the full strategic planning process should be conducted at least once every three years. As mentioned previously, it should be conducted every year when businesses or their external environments undergo a massive change.
Although longtime businesses in stable marketplaces don’t need to conduct this process yearly, they must review it once a year to determine any new action items and to determine whether anything should be removed.
How Market Research Supports the Strategic Planning Process
Market research is invaluable to the strategic planning process, as it provides a stable foundation for virtually every step of the process.
This form of research provides insights on your business’s target market and industry at large, the kind of crucial data that supports a vast array of decision-making.
That is because creating objectives and planning activities around them based on intuition is dangerous and costly. Unfortunately, many businesses do not pay enough attention to their market research data, or any sort of data, as over half of the data businesses obtain goes unused.
This is a major misstep as market research offers relevant information on the heart of your business: its consumer base. A strong market research tool can help your business reap the most updated data on its target market, along with specific market segments.
In this way, using a primary source of research is superior to conducting secondary research alone, as secondary research may not be fully updated, relevant to your business’s specific needs, or involve using questions that a particular business needs to address.
Market research provides the key insights that a strategic planning process needs, as it sets concrete objectives and lays out concrete processes, all of which require time and resources. By gathering and analyzing market research, your business can gain a competitive advantage, one that yields 10 percent in sales growth and higher margins.
A market research survey in particular is a potent way of extracting the kinds of insights that set a strategic planning process in motion. Surveys are versatile and can take various forms, from customer satisfaction surveys like the NPS to employee feedback surveys, to B2B surveys, and many more.
They are devised to help your business understand a number of issues, such as product satisfaction, product needs, opinions, aversions, user experience, and much more. You can create them with any sort of questions, depending on the market research platform they use.
In order to create a strong strategic planning process, businesses should turn to a market research tool that offers relentless quality.
How a Platform Offering Relentless Quality Perfects the Strategic Planning Process

Obtaining a market research platform that is built on relentless quality is difficult to come by. While this may be a tall order, given that there are so many tools marketed in this way(but not verbatim), only a few deliver on this promise.
The Pollfish market research tool, on the other hand, delivers relentless quality, the kind designed to provide a 360-degree assessment of all the factors involved in a strategic planning process.
Whether your business needs to determine its specific market segments through market segmentation or weed out survey fraud and faulty responses with artificial intelligence, Pollfish offers both and much more.
It also uses a viable sampling method to gain timely responses in a randomized way to limit survey bias. This method is known as random device engagement (RDE) and it is extremely effective at gaining responses from a target market the natural way, by deploying surveys across a vast network of digital properties that users visit voluntarily, meaning that they are not forced to take a survey or are pre-recruited.
It helps your business gain intelligence at virtually every aspect of the business relating to its customers and employees, which helps hammer out reasonable objectives and a market research budget for a strategic planning process.
Additionally, businesses can use the Pollfish platform for the following aspects of their strategic planning process:
- Finding funding priorities
- Gauging customer-service satisfaction
- Discovering new customer needs that can help set off new product launches
- Identifying the backbone of strategic goals
- Discovering whether a business needs to change its branding direction
The Pollfish platform allows businesses to gain access to all of these factors and more in a friction-free way, as the platform is user-friendly; there are only three main steps to make your own survey.
The platform uses quality checks to remove any below-par data, such as repetitive answers (flatlining), gibberish answers, VPN use, and more. It does so through a machine learning system that cancels out the need for manual quality checks.
It also offers 24-hour support from a dedicated team of market researcher experts. As such it is possible to perfect a strategic planning process, as long as it is done with the proper market research tool. Because the Pollfish online survey platform offers proven relentless quality, your business should look no further and use Pollfish for all their strategic planning needs.

Diving into the Diversity and Inclusion Survey
Diving into the Diversity and Inclusion Survey

Businesses conduct diversity and inclusion surveys to improve their work culture and the overall employee experience. They do this by gauging their staff’s perspectives and making possible improvements to the general company culture and structure.
According to McKinsey, organizations within the top diversity quartile have 21% sound financial performance than organizations in the bottom quartile. Diversity also correlates with higher innovation rates.
A practical starting point to foster an inclusive and diverse environment within a workplace relies on conducting an organization-wide diversity and inclusion survey to gather the employees’ feedback on this matter.
By garnering and analyzing this data, you can better comprehend the current organization status and create a clear path to cultivating D&I.
This article expounds on the key characteristics of diversity and inclusion surveys, their importance, and how to carry out one effectively.
Defining the Diversity and Inclusion Survey
The diversity and inclusion survey is a kind of employee feedback survey, part of the Voice of Employee (VoE) studies that assess employee groups and their experiences in their company. These surveys measure diversity, inclusion, and fairness at your workplace.
With diversity and inclusion surveys, you can ensure that all people are treated justly and equally, regardless of their gender, age, sexual orientation, race, ethnicity, disability, religion, or other factors.
Ultimately, this helps build an inclusive culture that drives organizational effectiveness. Essentially, diversity and inclusion surveys enable you to:
- Identify specific groups who aren’t getting the same experience as others
- Take appropriate initiatives to promote inclusion and diversity
- Review procedures and policies and set relevant groups as appropriate
- Recognize if the bias is unconscious
All in all, diversity and inclusion surveys help you to track your company’s progress towards creating an environment where people are accepted for their beliefs and respected for their values. For example, if your survey shows that workplace sentiments have increased, that means positive progress has been made towards diversity and inclusivity at work.
The Key Characteristics of the Diversity and Inclusion Survey
These surveys give companies an anonymous and accurate depiction of how fair and inclusive that employees feel about their organization’s culture and employee relations.
Diversity and Inclusion is a sensitive topic that employees feel strongly about. For starters, your diversity and inclusion survey should include actionable, straightforward questions that help you gauge how different groups find your workplace culture and emphasize areas for improvement.
Some of the key characteristics of a diversity and inclusion survey include:
- A clear objective for the survey
- 3-6 questions in length
- Periodic check-ins on the same audience
- Use of simple language
- Use close-ended or multiple-choice questions
The Importance of a Diversity and Inclusion Survey
It is implausible to address the problems of communication gaps and cultural misunderstandings if companies don't know they exist within the organization. While inclusion, equity, and diversity are not always visible and tangible aspects, surveys provide a viable solution to quantify and measure these immaterial concepts at the workplace.
Most companies are paving the way to cultivating an inclusive environment at the workplace. The diversity and inclusion survey initiatives are more crucial than ever to address disparity issues in the workplace. According to McKinsey's research, the lack of diversity could have significant financial consequences.
Companies can achieve 50% higher profits and share performance if women employees are represented better at the company. Similarly, senior-level female employees have a more meaningful impact on the company’s culture. They are more likely to welcome employee-friendly policies and fight for gender and racial disparity.
Additionally, 61% of the workforce consider inclusion and diversity necessary at the workplace. This further heightens the need to conduct a diversity and inclusion survey to ensure a healthy workplace.
Diversity and inclusion are intertwined, and a survey to assess it helps you cultivate employee engagement, empower innovation, and reduce attrition. Because if you aim to promote and support inclusion and diversity, it is imperative to track them.
Furthermore, it also helps you build a great company culture that nurtures diversity and inclusion with similar deliberation as other organizational priorities.
Who are those people that contribute to your organization? Do they feel safe and supported? Do their answers change based on who is asking? Surveys allow you to turn inclusion and diversity and inclusion from principles into action.
Here is why running a diversity and inclusion survey is essential.
- You get to listen to the experiences of people and whether it varies for different groups
- Identify groups/individuals who feel less included. And if that’s the case, then why
- Comprehend how well you can implement your initiatives
- Measure your results against the set benchmarks
- Attain compelling evidence to propel change
The Advantages and Disadvantages of a Diversity and Inclusion Survey
The following are some of the advantages and disadvantages of diversity and inclusion surveys.
The Advantages
- Diverse management increases revenue by 19%.
- Diversity and inclusion surveys create a safe avenue and space for employees to share their feedback about the company culture, encouraging employees to perform better
- More opportunities for a forward-thinking and innovative culture
- Companies enjoy 41% higher revenue when they conduct diversity and inclusion surveys and make improvements to the culture
- Organizations that promote diversity and inclusion surveys are more creative, engaged, and successful
The Disadvantages
- The survey takes some time to implement
- Conducting the survey is not enough; companies need to take the employees’ feedback as well
- Some questions might paint a negative picture even if the sentiments behind them are not bad
- Creating and analyzing surveys takes time and money
- Incorrect interpretations of results
How to Conduct a Diversity and Inclusion Survey
Conducting a diversity and inclusion survey may reveal challenges that alert businesses of any discrimination beforehand, helping companies take appropriate action and set policies, as needed, to address concerns and issues identified in the survey results.
However, to do so, it is essential to conduct D&I surveys in a proper way to get accurate results.
Here is how you can conduct a diversity and inclusion survey effectively.
Step 1. Understand the Scope and Purpose of the Study
Before you begin to structure your survey, you need to have a straightforward research question to define what answers you’re looking for and what goals you expect to achieve. Then, based on your main question, you’ll be better able to determine who you need to target in the survey.
Do you want to see if your policies and set standards are adequate, or are you trying to figure out diversity and inclusion-related prominent issues?
Understanding the scope and purpose of your survey improves the quality of deductions. Make a list of the issues and questions in your research and prioritize it.
Step 2. Involve the Relevant Team
Once you fully understand the scope and purpose of your surveys, it is essential to communicate and create a team that recognizes its importance to ensure they prioritize it.
Give your team a presentation to describe the importance and meanings of inclusion and diversity. Ensure that there is room for discussion, concerns, and questions. Make them feel heard, involved, and valued in the process.
Step 3. Set Up a Diversity & Inclusion Taskforce
It is imperative to set up a small diversity and inclusion task force for your surveys — a group of employees that come together routinely to talk about the latest developments as in what is working and what is not going well.
Step 4. Deploy the Surveys
Before sending out and distributing surveys, create a clear roadmap for when, where, and with whom you’ll conduct the study. Determine the number of responses you'll need beforehand, as part of your survey response rate and how you’ll access and analyze the sample population.
When you create a robust research plan to get answers to your research questions, you will be satisfied
and confident about sending out the survey according to your preferred method of choice – online, in-person, or by mail.
Step 5. Measure the Results
No matter which method you choose to analyze your diversity and inclusion survey results, it is vital to process the information accurately. You can do this by leveraging software that helps you sort the responses according to specific requirements.
You should refine the information by eliminating all the incorrect and incomplete responses. For instance, if you ask open-ended questions, it is essential to interpret the reactions by allotting labels to each respondent’s answers and structuring them into themes or categories.
You can also leverage some qualitative methods and approaches, like thematic analysis, more suitable to analyze interviews. Typically, you can conduct statistical analysis leveraging programs such as SPSS. The same set of survey data can be subject to many pieces of research.
Diversity and Inclusion Survey Questions – Tips and Examples

To get the most out of your diversity and inclusion survey, you must ask the right questions from the right audience. Give you people the opportunity to share their observations and experiences with a combination of questions leveraging the Likert scale to measure opinion and satisfaction and opinion.
Using the following questions for understanding employees' standpoint on fairness, respect, equity, diversity, and inclusion can help you gauge employee engagement and satisfaction.
- Does everybody have an equal opportunity to succeed in this company?
- Does the company leadership support the value of inclusion and diversity?
- Do all the employees in the company receive fair treatment?
- Does the company have a supportive environment for open and free expression of opinion, ideas, and beliefs?
- Do you feel empowered to make work-related decisions?
- Do you relate to any leaders in the organization?
- Does the senior leadership team reflect a diverse organizational outlook?
- Does your manager encourage all the employees to share different ideas, speak up, and be vocal about diversity and inclusion issues?
- Does your company value diverse ideas and opinions?
- Does your firm give raises, appraisals, and promotions equally and fairly to all employees?
- How can we ensure all the team members feel valued and heard?
- How can you improve inclusion and diversity in the company?
Measuring Diversity and Inclusion Using Survey Data
For some companies, mounting diverse and inclusive initiatives may seem like a multi-faceted endeavor. However, it is vital to pay attention to this aspect to ensure a healthy and motivating workplace for all employees alike.
Diversion and inclusion surveys are paramount to a company’s overall strategy. It helps reveal representation and unfairness gaps within your organization.
Tailored surveys help organizations effectively reach their diversity and inclusion goals by garnering employee feedback and benchmarking the current status.
Tailored employee feedback surveys help organizations effectively reach their diversity and inclusion goals. Most importantly, they enable you to take a more meaningful approach to cultivate a more diversified culture.
Along with this, you can conduct employee recognition surveys that boost employee morale, in turn, helping you scale your business.
With the help of a professional survey platform, it becomes easier to distribute the surveys to your employees. Moreover, by using an inclusive design for such research purposes, you can make your employees feel visible. Launch your survey today!

How to Conduct a Market Trend Analysis for Sublime Market Research
How to Conduct a Market Trend Analysis for Sublime Market Research
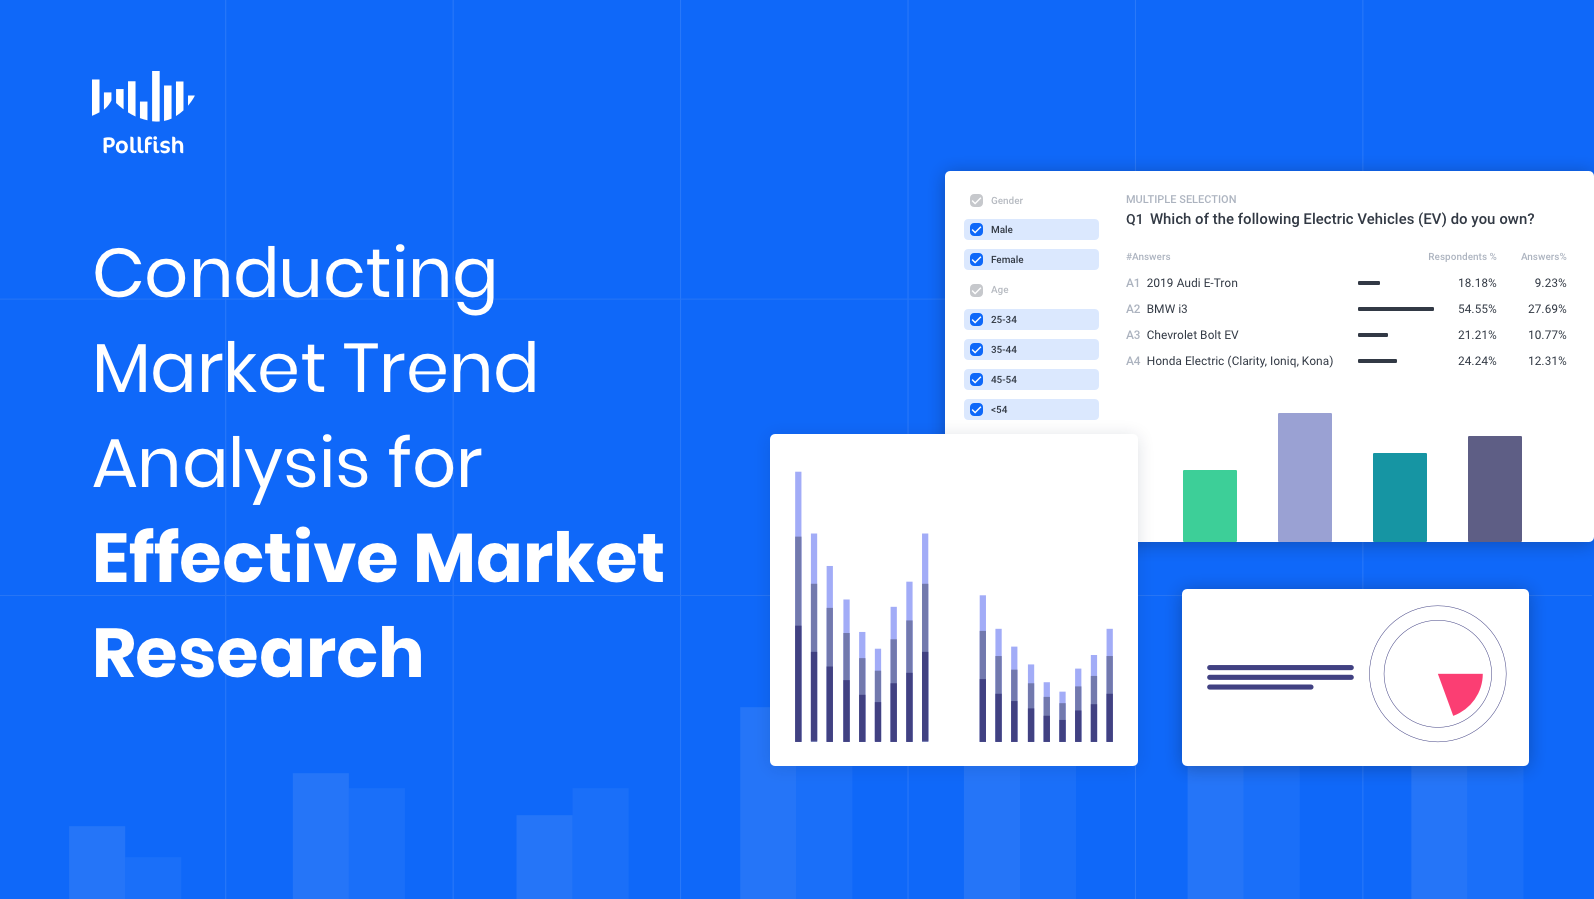
Conducting a market trend analysis is critical for a market research campaign, as it uncovers trends in both an industry and within a target market — the group of customers most likely to purchase from a company.
Market trend analysis is valuable for data-driven decision-making, as it consolidates trends extracted from data and puts them and their key aspects, such as customer behavior, for example, into perspective. In turn, this helps businesses recognize patterns and make predictions on various strategies and campaigns, along with discovering future trends.
Additionally, although trend analysis is chiefly used in the financial sector, its concept is also essential to market research, as it is used to make sense of survey data analysis, allowing researchers to understand their findings, thereby improving the market research process.
This article explores market trend analysis, why businesses must conduct it, how to conduct it for efficient market research and more.
Understanding Market Trend Analysis
A market trend analysis is a kind of trend analysis, except rather than focusing on the financial aspects of a sector or business, it refers to analyzing trends in a market or industry at large.
Specifically, a market trend analysis is a method of analysis on past and current market behavior, along with dominant patterns of the market and its consumers. This kind of analysis relies on examining statistical data and recorded market behavior over a defined period of time.
This kind of analysis covers a wide range of topics, as trends can appear within different aspects of a market.
Businesses, therefore, use this kind of analysis to extract necessary information in order to map out and support the strategic planning process and forecast future trends within customers, campaigns and other business plans.
Identifying the prominent traits of an industry and its target market, this kind of analysis acquaints businesses with key occurrences in the market, thus it is a vital practice in market research.
The Importance of Market Trend Analysis

Market trend analysis carries significant weight in market research, for a number of reasons, including the ones aforementioned.
First off, one of the greatest concerns in a business and virtually any entity is that of performance. A market trend analysis grants insights on performance, identifying areas of sufficient business performance, along with those that aren’t faring well.
Thus, it helps businesses on the decision-making front, providing insights that boost long-term strategy and helping businesses avoid future setbacks.
Given that in market research, trend analysis is used to better understand consumers, this kind of analysis provides insights into customer behavior trends, allowing businesses to cater to customers with data backing all of their decisions. This way, customers are more likely to engage with brand campaigns and make purchases.
Moreover, market trend analysis can obtain valuable insights into the overall scenario of a market. For example, a SaaS company can discover the products, services and startups within a particular niche of their industry.
Alternatively, a shoe brand can discover the latest trends in shoe designs and fashions by running various market research campaigns that capture customer sentiment, opinions, preferences and recognition of shoe brands and styles.
Market trend analysis also helps businesses gain an understanding of their market’s macro-environment, the holistic condition existing in an economy, rather than a specific sector of it.
Conducting trend analysis helps businesses find and display long-term data in summary form. The data can be used to investigate changes across different points in time and find how both customers and markets respond to them.
These variations can involve changes in demand levels in the market, allowing businesses to take appropriate action, as periods of high demand and low demand require different strategies.
What Businesses Can Learn with Trend Analysis
Businesses can gain the various insights laid out above. In terms of market research, these insights provide information about three key aspects: customer preferences, the macroeconomic environment (market’s economy at large) and changes in the industry.
With the trend analysis report, you can compare historical data and get answers to questions like:
In market trend analysis report, businesses can understand the following:
- Changes in their NPS score over a period of time
- Levels of employee engagement and turnover
- Sales fluctuations and forecasts
- Change in customer experience in the past year
There are various other market aspects that businesses can examine with this kind of analysis. In addition, businesses can plan their actions in response to long-time or emerging trends and any changes in their market. As such, trend analysis prepares businesses for the long term.
The Different Types of Market Trend Analyses

There are four main types of market trend analyses that businesses and market researchers should acquaint themselves with. The following explains the four kinds, so that businesses can aptly conduct a market trend analysis and analyze it based on the categories.
- Consumer Trend Analysis:
- This focuses on trends among a target market, its segments and customer personas.
- It involves gathering key customer data such as customer satisfaction, customer aversions, needs, opinions, preferences, customer buying behavior and more.
- This involves studying product trends in relation to customers' reception and opinions of them.
- Historical Trends Analysis:
- This is an investigation into past industry trends in a market or niche.
- It shows researchers how such trends developed, how they affect the present and how they will affect the future.
- Historical trends concern historical data, which can date back years, along with data from the near past, such as the past few days, weeks and months.
- In this kind of trend analysis, there is typically a comparison between the current market with others, such as year-by-year or period-by-period analysis.
- Seasonal and Temporal Trend Analysis:
- This is an analysis of market shifts relating to seasonal events, such as holidays, the weather, natural disasters, etc.
- Many of these are recurrent, such as the holiday season, which starts around late November and lasts through most of December. For businesses, strategizing for this season occurs many months in advance, thus the data they use tends to be historical trends analysis.
- Geographic Analysis:
- This entails studying trend changes based on geographic location.
- These analyses can include comparisons between different regional areas within a country, or on an international basis, studying trends from different countries and even continents.
- It involves conducting global market research, should the trend analysis delve into international markets.
- This analysis seeks to discover how trends develop in geographies of various sizes and places.
How to Conduct Market Trend Analysis to Excel in Market Research
There are various means to run such an analysis and businesses can complete this with a process for collecting, comparing and analyzing data.
The following explains how to conduct market trend analysis in a step-by-step process.
- Determine the trends you seek to study for your trend analysis. To do so, refer to the above section on the major different kinds of market trend analyses. You can also perform a social media and desktop versus mobile analysis, should your business require it.
- Create a focus on your trend analysis within the main topic you chose. For example, if you choose to analyze consumer trends, consider the major aspects of consumers that you ought to focus on for your study. This will differ from business to business.
- For example, you can study their reactions to your ads and marketing messages, their purchasing behaviors, their preferences, etc.
- Pinpoint your target population of study. You can also begin broadly, by targeting the entirety of your target market.
- Conduct secondary research in regards to your target market and the focus of the study.
- There are various online sources to consult, such as trade publications, news sites, sites dedicated to your niche, statistics websites, etc.
- Stay up to date with industry research and trends reports. There are various online sources offering these reports, such as IBISWorld.
- Study your competition. Observing your competitors gives you a good picture of their market positioning and how they react to an emerging trend.
- Conduct primary research around the focus of your trend analysis. There are various methods and digital tools that can be used to extract primary data. Survey research is among the strongest, as it powers its users to inquire into any topic, form and ask any question, along with distributing the survey to its intended audience.
- Find the correct online survey platform to conduct your primary trend analysis research. A strong tool is user-friendly, offers deployment on a vast network of popular websites and apps, offers global support, uses random device engagement (RDE) sampling and more.
- Analyze all of your findings by studying both primary and secondary resources. Specifically, look for patterns and repeated actions, opinions, etc.
- Based on your analysis, identify all possible trends, both minor and major. Create a document based on these findings.
- Put your analysis into action. If you are able to successfully discover trends, create a plan of action based on them. Your plan of action can include new campaigns or changes to current campaigns, changes to your strategy or changes to how you engage your topic of study, in this case, the customers.
- You ought to conduct more survey research should your analysis appear to be lacking, if it leads to further questions or if you simply need to understand your trends at a more granular level.
Powering Each Market Research and Trends Project
Conducting a market trend analysis is a crucial factor in maintaining strong market research campaigns. Aside from uncovering trends among customers, market segments and the market at large, this kind of analysis complements any market research endeavor, with key, organized data.
While there are various means of performing market trend analysis, survey research helps carry this kind of analysis, as it empowers researchers to inquire into virtually every business subject, from purchases, to buying habits, to brand recognition and much more.
As such, the proper online survey platform will unlock various trends, but businesses must choose one wisely, as they are not all built the same. A strong online survey platform will enable businesses to deploy a massive volume of surveys across a multitude of digital websites and apps, hyper-target customers and take a few days at most to complete.
The Pollfish online survey platform offers all of these capabilities, including an RDE (random device engagement) method to draw responses from digital users voluntarily, bias-free and in their natural environments.

Performing a Customer Behavior Analysis for a Deep Read
Performing a Customer Behavior Analysis for a Deep Read

In order to access customers, businesses must conduct a customer behavior analysis. Given that customers are the lifeblood of any business, it is critical to analyze their behavior, as doing so will support any business strategy.
A customer behavior analysis is a kind of analysis that provides a granular evaluation of customer behavior. Specifically, it examines customer behavior in relation to a particular business.
It is especially important to run this analysis, given that customer expectations and needs constantly shift; nevertheless, 76% of customers expect companies to understand their needs. When businesses understand customer behavior, they have a context to their customers’ needs, making them more practical to fulfill.
This article explores customer behavior analysis, its importance, how to conduct it and how the role of survey research in conducting this analysis.
Understanding Customer Behavior Analysis
A customer behavior analysis is a kind of analysis that melds qualitative and quantitative observations of how customers interact with a particular company. It involves studying how customers interact in-store, on a website, social media, apps and other places, both physical and digital.
This analysis examines what influences their customer buying behavior, which includes studying the triggers, motivations and reasons behind their buying choices.
In this behavior analysis, customers are first segmented into customer personas based on their shared characteristics. Then, researchers observe each segment throughout the different stages of their customer journey map. This stage serves as the heart of the analysis, as it requires scrutinizing how the personas interact with a company.
This analysis grants insight into the various variables that may influence a customer segment and customer persona. It allows businesses to understand how customers feel about a company, thus it is a crucial component of brand tracking.
The Importance of Customer Behavior Analysis
It is important to conduct customer behavior analysis for a number of reasons.
A behavior analysis is a proven method for understanding customers and connecting them to the business. It allows businesses to understand their customers’ priorities, motives and rationalizations behind their decisions.
Given that customers exhibit these thoughts and actions as part of the customer journey, conducting this kind of analysis helps businesses understand how customers feel about their company.
Additionally, a customer behavior analysis allows companies to understand customer habits and motivations. This includes how customers behave in different settings, whether it is digitally or physically.
Without it, market researchers and online store web developers would only have a scant idea of how their customers shop, whether it is on or offline. Conducting it can reveal these multi-environmental habits, also revealing unique or latent patterns.
Businesses can also offer a better shopping experience by nailing down where and how customers face issues. These can involve non-virtual problems, such as poor customer support, along with technical problems, such as slow web pages and functionality problems.
When it comes to the latter, a poor check-out experience may lead customers to abandon their carts prior to purchasing. Additionally, an improper search may deter shoppers from finding their products. These instances lead to site leaves and lack of conversions, therefore casting a blow to revenue. Businesses can avoid these issues and missed opportunities by performing a customer behavior analysis.
Furthermore, businesses can improve their existing marketing campaigns and form new ones from analyzing customer behavior. This will improve both customer retention and acquisition, as brands can tweak campaigns based on studying existing target market members, therefore creating more fitting campaigns for future potential customers.
This analysis reveals recurring patterns on shopping transaction timing, location of purchase, device used for purchases, frequency of buying, favorite products and other behavioral aspects. As such, marketers can better understand customers’ actions and use this information to target their audience more precisely.
Moreover, marketers can use this data to optimize various customer experiences, create more personalized content from the intelligence they gained, create more enticing advertising campaigns and determine the value of different customer segments and personas.
All in all, customer behavior analysis offers a myriad of benefits that can help solve various business needs.
The Use of Surveys in Customer Behavior Analysis
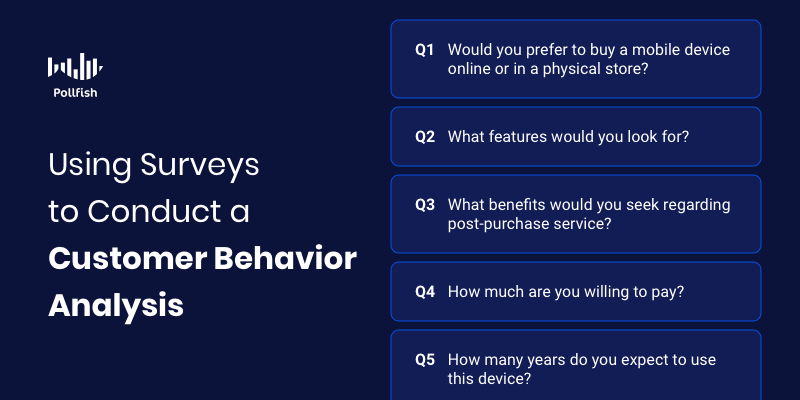
Given the scope of customer behavior, there are various methods and tools to analyze it, from one-on-one calls with customers, to in-store experiences, to digital tools such as experience analytics.
Online surveys are the most potent tool for studying customer behavior, as they allow businesses to study virtually any aspect of customer behavior and ask all of their desired questions.
Surveys offer value in various aspects of performing a customer behavior analysis, such as segmenting customers via market segmentation. This allows businesses to understand the key groups making up their target market and how to serve them more effectively. Additionally, as aforementioned, surveys help businesses form their customer personas, another key practice for targeting an audience.
Surveys allow market researchers to inquire into any customer behavior topic. This way, researchers can detect the presence of certain common behaviors, along with patterns in preferences, actions and inclinations, all of which are crucial factors in a behavioral analysis.
Surveys can provide both qualitative and quantitative market research data for researchers, granting them a holistic view of customer behavior. Thus, surveys do not merely provide a means of analysis but are complementary to various market research campaigns.
A strong survey platform makes it possible and practical to study a vast pool of customer behavior via deployment across thousands of high-traffic websites and apps. Additionally, a platform that offers filtering data for survey results makes it easy to perform an analysis of all the collected data.
How to Conduct a Customer Behavior Analysis
There are several ways to perform such an analysis, including through the use of surveys. The following explains how to conduct a customer behavior analysis through a multi-step approach:
- Segment your target audience. This involves dividing your customers into various groups, or segments, based on shared demographic and psychographic characteristics.
- There is also a wide range of other characteristics to use for segmenting, involving behavioral characteristics such as:
- Web and app activity, preferred media channels and online and offline shopping habits.
- Consider the most valuable segments to your business. You can find them when you calculate customers’ CLV or customer lifetime value, or by performing an RFM analysis.
- There is also a wide range of other characteristics to use for segmenting, involving behavioral characteristics such as:
- Pinpoint the benefits of each segment. Each customer group and persona will choose a particular business in their own unique way. Market researchers should identify what triggers these segments to choose a particular company over another.
- Refer to products, services and experiences, along with external factors that influence buying decisions.
- Consider the different effects on purchasing, such as: did customers buy a product due to its brand? Did they make a convenience purchase? How much did the customer seek to spend? How urgent was their purchase decision?
- Always consider the context of a customer’s behavior and needs during the analysis.
- Conduct survey research. This involves using both the qualitative survey and quantitative survey for a holistic read of your customers' behaviors.
- Additionally, it is critical to perform secondary market research, using external sources of already published data. While this provides useful information, not all or any secondary resource will provide relevant information to your niche and specifically, your customer base.
- After you conduct qualitative and quantitative research, compare the two sets against each other as you discover patterns, habits and other key components of customer behavior.
- Use your analysis findings on a campaign. You can apply your analysis to various campaigns, from content optimization to advertising.
- Use the best delivery channel for each persona.
- Provide personalization to different segments and personas whenever possible.
- Fix any hindrances in the CX (customer experience).
- Nurture the customers throughout their CX.
- Assure any changes won’t adversely affect your customers, as not all will be receptive to change. Conducting surveys can help you determine which customers are less fond of it.
- Analyze the results of any changes you’ve applied to your campaigns. Marketers should always test their results and the same applies to changes made after running a customer behavior analysis.
- Test the effects of your changes with different metrics such as traffic to websites. Advertising spend versus revenue, conversion rates, CLV, customer acquisition cost (CAC) and more.
- Analyzing results ought to be a continual process, giving the vast external influences on customers, such as politics, technology, new products in a niche, etc.
Staying Attuned to Customers
Performing a customer behavior analysis is a crucial task in obtaining a deep understanding of how customers behave in relation to your offerings, experiences and business as a whole. Such an analysis should therefore be ongoing, as even the most loyal customers change from various influences.
Surveys provide a powerful yet practical means for performing a behavioral analysis, given that they can be deployed to the masses, are highly targeted and allow market researchers to delve into any behavioral topic through questions of their choice.
The key is to use an online survey platform that offers these capabilities and more.
Although conducting such an analysis is likely to require several tools and methods, surveys allow researchers to capture insights into all customer behaviors, along with their needs and opinions, as surveys allow researchers to explore any topic and ask about it explicitly and in a custom way.
A strong online survey platform offers capabilities that put survey bias, survey fraud and other low-quality data at bay. Such a platform makes it easy to study customer behavior by extracting data based on precise demographics and psychographics, adding randomization to the sampling process via RDE (random device engagement) and offering several data visualization formats.
Businesses should therefore choose their online survey platform wisely.

How to Find and Obtain a Survey Sample for Accurate Market Research
How to Find and Obtain a Survey Sample for Accurate Market Research
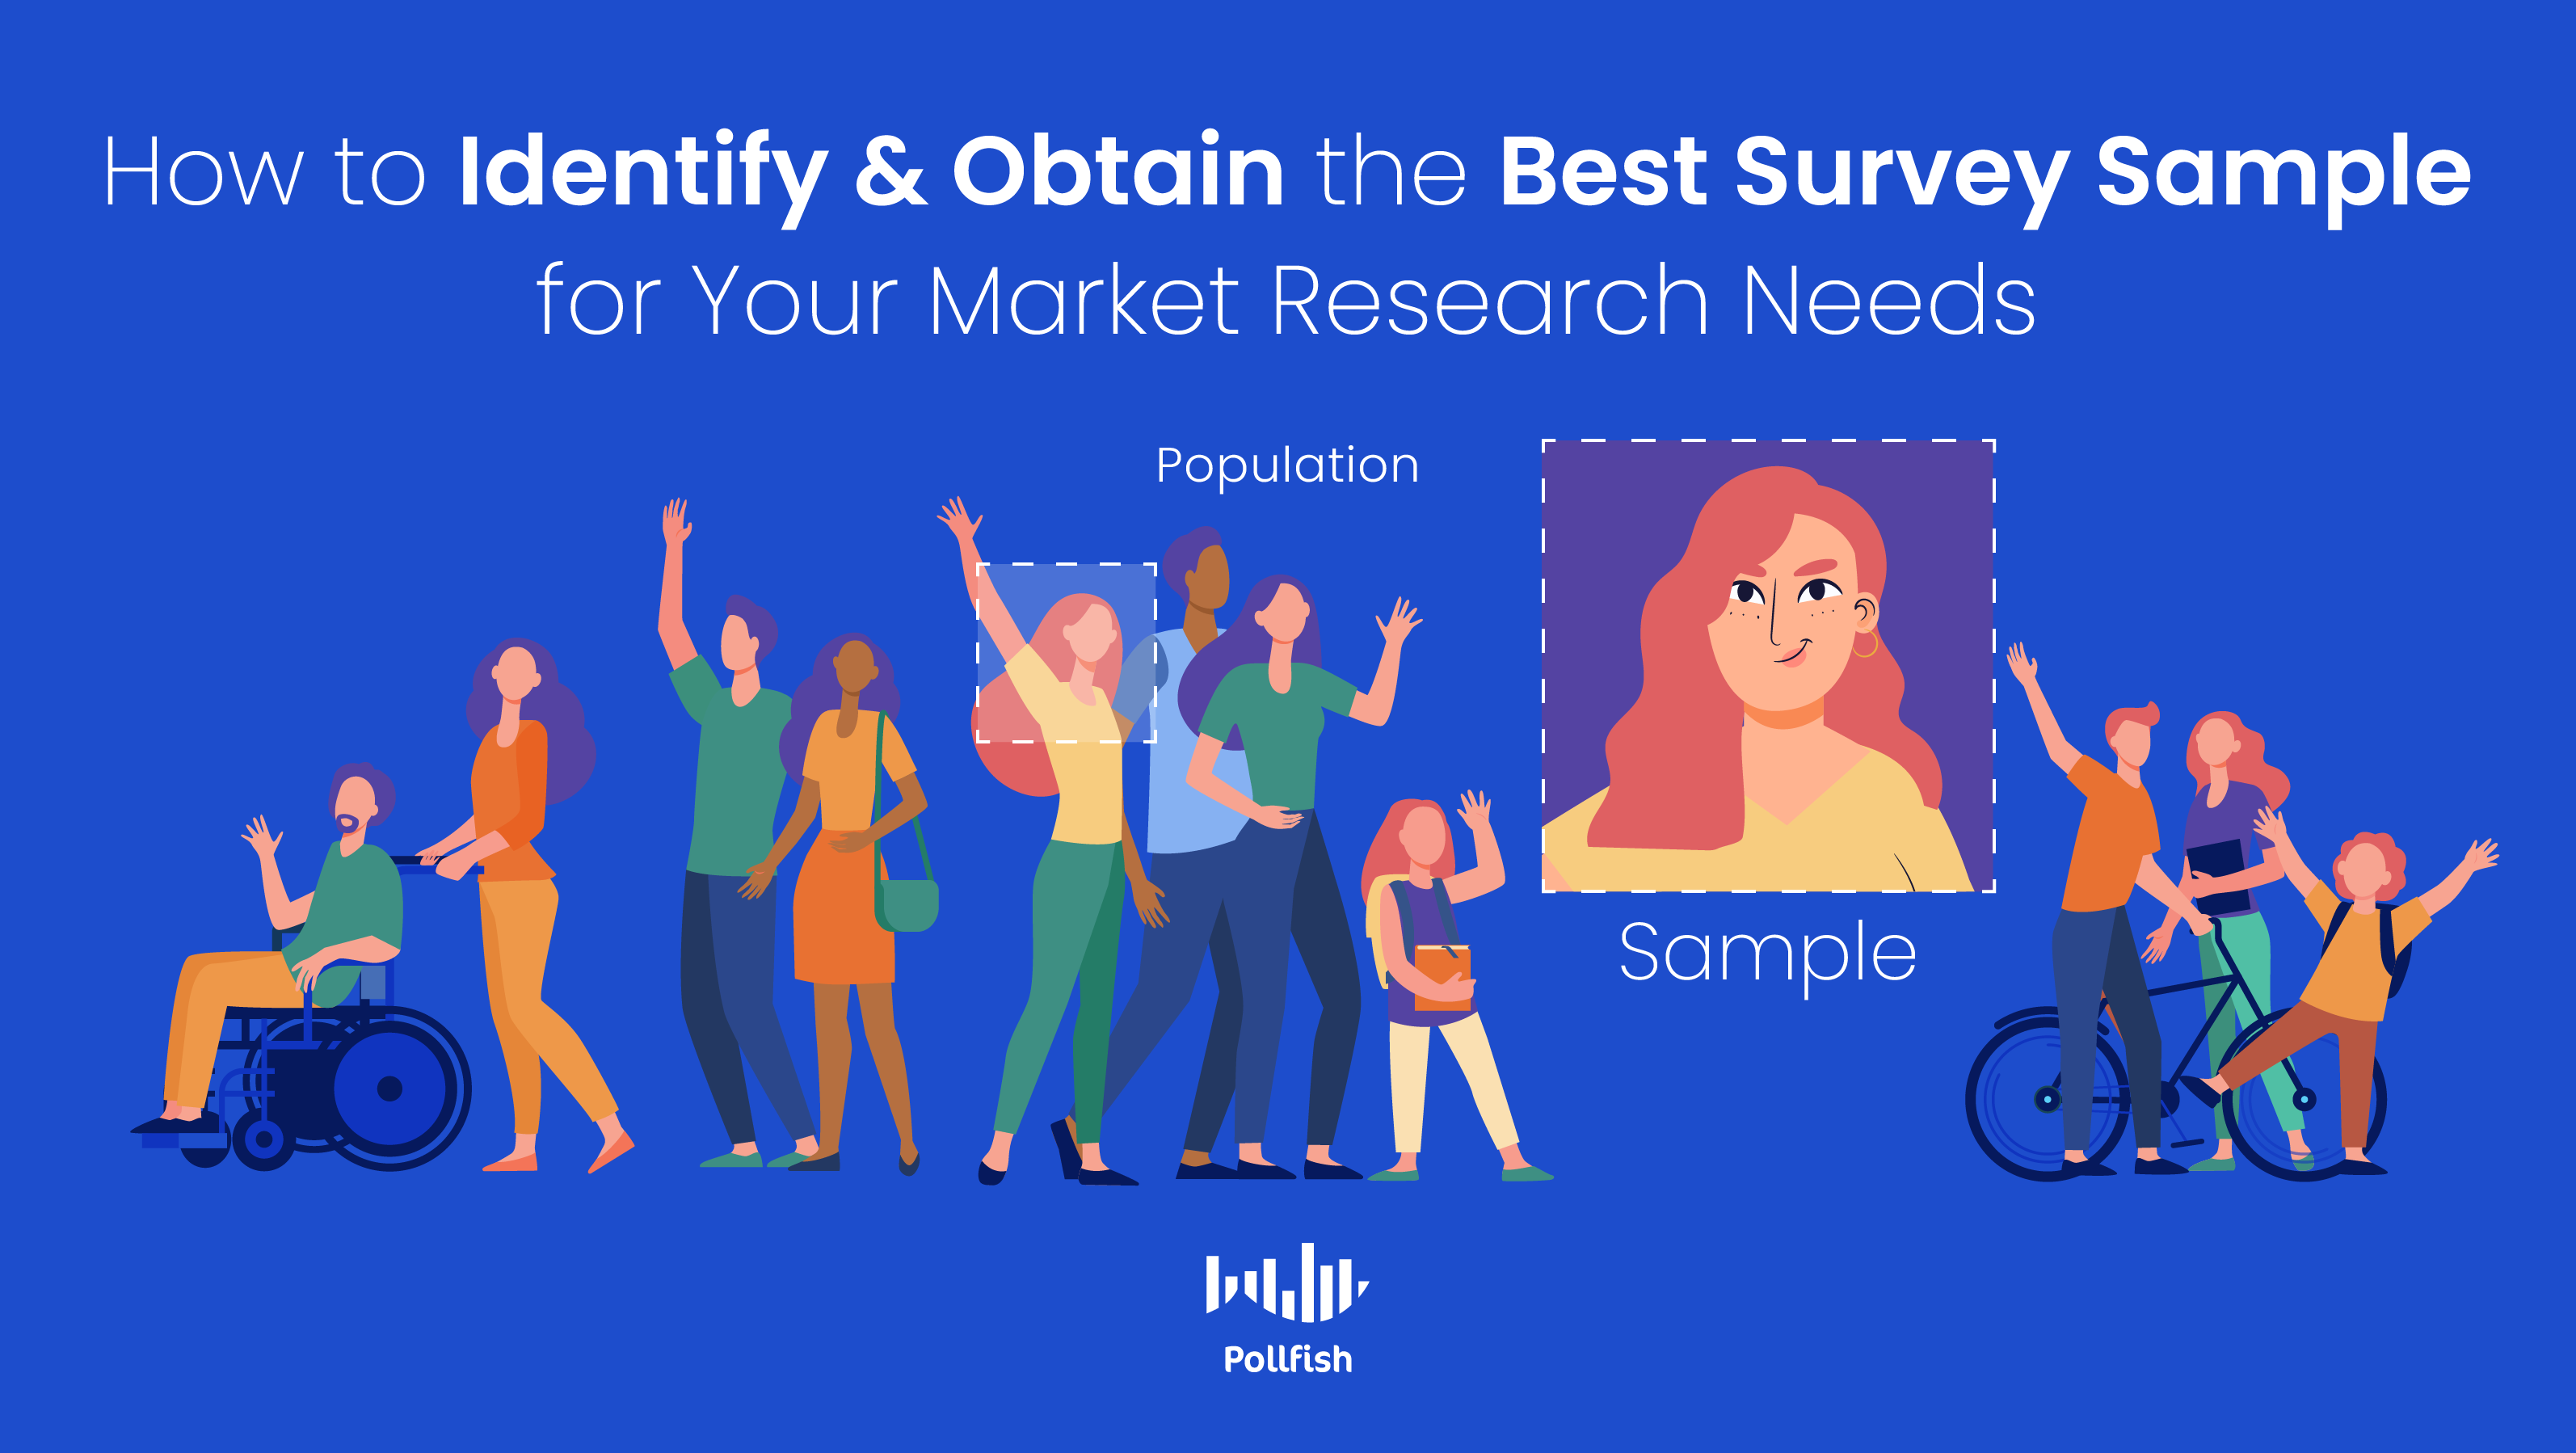
A survey sample is a critical batch of respondents studied in market research campaigns. Given that this group forms the core of any campaign, it needs to be dealt with correctly.
This involves extracting the sample, reaching out to it across various digital properties, analyzing it and moving forward with all the necessary steps to generate effective survey studies.
As such, market researchers and marketers should be acquainted with the various survey sampling methods used to obtain a survey sample and all of its other particulars.
This article provides insights into the survey sample, including how to collect one and proceed with analysis and other crucial next steps.
Defining the Survey Sample
Also called the survey pool, a survey sample is a group of participants who take part in a market research study, specifically, a survey study.
As its name suggests, this sample is derived from the method known as survey sampling, in which researchers extract respondents to represent a population of study. There are various methods and sub-methods involved in survey sampling.
In market research, the survey sample comprises a business’s target market, that is, a portion of a market population that is most willing and likely to purchase from the business. As such, all marketing efforts are directed at this group of the population.
A survey sample does not have to be broad, meaning that it does not necessarily need to study all the members that make up a target market. Instead, it can be composed of a specific segment of a target market.
In order to procure this segment, researchers must perform market segmentation.
Understanding the Various Ways to Obtain a Survey Sample
As aforementioned, there are various ways to acquire a survey sample, one of the most critical preliminary steps in conducting market research techniques.
Acquiring a survey sample includes two major undertakings:
- Deciding on the makeup of the survey sample itself
- Choosing a method to obtain the survey sample
The former involves determining who will take part in the sample and how many respondents to include in the sample. The latter is known as survey sampling and it entails garnering the members of a target population to take part in a survey study.
In regards to the latter, there are two main methods of survey sampling: probability and random sampling. First, you will need to identify the makeup and scope of your survey pool. Then, you can move forward with it by deciding on a survey sampling method to obtain the pool.
The following explains how to carry out the formation of the survey sample.
How to Choose the Makeup of the Survey Sample Itself
In reference to the above section on understanding the ways to obtain a survey sample, the second aspect of acquiring a sample — after choosing between the probability and non-probability sampling methods — is to decide who should be in the survey sample itself and how big it should be.
In order to decide on the makeup of the sampling pool, follow these steps.
- Refer to the purpose of your market research campaign.
- Ask yourself, what are its main themes and variables, along with its appropriate macro markets.
- For example: To learn how to market a new product to middle-aged adults in the US, your target market, or target population is middle-aged adults in the US.
- Decide whether you are looking to study the wider target population, or if it is more convenient for your business to study a particular segment of the population of interest.
- In this case, you would need to conduct market segmentation.
- You can also perform market research to reach the correct target market sample.
- Determine your accuracy requirements. This involves understanding the degree of the risk your survey study will take in terms of receiving answers that do not accurately describe the entire population.
- This is because you won’t be surveying the entire population.
- To determine how closely your answers reflect the views of your studied population, you’ll need to calculate the margin of error.
- Ex: If your margin of error is 4%, that means 4% is added on both sides of the results of your survey sample. So if 70% of your sample likes shopping online, then the results show that 66-74% of your sample actually likes online shopping.
- Your margin of error should be kept under 10% to maintain quality findings.
- Find the proper confidence interval. Also called the confidence level, this metric shows the likelihood of the sample you used matters in your results, as repeated studies would form the same results.
- For example, a 95% confidence level would yield the same results 95% of the time.
- 95% is the most common confidence level used in statistics. The ideal confidence level range is between 90-99%. Anything lower than 90% is not recommended.
- Finally, decide on the most fitting survey sampling method to extract your survey pool.
The Two Main Methods for Obtaining a Survey Sample
Once you’ve identified the makeup of your survey sample, you’ll need to deploy your surveys. To do so, you must decide on a method for obtaining your survey sample. The following explains the two main types of survey sampling methods.
Market researchers ought to understand these methods and all that they entail before initiating any market research campaign. Being versed in these methods will help guide your study.

Probability Sampling
Also called random sampling, this method involves giving every member of a studied population an equal chance of being selected in the survey sample. In order to select the respondents, researchers would use a random process, in which selected participants are presented as unbiased representations of the total population.
Probability sampling has several more complex sub-methods, such as stratified sampling, which involves selecting participants from subgroups of a population, such as those based on age, location, ethnicity, interest, etc. There are various other methods that makeup probability sampling.
Random sampling aims to gain a sample that represents an entire population of study. Therefore, the results of the study must be generalizable to the studied population. As such, this method is viable for quantitative market research, since it is focused on understanding a larger population by studying a much smaller subset.
This kind of sampling is therefore not ideal for qualitative market research, which seeks to elucidate a specific group of people, without generalizing the findings to a larger population.
Non-Probability Sampling
Also referred to as non-random sampling, non-probability sampling acts antithetically to probability sampling, as it does not use random means to select respondents. Thus, the members of a studied population do not have an equal chance of being selected; some of them will have no chance of being selected.
This main sampling method also has several of its own methods, such as convenience sampling, in which participants are selected if they are readily available and willing to participate. For example, if your study requires studying librarians and you only select those in your zip code, as opposed to those across geographic locations.
All procedures that avoid random selections and involve the judgment of the researchers fall under the non-probability sampling method. As such, even an online survey platform — which has a far wider reach than focus groups or one-on-one interviews — is considered a non-probability sampling tool. This is because in such a platform, the survey sample is not derived from every member of the target population. These kinds of platforms may also not rely on random processes.
One of the most powerful forms of non-probability sampling is organic sampling or Random Device Engagement. This method procures respondents organically, that is, it reaches them in their natural digital settings, as opposed to using survey panels, a sampling method that involves pre-recruiting a set of respondents.
RDE polling engages digital users where they are voluntarily; as such, participants join on their own will and can be found on a vast network of publishing websites and apps. Thus, although the respondents aren’t extracted through organic means, RDE still offers a survey sample that joined through organic settings.
How to Proceed with a Survey Sample
After determining the correct people to use for your survey sample, choosing which sampling method is best, along with the correct sub-method to use, launch your survey. Then analyze your initial results by performing a survey data analysis.
This will be the preliminary analysis, as based on your findings, you may need to conduct another survey, either on the same group or on a specific segment of your target market, if your study was aimed at your general target market.
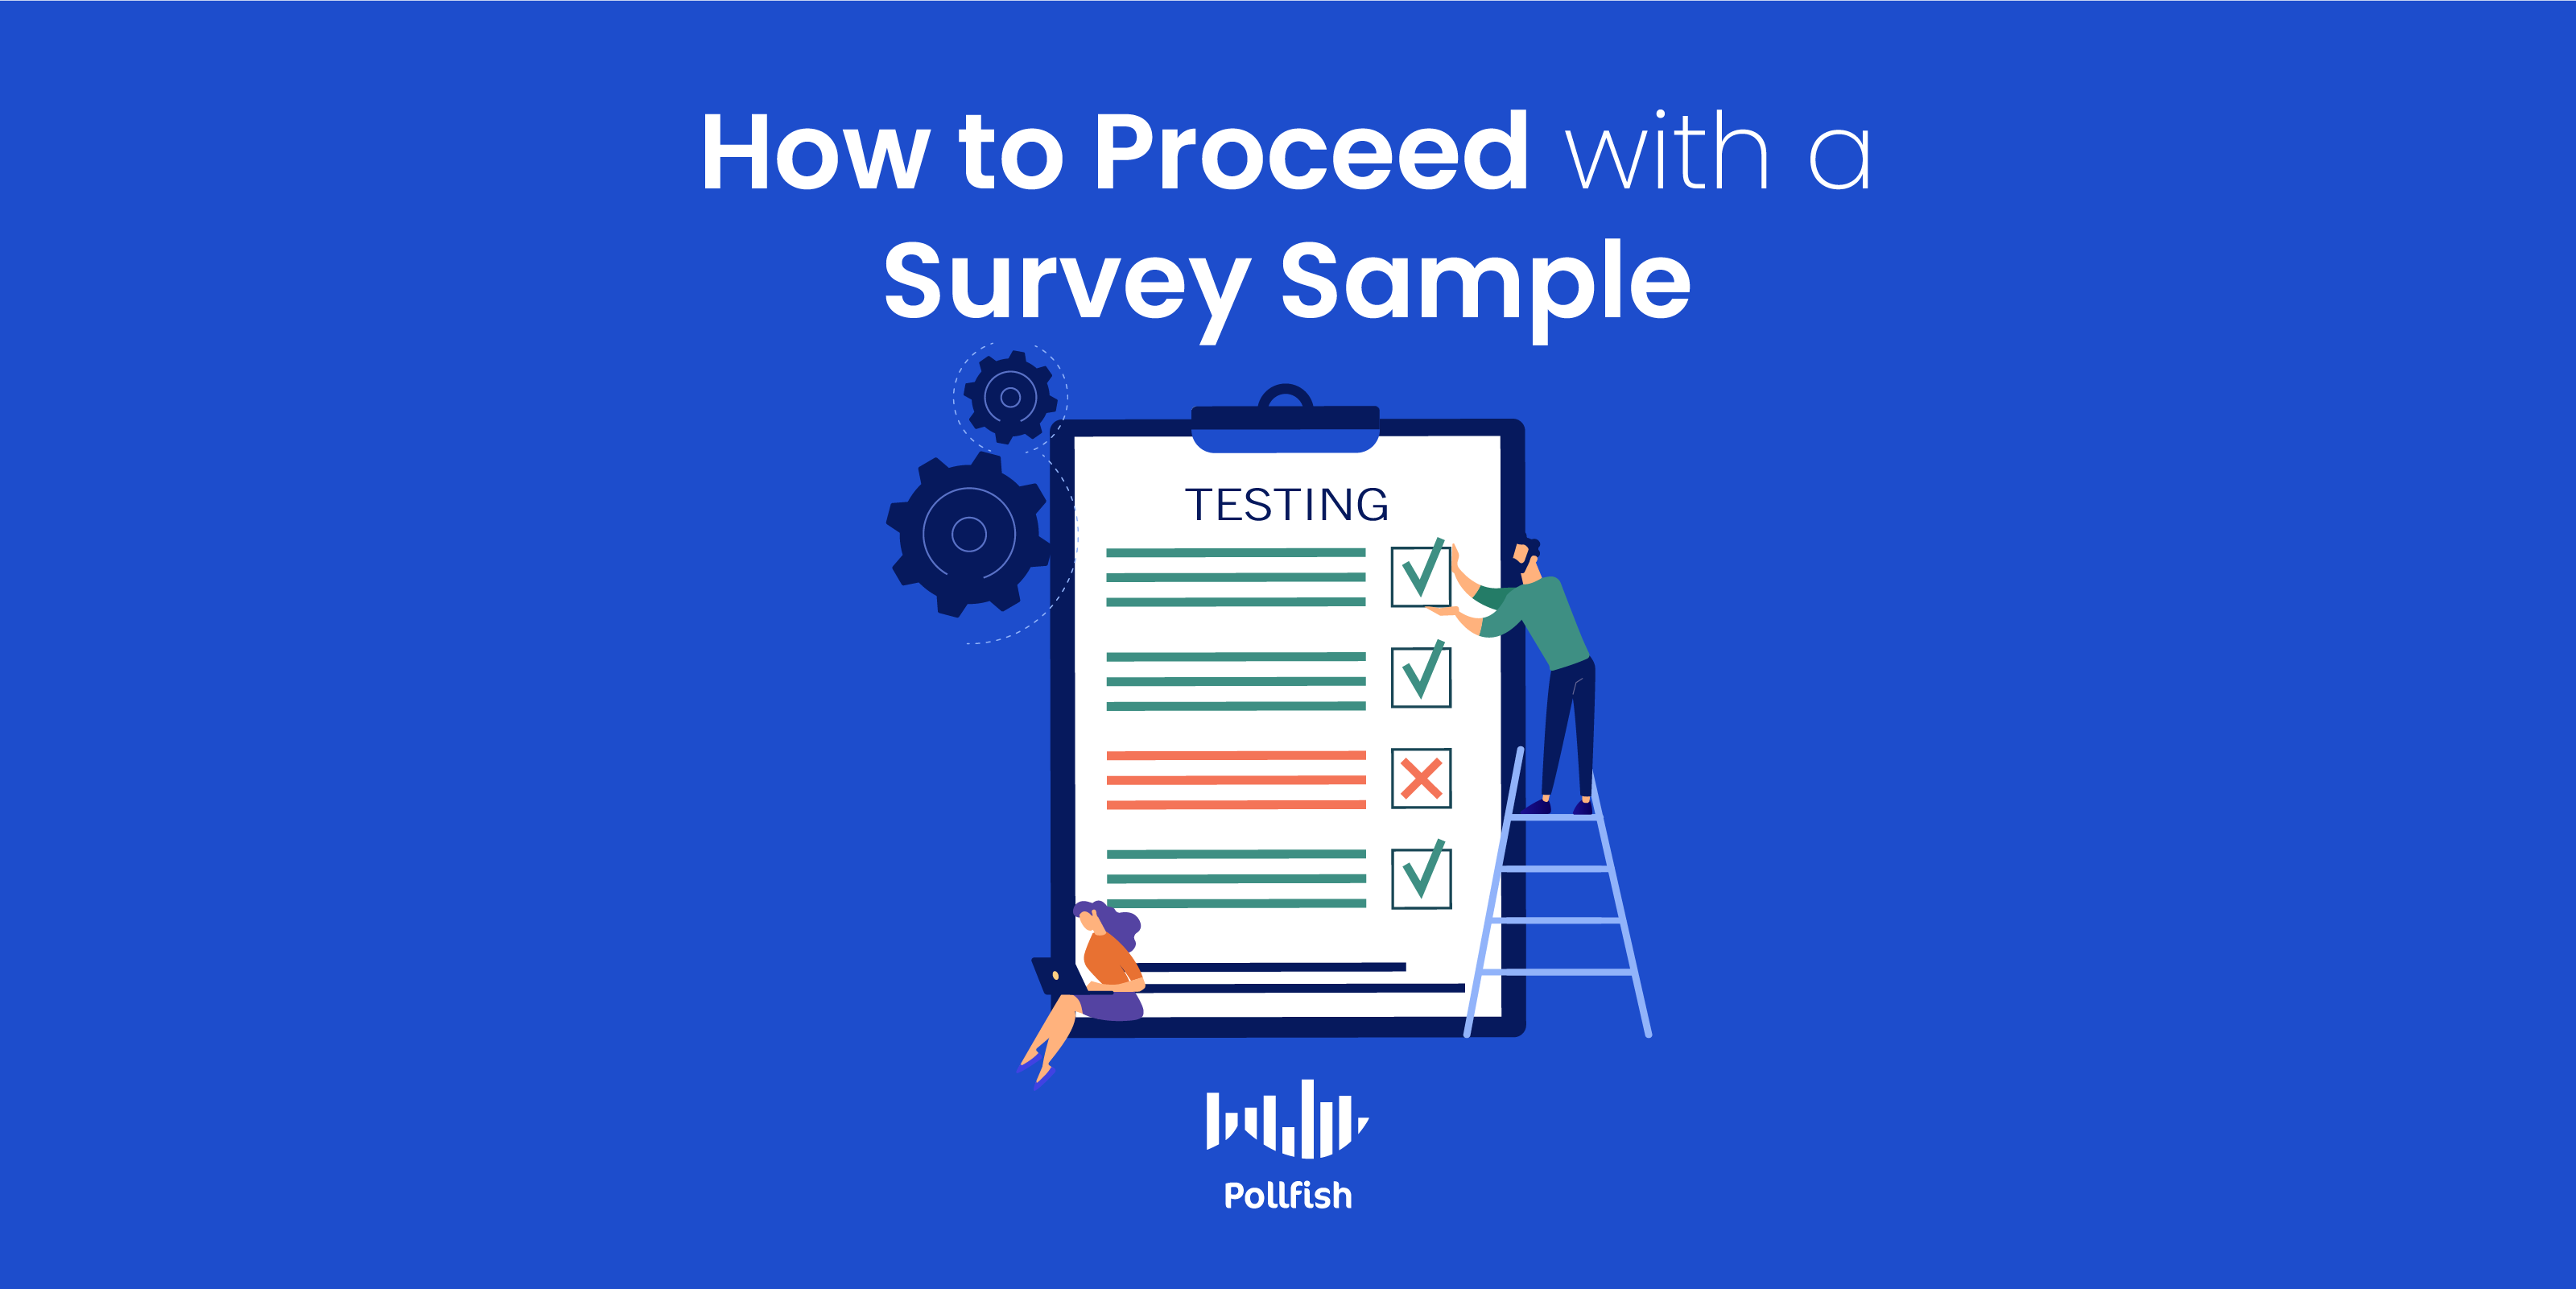 If you surveyed a segment of your target market, you may need to study another to compare the two. Perhaps some segments are more inclined to generate customer loyalty than others.
If you discovered a particular behavior from your survey studies that require further studying, consider embarking on experimental research. This will help you prove whether there are correlational factors at play between your variables.
Once you’ve received a valuable share of insights, take action. A valuable amount will differ from company to company and research campaign to research campaign. Consider the findings of your survey studies. If they point to the utility in certain actions, especially if those actions seem prospective for your study or business at large, then take them. The goal of a survey sample is to forge ahead in your market research, which should always be actionable.
Leading the Charge on Your Survey Pool
The survey sample, also referred to as the survey pool, is indispensable for all market research campaigns, as those of the present-day usually rely on survey research. As the core of the survey campaign, the survey sample will determine the accuracy of the entire market research operation.
As such, it must be identified carefully and obtained properly. Aside from the actions to take in regards to these practices, another crucial factor in developing surveys for the correct survey sample is an online survey platform. Such a platform should not simply allow you to create surveys and deploy them, but to reach the correct people, i.e., your survey sample.
A potent online survey platform will allow you to choose the respondents making up your survey pool in the screening or audience section of the survey tool. In this section, you should be able to add and filter the respondents you seek on a variety of categories, including demographics, psychographics and geolocation.
The key is to choose the correct online survey provider.

How to Increase Market Share with Surveys
How to Increase Market Share with Surveys
Companies that want to achieve brand leadership must evaluate and work towards increasing their market share. Businesses with a large market share yield larger profits and brand equity, granting them instant recognition and household name status.
While elevating market share may be the objective of many businesses, it is often difficult to come by, especially for startups and smaller companies. Small businesses are particularly at risk, as 20% of small businesses fail within their first year.
A significant market share prevents business failure, while a shrinking market share can lead to bankruptcy in the worst cases. Thus, it is in the best interest of businesses to assess and attempt to grow their market share, as it will help them achieve recognition and increase profitability.
This article explores the concept of market share, its importance, calculation and how market research, particularly surveys, help increase market share.
Understanding Market Share
Market share refers to the portion of a market that an individual company controls. Specifically, it is the percentage of total sales generated by a particular company in an industry.
This metric is calculated by factoring in a company’s sales over a period of time along with the total sales over the same period. Market share is typically assessed over a year or quarter. (The formula and explanation are in a below section).
This calculation provides a general idea of the size of a company in relation to its market and its competitors. A company with the largest market share is considered a market leader in its industry. These companies tend to be well-established brands with a strong brand equity and consumer loyalty.
Market share shows a business’s monetary standing and its portion of dominance within an industry. As such, it shows how it measures up against other businesses in its market. To increase market share and outperform competitors, a business would need to earn more sales, those that exceed the sales of competitors.
The Importance of Market Share

It is important to keep track of market share in order to understand how a business fares in its overall market and how it performs compared to its competitors. Additionally, growing market share begins with analyzing it.
Businesses of all sizes should aim at scaling their market share, as a higher market share gives companies a competitive advantage. This is because companies with higher shares yield higher buying power, allowing them to save money by receiving better prices from their vendors.
This is made possible by making larger order volumes, something businesses with high market shares engage in, as larger market shares reveal a higher demand for their products or services.
As such, an increased market share works in parallel with larger production, and greater production lessens a company’s cost of producing an individual product. This is due to the economies of sale.
Additionally, the market share metric is a measure of market competitiveness, allowing business owners and executives to forecast market growth and reduction. It indicates whether a business is poised for success or needs to strategize more on avoiding market declines.
It allows businesses to gauge their market potential and focus on improving their standing. Moreover, it is a critical measurement to be used in tandem with studying customer behavior, as it places it in perspective with a business’s market performance.
When businesses increase their market share, they essentially wield a larger slice of the market; a high-performing business will see increases in its market share quicker than its competitors. It is critical to mark down changes to a market share — these include both changes in a business’s own market share and those of its competitors.
This is because, in stable markets, changes in share distribution can distort the well-balanced market forces. In growth markets, however, changes are expected and are less consequential.
Despite the dynamics of a market, increasing market share is crucial for businesses to grow their company. Thus, a larger percentage of the market yields higher sales and revenue.
How to Calculate Market Share
This metric follows a fairly simple calculation. Market share is calculated with only two variables: a company’s sales within a certain time period and the total sales within an industry during that same time period.
To calculate market share, you need to divide a company’s total sales over a specific time period, such as a quarter, by the total sales of its industry within that period. The result is your market share for that time period.
The Market Share Formula
The following displays the simple calculation of the formula:
Market share (MS) = Total sales (S) / Total industry revenue (R) X 100
The following is an example of a business’s market share for one year:
S= 900,000
R= 100,000,000
MS= 900,000 / 100,000,000 = 0.009
MS= 0.009 x 100 = 0.9%
MS= 0.9%
However, businesses can also calculate their relative market share, the measure of a business’s share in comparison to a specific market competitor or market leader. In this case, you would need to have measured your market share already, as it is one of the variables.
Divide your market share by that of the relevant rival. The formula is as follows:
Relative Market share (RMS) = Individual market share (MS) / Largest industry market share (LMS) X 100
How to Grow Your Market Share
Growing a business’s market share relies on a multitude of factors and strategies. Business owners and marketers must apply all of these methods and more to successfully increase their market share.
These methods also help businesses improve across various functions, making them useful contributors to overall business success.
Marketing and branding
Marketing and branding campaigns help businesses improve on a wealth of KPIs. These functions drive demand, awareness and grow a digital following. Branding is one of the many branches of marketing and it is essential for long-term success.
Reduced prices
Price reductions and their various offshoots (promotions, holiday specials, etc.) have long been trusted methods to draw more sales. This allows businesses to beat the prices their competitors offer, luring in new customers before using regular prices again.
Nurturing and Retention
Nurturing customers leads to customer retention, as it allows businesses to be fresh on the minds of their target market. There are numerous ways to do this, such as via email marketing, newsletters, a content subscription, social media, ads and more, such as follow-up calls. This creates relationships with customers, the kinds that nurture them to continue patronizing the company — thus helping raise its market share.
New Features, Products and Services
Creating new offerings helps a brand stay relevant and opens the door for more revenue and sales pools. Many major companies profit off of their innovation, such as Apple, which annually offers new products and product upgrades.
Acquisition
Acquiring the competition not only removes a competitor as a threat to a business, but also gives a business all of the acquired company’s sales, revenue and shares. Mergers and acquisitions grant businesses a major growth spurt and all the assets from its acquired company, directly increasing their market share.
How Surveys Help Increase Market Share

Surveys are a prominent market research method, especially the online survey variety, which connects businesses with the masses, including with those in their target market.
Surveys allow businesses to access the minds of their customers, showing them how to better serve and market to their target market. Surveys also allow companies to uncover the makeup of their target market via market segmentation and identifying customer personas.
Studying the needs, desires, opinions, sentiments and aversions of your target market is an absolute necessity for businesses. In fact, 14% of businesses fail due to not paying attention to their customers’ needs. Those that do are more equipped to acquire new customers and retain existing ones.
Surveys allow brands to be data-driven, providing a tried and true method for obtaining data for decision-making.
Surveys also have the capability to influence customers’ purchasing decisions. This is especially true if a brand inserts its name and offerings into its survey. Or, it can pinpoint customer pain points and the lack of other companies’ means of correcting them.
Surveys enable businesses to ask any questions they seek, thereby bringing them answers they wouldn’t otherwise find from conducting secondary research alone. They are superior to other primary research methods, as they are completely anonymous and lessen the pressure of respondents to answer in a particular way.
As such, survey research makes businesses well-attuned to their customers, allowing them to market to, nurture and communicate with them more effectively. In turn, their performance will improve, raising revenue and therefore their market share.
Netting a Larger Slice of the Market
Businesses of all sizes must assess and work towards increasing their market share, as it represents the portion of a market that an individual company controls in relation to the overall market.
It helps businesses understand their market standing in comparison to their competitors and predict growth and declines. A larger market share lets businesses increase their capacity and efficiency.
In order to evaluate and grow market share, businesses ought to conduct survey research. However, they must use the correct online survey software.
A strong online survey platform offers a plethora of capabilities and extracts only the most quality data.
Such a platform should offer full customization of the screener and questionnaire, deploy the survey to targeted individuals in a massive publisher network, offer filtering data after the survey completes all of its quotas and use artificial intelligence to perform quality checks that remove poor quality data.
This kind of platform provides the most useful customer data, allowing a business to make headway to its market share.