How to Avoid Survey Attrition and Keep Sought-After Respondents
How to Avoid Survey Attrition and Keep Sought-After Respondents

Survey attrition affects many research projects, whether they deal with market research or other varieties. A detriment to survey research, attrition creates a challenge that concerns retaining sought-after survey respondents, the kinds that provide the most value for your study.
As such, researchers ought to understand survey attrition, where and how it occurs, along with heeding best practices to weed it out. This will ensure that they form effective survey studies for valuable research.
This article expounds on survey attrition in its dominant forms, in addition to the methods researchers should adopt to reduce and avoid it altogether.
Defining Survey Attrition
Attrition is a term denoting the weakening or tearing away of something through sustained means. In survey and market research, the latter part of the definition usually occurs inadvertently, as no researcher would purposefully want to debilitate their research campaigns.
In more specific terms, survey attrition involves the decrease of the sample size, number, or strength and can occur intermittently or permanently.
Survey attrition occurs through several adverse phenomena, since in simple terms, it refers to the act of leaving a survey study. As such, there is no single form of survey attrition; however, survey attrition has typically focused on two kinds of attrition.
The Two Main Types of Survey Attrition
Although plenty of factors can fuel attrition, as most researchers have experienced survey respondents leaving a survey study, there are two main categories of survey attrition. As such, survey attrition research is committed to understanding these two predominant forms, along with the methods to increase participation.
Nonresponse Attrition
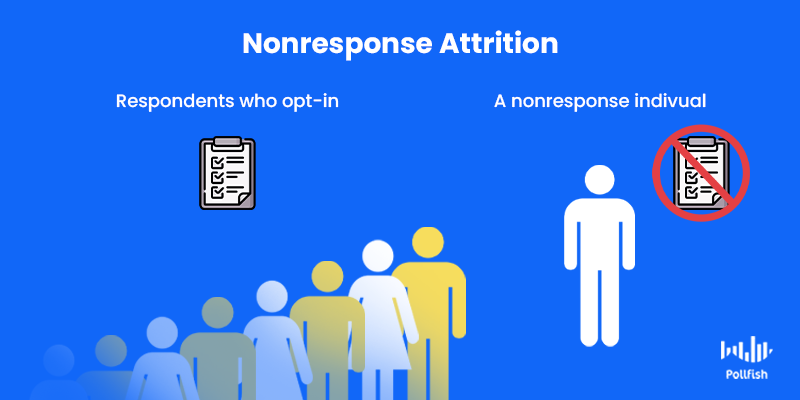
Also called nonusage attrition, nonresponse attrition refers to when those invited to complete a survey opt out of participating, thus rendering the loss of these respondents. This form of attrition occurs within systems that involve researchers reaching out to respondents and recruiting them, such as in survey panels and focus groups.
Another form of nonresponse attrition is more difficult to tract; it involves those who were reached via automated survey means. Since these users never entered the survey by the nature of nonresponse attrition, they are virtually impossible to monitor.
Dropout Attrition
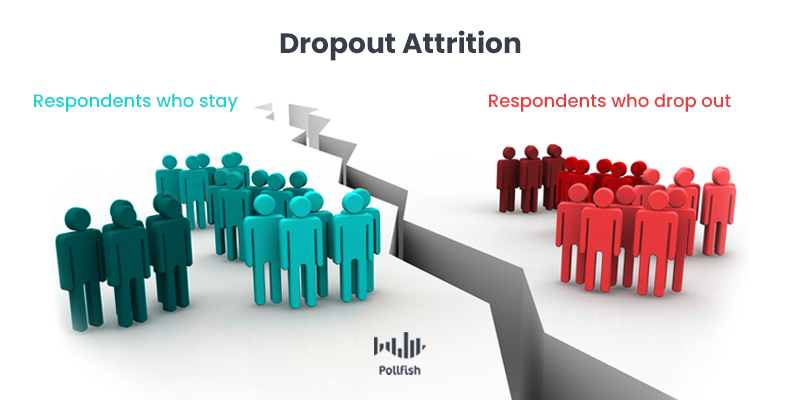
Dropout attrition refers to respondents who have already begun a survey and dropped out, as the name suggests. This attrition can occur in any kind of survey distribution method, from targeted outreach such as emails and survey panels, along with automated surveys and prompts on landing pages, etc.
This kind of attrition can be tracked through certain online survey platforms, although not all will offer this capability. Often, studying dropout attrition involves studying the completion rate.
How to Avoid Non-Response Attrition
Researchers should bear in mind that there are going to be targeted members of your survey research that won’t even open your survey. There are, however, several practices that can reduce non-response attrition. Here are a few examples:
- Create highly targeted surveys. Solicit respondents via a survey that somehow relates to respondents or their market segment. No one likes receiving junk mail or being spammed with survey requests.
- Reach those who interacted with a CX you can confirm. Ex: a purchase, a browsing session with no conversions (usually can be tracked with signed-in users), a phone interaction, etc.
- This will stamp out the feeling of randomness, so that the respondent doesn’t feel they are randomly selected, i.e., being spammed.
- Use incentives. Survey incentives grant respondents with a motivation to spend time out of their busy schedules on a survey.
- Don’t over-survey. Even if a respondent has taken part in a survey, there is no guarantee they won’t ignore a second request (or others). If you need to follow up, consider using other individuals in your target market.
- Be upfront with the purpose and the survey’s importance. Respondents should not feel they are randomly selected — or that they’re selected for something of little importance. Thus, make the purpose of the survey clear, highlighting its need and usefulness, for example, to improve their customer experience.
- Display the time required to take the survey. For transparency, make the estimated completion time clear so respondents will know if they are able to take it based on the time they have.
- Consider instances most relevant to the target population. Send the surveys around those instances. Certain market segments have key dates that you can base your surveys around. For example, if you are looking to conduct a real estate survey and your target market is college grads, send the survey around graduation time, when the grads move out of their dorms and into their post-college life.
How to Avoid Dropout Attrition
Avoiding dropout attrition involves optimizing the in-survey experience, i.e., the survey itself. Researchers can encourage respondents to complete their survey in a number of ways. Here are a few critical methods to avoid dropout attrition.
- Keep survey size commensurate with the survey incentive. If you’re not granting any incentives for taking the survey, keep your surveys short, at no more than 5 questions. However, if you provide incentives, then the survey length should be proportional to the incentives. If a survey takes longer than 10 minutes to complete, consider offering a more substantial incentive.
- Optimize it across devices. We are no longer living in a digital-only, i.e., desktop-only world. Instead, many devices are used on the go like mobile phones and tablets. Assure that your survey can be easily seen, accessed and used across all devices. This includes checking for loading times, for content fits on the screen and no points of friction.
- Keep questions on-topic. Irrelevant surveys or surveys that seem to veer from the topic they initially presented the respondents with, will easily deter the respondents from completing the surveys. These stir up confusion, boredom and sometimes, even stress.
- Customize follow-up questions. Each respondent answers differently; as such not all respondents should be taken to the same questions. Instead, route respondents to questions based on the answers they provided via advanced skip logic.
- Avoid ambiguity in your questions. If they have to overthink a question or feel as though they’re unable to answer it, chances are, the respondents won’t complete the survey. Assure you provide all possible answers in your multiple-choice questions. If this is not practical, include an option for “other,” and allow it to be open-ended.
- Create engaging experiences with multi-media. These elements include photos, videos, GIFs and the like. Aside from embellishing the questionnaire, they create engaging experiences that stimulate your respondents beyond a text-only survey.
- Check your completion rates. Check your completion rate regularly. These should be available in the online survey platform you use for your survey campaigns.
Maintaining a Steady Flow of Survey Participation
Since survey attrition cannot be fully avoided, so researchers ought to maintain steady response and completion rates. Additionally, they ought to keep optimizing their surveys, so that they are providing both the respondents and the researchers a smooth, glitch-free experience.
Aside from the technical function of the survey, its success largely hinges on its questionnaire, which should always be kept relevant to the sampling pool. As such, market segmentation comes into play. As a marketer or market researcher, you ought to be in tune with the makeup of your target market — or target population if you are a general researcher.
This requires conducting preliminary market research. A potent online survey tool will help you achieve this with no hassle, allowing you to retain your most sought-after responders.
Frequently asked questions
What is survey attrition?
Survey attrition refers to a decrease in sample size or the survey strength. This happens when respondents can't complete a survey or drop out permanently from participating in a survey.
What are the two types of survey attrition?
These include non-response attrition and dropout attrition. Non-response attrition refers to participants that are unwilling or unable to complete a survey, thus rendering a loss of survey participants. And dropout attrition involves participants who are in the middle of a survey and then leave it halfway.
How can you reduce non-response attrition?
There are several ways to reduce non-response attrition that includes using incentives to encourage customers to complete the survey. Also, creating highly targeted surveys for different respondents can ensure that their time is not wasted.
What causes dropout attrition, and how can you reduce it?
Dropout attrition is when respondents exit the survey in the middle due to an obstacle. These obstacles could be lengthy or ambiguous questions, the lack of survey optimization across various devices, etc. To avoid dropout attrition, ensure your survey is optimized for mobile devices and keep questions concise. Creating an engaging survey with multimedia can also increase their interest, motivating them to complete the survey.
How can you maintain a steady flow of participation?
Survey attrition cannot be avoided entirely; therefore, from their end, you should strive to maintain steady completion and response rates. In addition, keep optimizing your surveys for any technical glitches so the survey experience is smooth for your respondents.
The Complete Guide to Mastering the 6 Most Critical Types of Research for Any Research Endeavor
The Complete Guide to Mastering the 6 Most Critical Types of Research for Any Research Endeavor

Understanding the six most critical types of research is an absolute must for market researchers and general researchers alike.
The world of research is ever-expanding as new technologies evolve, new techniques for obtaining data arise and more secondary sources become available to the public.
However, the six chief types of research remain as the foremost processes for conducting investigations. They refer to specific types of research which include more than merely using a method of study.
This guide explains the six prominent types of research, when to use each, how they benefit business and more.
Defining the Major Types of Research
For the purpose of general research, a major type of research does not refer to conducting studies on a designated topic of choice (for example, sales research).
So what defines a “major” type of research?
When categorizing research into several key varieties, a “type of research'' refers to a particular form of research that can examine virtually any topic and its variables, thorough particular means and approaches. These approaches involve using distinct components such as methods, processes and frequencies particular to one kind of research.
These components form the core of the research type, making it feasible to differentiate from others. Each variety of research is also bound by a unique purpose. This purpose is not thematic, as it can be applied to all kinds of subjects of study.
Despite operating through different approaches and methods, some forms of research share several features, including the purpose of the study/ the kind of results it seeks to some extent.
The Need to Understand the Different Types of Research
Whether you operate under a B2C or a B2B business, either as a business owner or market researcher, you ought to verse yourself in the different types of research. This includes being able to distinguish between them and not confusing one for another.
Before you tackle any area of concern to investigate for your research needs, you need to assure you’re setting your research project up for success. In order to form an effective research campaign, you’ll need to be methodical.
This means you’ll need to tend to several concerns to build a successful campaign. This involves organizing your topic of study and inquiries into a particular variety of research.
Doing so will ensure you apply the correct market research techniques and methods, the kinds that best suit the inquiries and needs of your topic of research, thus, best tending to your concerns.
When you use the correct type of research for your study, you’ll be able to understand it more thoroughly and thereby find more fitting changes and solutions. This is especially true when your area of study is a problem you would like to minimize or reverse.
Using the correct form of research will also ensure that you are measuring and observing the correct elements and by way of a frequency best suited towards your research issue.
Moreover, when you employ the proper type of research, it is far less likely to come upon errors and gaps that require answers. Thus, there is less of a need to start again or switch to a different type of research.
All of these areas of importance would be impossible to fulfill if you do not become familiar with them and are not able to tell them apart.
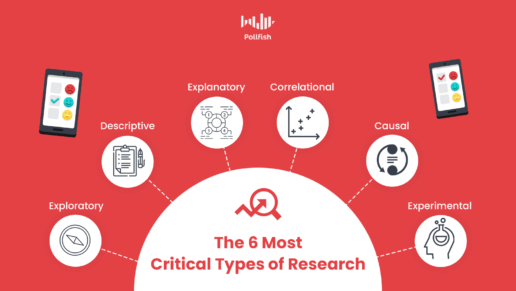
The following explains the six most critical types of research.
Exploratory Research
What it is: Used to reveal facts and details around a topic with little to no research, exploratory research forms the foundation of the research process. It identifies a topic, be it an issue or a phenomenon with scant details and seeks to find its basic properties.
As such, it finds the correct variables the researcher needs in order to begin the study, understand its basic elements and form a hypothesis. The key issue at hand, its variables and its hypothesis are used for further research.
Essentially, this kind of research forms the premise of a research campaign, assuring that the variables and other components are indeed what the researcher needs to study in the next steps (other types of research).
Stage in the research process: The very first
Conclusive? No
How it benefits a business: Before a business can explore an issue in-depth, it needs to decide on a specific topic, the existing problem within the topic and its key variables. This ensures the business is equipped to enter the next research stage (type) and that it does not have any extraneous variables or concerns that do not contribute to solving the problem.
Descriptive Research
What it is: This type of research is premised on describing a phenomenon, behavior or problem discovered in an earlier stage of research, usually in exploratory research, although it can also be focused around that which was discovered in explanatory research.
Descriptive research describes the nuances of a population, a variable or occurrence that a researcher requires further study on. Its objective centers on finding previously unknown facts or extracting more details on facets with fewer details.
It focuses on the what, how, when and where of a study rather than on the why.
Stage in the research process: The early portion of the middle stage
Conclusive? Yes
How it benefits a business: It is crucial for a business to understand a phenomenon and its variables in a full or close-to-full context. This type of research helps a business do just that, as it finds all the key details about a phenomenon that a business may not have known about before conducting the research.
What’s more is that, as a primarily quantitative form of research, it is apt for creating statistics. Being statistically-oriented allows this form of research to be conclusive, although it is considered to be in the early mid-stages of an entire research project.
These statistics are not simply key for internal resource purposes, but they provide a differentiating ingredient for your content. A strong content marketing strategy relies on putting out original insights; the data you derive from descriptive research is as original as it gets. This can be accomplished when you opt for a primary method (such as survey research).
Explanatory Research

What it is: Explanatory research is based on research that explains the already established aspects in a research campaign. It fills in the gaps and connects the dots from exploratory and descriptive research.
This type of research is unique in that it can be conducted either prior to or after descriptive research. As such, it rests in the early to mid-stages of the overall research process.
Like descriptive research, it works to shine a light on the various details that make up a research subject of study. However, contrary to descriptive research, it does not simply seek to describe, but rather to explain.
Thus, this research category falls under qualitative research. It helps find the why of a problem or phenomenon. It is not conclusive.
Stage in the research process: Early to mid-stages (can be performed before or after descriptive research, depending on a business’s needs).
Conclusive? No
How it benefits a business: It benefits a business in that it seeks to go beyond describing a subject of study. Rather, it plunges into a subject in greater depth, finding the kinds of insights that descriptive research cannot.
Additionally, it is flexible. It can be conducted following exploratory research and either before or after descriptive research, the only research of its kind to offer this benefit.
This research involves studying an important aspect that is studied in the later stages of the entire process, that of cause and effect. Explanatory research studies cause and effect relationships so as to explain their scope and nature, a critical precursor for correlational and causal research.
Correlational Research
What it is: Correlational research is a study into the relationship between two variables. Inspecting precisely two variables, this type of research seeks to discover and render the relationship between variables suspected of relating in some way.
This research seeks to make sense out of the variables identified in earlier stages of research. Although correlational research is not sufficient to conclude on cause and effect relationships, it is necessary to conduct to find whether a relationship between variables exists to begin with.
An observational form of research, it is non-experimental; there is no controlling or manipulation of the variables involved.
The relationship between the variables can be either positive, negative or zero (nonexistent).
Stage in the research process: Middle stage
Conclusive? No
How it benefits a business: Being able to determine if there is a positive, negative or zero correlation between two variables allows researchers to know how to move on to the next step: finding a cause and effect relationship between the variables.
A zero correlation informs a business that there's no need to further study the relationship between two particular variables, saving the business money and time. A negative or positive correlation dictates that further research is needed to discover whether there is cause and effect relationship.
Either way, the results derived from this type of research are highly influential on the next steps a business decides to take in their research process: whether to end it, continue and how.
Above all, it reveals how two variables relate to one other, giving a business a clearer picture of the environment they operate within, whether the variables concern sales figures, impressions or something more abstract like customer loyalty.
Causal Research
What it is: Causal research is founded on the undertaking of determining cause and effect relationships. As such, it involves conducting experiments and testing markets in a controlled setting. It is more scientific than any of the previous types of research.
This kind of research uses the findings from correlational and explanatory research in an attempt to unearth causal relationships. Since correlation does not equal causation, causal research studies whether the variables with a negative or positive correlation have any effect on the other variable(s) in the study.
Causal research has two objectives: finding which variable forms the cause and which makes up the effect, and understanding the relationship of the causal variables after the effect occurs.
Stage in the research process: Late-final stage
Conclusive? Yes
How it benefits a business: Often the final form of research, causal research is critical to complete the entire process. It involves conducting both secondary and primary research, the latter of which is experimental.
As such, this research type does not only observe, rather it investigates the variables themselves, manipulating them and controlling them as needed. This is crucial for a business in that it not only analyzes, but proves the existence of a causal relationship, along with how the effect manifests.
Thus, this research is not only conclusive, as it finds the most important result that a business or market researcher seeks: a proven answer to their hypothesis. This allows researchers to close off the research process, or conduct further experimental research if they so choose.
Experimental Research

What it is: Experimental research vigorously follows a scientific research design. It is entirely scientific, more so than causal research, as it nearly, if not fully implements the scientific method towards finding a solution.
The final stage of the research process, this kind of research uses all the information from the previous stages to conduct an experiment to test a hypothesis. It can also follow causal research; causal research itself is a kind of experimental research.
Researchers can conduct further experiments on the variables they found causal relationships for, in that they can test how to reverse an unwanted correlation, or minimize it to some degree. Or, further experiments can show a business how to reap more benefits from a desired correlation.
Stage in the research process: Final stage
Conclusive? Yes
How it benefits a business: Experimental research proves or disproves a hypothesis; as such, it is the final stage in the research process. It is the most scientific kind, leaving little to no room for errors, intuition or bias.
It can be used to accommodate causal research, digging further into a discovered cause and effect relationship. This is especially important for a business, as while it is critical to know whether a causal relationship exists, understanding how to move forward with this knowledge is of the essence.
Experimental research allows brands to test discovered causal relationships further, finding much-needed solutions. For example, a brand may want to learn how to reduce an unwanted correlation or to increase a needed correlation. Moreover, conducting further experiments can show brands how to gain a desired causal relationship sooner.
Complementing Your Research
In summary, there are six major types of research. A market researcher must consider these carefully before setting up their market research campaign. In order to build a comprehensive and effective study, you need to be able to organize your research.
To begin this endeavor, you need to classify your research topic(s) under a particular campaign, such as advertising, for example. Following this, you need to create a smooth and educated process. Thus, you need to follow the research process by way of the 6 dominant forms of research that this guide explains.
Doing so will ensure you conduct a comprehensive research campaign, one that leaves little to discover, except for possible future events, In order to complement your research, you need to conduct effective surveys for research campaigns. These allow you to understand your target market or target population. Even in experimental research, conducting surveys helps fill in the cracks and find answers to the unknown. Understanding your respondents, i.e., customers is paramount for a business. The proper online survey tool does not solely compliment a business or research endeavor, it completes it.
Frequently asked questions
Why is it important for marketers to understand different types of research?
Your business may cater to unique customer segments, including people of different ages and interests. This is why it's important for any business owner and marketer to use the right kind of research methodology for their research campaign. The correct type of research enables you to understand the data more thoroughly and find more fitting changes and solutions.
What are the 6 most critical types of research?
The six critical types of research include exploratory research, descriptive research, explanatory research, correlational research, and causal research.
How do you get accurate information for your research campaigns?
To get accurate information for your research campaigns, it is essential that you make effective survey questions that enable you to understand your customers on a deeper level. Even if your research is experimental, it is necessary to complement it by conducting surveys to help fill in the gaps.
What is conclusive research and which research methods are conclusive?
Conclusive research tends to be quantitative in nature and helps marketers reach a decision. Experimental research, causal research, and descriptive research are all conclusive as they require data-sets analyzed to help reach a conclusion.
Why is exploratory research the first step in a research campaign?
Before a business can conduct an in-depth study on a particular topic or its customers, it is important first to understand the existing problem and how the research can help fix it. This information can form the trajectory for the business to enter the next research stage and make it clear what kind of research to conduct next.

How to Achieve Agile Market Research by Filtering Data
How to Achieve Agile Market Research by Filtering Data

Achieving agile market research is a feat, even for the most technically savvy market researchers. This is due to the vast pools of data that researchers of companies big and small often confront.
Filtering data is both an effective and efficient means of gaining agile market research. This method helps sort out the chaos that bombards even the most powerful of market research tools.
A tool that leaves out critical data categories is bound to increase the presence of survey sampling errors plaguing a market research campaign. Concurrently, a tool that offers a vast amount of data categories and inputs is inclined to tarnish a survey campaign.
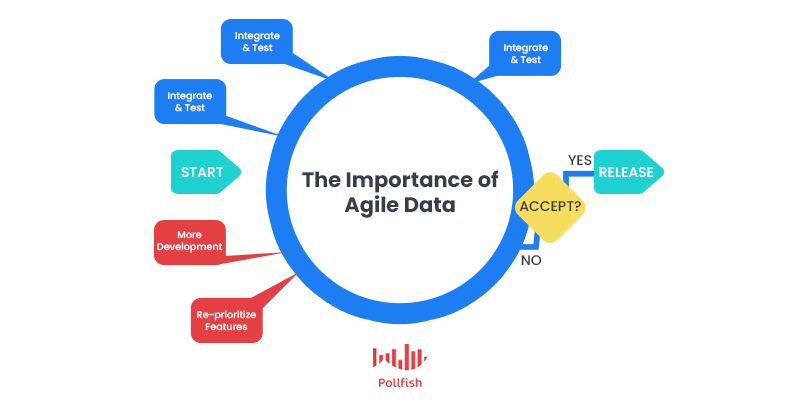
Filtering data is the solution, but it must have all the necessary functionalities in order to buttress agile data — and therefore agile market research.
This article explains agile data, how the correct filtering data interface can help you sustain agile market research and how the Pollfish platform offers advanced and granular filtering data functionalities.
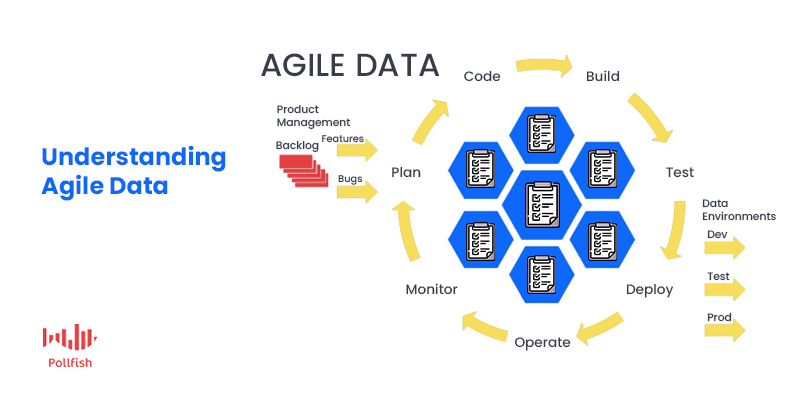
Making Sense out of Agile Data
Primarily used in the IT sector and designed particularly for its professionals, agile data is a concept that can significantly improve the market research process.
This is due to the vast reliance on data in market research — be it through secondary means or through the set up of effective survey studies.
IT professionals have founded different methods to accompany the larger catch-all phrase known as agile data. This refers to all the strategies that IT workers can apply to work more in tandem and more effectively on the data facets of software systems.
By fostering the means to work together more constructively, they reap several benefits, such as speed to insight, less waiting on higher-ups for making forthcoming decisions and smoother collaborations.
Agile market research is also borne out of the concept of agile data, to bring such benefits and more into the sphere of research.
The Importance of Achieving Agile Market Research
Achieving agile market research is a necessity in the current information age, in which various digital elements are jockeying for users’ attention, in spite of short attention spans. This ties in directly with survey attrition, along with site and app users avoiding a survey in the first place.
A major deterrent to the survey process, this issue mars the ability to build up an agile system of data collection, analysis and the yielding of results. Some market researchers may create various survey campaigns on similar subject matters as a way to remedy this.
After all, with more surveys on similar subjects, it appears to be more conducive to creating shorter surveys, a common best practice.
However, this runs contrary to agile market research, as it requires more time to create the correct surveys, launch them, cross-reference them and acquire quick results.
Instead, the online survey platform itself must be built on the premise of agile data, so that market researchers can tackle any topic quickly and without the need to implement many surveys and related survey campaigns.
One such way to form agile data and reap its benefits is through an advanced system of filtering data.
How Filtering Data Attains Agile Market Research
Almost every market research SaaS platform offers the filtering functionality, be it for determining the qualified respondents, forming the questionnaire questions and those of the screener.
While the different filtering data systems you’ll come upon in online survey platforms may appear to be carbon copies of one another, a closer look will reveal that they are not. Thus, they do not offer the same prowess of agile data — if any at all.
This is because agile data is not just about streamlining operations, but doing so while providing all the necessary functions and pieces of information.
A potent system of filtering data ensures that market researchers do not forgo using all the necessary categories of data, be it in screening questions, questionnaire questions or the demographics input.
In addition, a strong presence of data filtering allows researchers to organize parse through a large collection of data. This is especially useful in ambitious surveys, i.e., those that are longer or use more skip logic.
When data is neatly filtered, it is much easier to analyze it, make decisions on the next steps and complete a research project in a well-timed manner, thus forging agile data and maintaining agile market research.
How the Pollfish Platform Offers a Top Tier Filtering Data System
Pollfish clients secure agile data on a daily basis through the use of our advanced filtering data system, which is implemented throughout our dashboard, allowing us to divide it into just two sections: the audience and the questionnaire.
This minimalist approach saves researchers the headache and eyesore of rifling through various pages as part of building a survey from the ground up.
Instead, the platform offers multiple categories in our filtering system, permitting each aspect of the survey to be comprehensive and well-organized.
The following explains just how granularly researchers can define both their audience and set up their questionnaire through our filtering data functionalities.

Data Filtering in the Audience Section
First off, our filtering data function allows researchers to reach the correct respondents, with demographics categories that filter through common categories such as age, gender and geo-location. Each category allows researchers to assign quotas, so you receive the exact number of your selected respondents.
Although geolocation appears to be an ordinary demographic option, our filtering system is granular and manifold, so that researchers can filter the geolocation by 9 categories, such as postal code, US Census Region, city, state and more.
There are also 9 categories of demographic criteria, all of which can also be assigned quotas. These include marital status, education, ethnicity, career type and others. Researchers can even filter respondents based on mobile usage criteria and an advertising ID.
To augment all of these advanced filtering options, the Pollfish platform has recently introduced the Multiple Audiences capability, in which researchers can create one survey, with the audience requirements of multiple surveys.
This is because you can create blocks, that is, groups of specific audience requirements and quotas, with each block representing a different audience.
All this smart filtering forms agile data for researchers, so that they won’t need help at every turn, given how intuitive the filtering data system is — and that is just in the audience section.
Data Filtering in the Questionnaire Section
The questionnaire section includes multi-pronged filtering data capabilities. The filtering options span various categories so that researchers can cover all bases in their studies. This also opens up the opportunity to use just one survey per campaign.
Firstly, researchers can select the kind of question they seek to use, with 8 options of question types available (single selection, multiple selection, ranking, etc). These form the core of the survey type, in that they can take the survey in various stylistic and thematic directions.
For example, there is an option for an NPS question, the heart of the NPS survey. Or, you can use a ranking question to create the CSAT survey. The ratings stars question option allows you to create a visual ratings survey, specifically one that uses stars and so on.
After you choose the question type, there are 7 categories you can use to filter the answers. For example, you can add media to an answer, such as an MOV file, a GIF, an audio file, etc. Or you can apply logic, which routes respondents to appropriate questions based on their answer to a question of origin.
When researchers are at a stumbling block in terms of answer options, they can use the predetermined answers filtering option. This filtering data function is rich in categories, offering 46 scaled answer options. For example, researchers can use answers using a scale of disagree to agree, satisfied to dissatisfied, far exceeding expectations to falling short of expectations, the days of the week and many more.
The magnitude of filtering options will prevent any researcher-based writing block when it comes to crafting answers.
There is also a category of “none of the above,” which can be accompanied with an image. There is an “other option,” in which you can have responders specify their answer. This too can be paired with an image.
Instead of manually changing the order of answers, you can use the “shuffle answers” filtering data option. Or, you can implement “batch answers,” a function that allows you to paste all of your answers into the answer portion at once, should you decide to use them from an external document.
A smart system driven by AI, Pollfish divides the pasted content into separate answers. This allows you to avoid copy/pasting each one manually, as they are all inserted automatically.
All in all, the Pollfish system of filtering data is an advanced system of granular categories and selections, which facilitate the survey creation process, in turn providing agile data that is feasible to interpret.
Filtering Data in the Results Dashboard
Finally, and perhaps most importantly, data filtering is applied in the post-survey results in the Pollfish dashboard. There, researchers have the option of filtering data to their liking for all of their analysis needs.
When filtering data in the results dashboard, researchers have filtering options on the left panel of the page. They can sort their results by selecting their desired filters and deselecting the rest.
They can also filter by question and answer to see how respondents answered a certain question, by clicking on their desired question or answer. They also have the option to export the filtered results by clicking on “exports” and then instead of “all data” selecting “current view.”
There is also a “time range” filter on the left panel, which can also give them a grasp of the survey distribution in real-time.
Additionally, there is a post-stratification filter; this filter weighs the age and gender demographics to match the census data of the targeted region.
The results are adjusted to reflect this change. This is why the filter on each response counts differently (hence the number/ percentage discrepancy when the filter is enabled). This data is a more accurate representation of the targeted audience.
The platform also allows researchers to download various documents for analyzing post-survey data — data that has already been extracted by Pollfish. Researchers can download this data in four different kinds of report types for all kinds of analyses.
The following explains the 4 kinds of data exports available for data filtering:
- PDF: A visual document that can easily be shared with stakeholders and saved as reference docs. A Pollfish PDF is laid out similarly to a PowerPoint presentation.
- Excel Spreadsheet: Recognizable to most businesses, with a Pollfish spreadsheet export, researchers have full access to all Pollfish survey results. They can add pivot tables, graphs and get deeper insights.
- Crosstabs Report: Crosstabs are a matrix-style data visualization format and one of the most useful ways that market researchers analyze data. This kind of report allows researchers to look into individual insights and organize the data in different ways, opening different consumer insights that wouldn’t be readily available from the initial results.
- SPSS Report: SPSS is a set of software programs combined in a single package. It allows you to add your Pollfish results to various kinds of complex data analyses. It’s good at combining varied, complex data sets. Researchers use it to make connections, find correlations and graph results from various data exports at once. SPSS has several tools to analyze data for predictions and spotting patterns, increasing its use for brands and marketers looking for buying behavior trends or to vet the viability of a new product.
The Gateway to Nurturing Agile Market Research
Obtaining agile market research is never an easy task — that is, if you’re using a below-par online survey platform. There are several ways such a platform can spur agile data, such as via a mobile-first approach and with powerful SaaS integrations.
Additionally, filtering data is a critical component of nurturing agile data for market research. As one of the main elements of a market research tool, it is not universally equivalent across platforms. This function tends to differ from platform to platform, as such it is not always conducive to agile data.
On the contrary, the Pollfish filtering data system encompasses all aspects of the survey creation process. It is built as a means of providing comprehensive coverage of all categories, whether they pertain to the screening section, aka, the audience section, or the questionnaire.
It is also very intuitive, thus molding agile data by its very structure.
Frequently asked questions
How do you use data filtering in the questionnaire section?
The questionnaire section includes multi-pronged filtering data capabilities. The filtering options span various categories so that researchers can cover all bases in their studies.
How many data exports are available for data filtering?
Four main data exports are available for filtering data: PDF, Excel Spreadsheet, Crosstabs Reports, and SPSS reports.
Why is filtering important in agile data market research?
Researchers often divide their data into different categories for a more comprehensive understanding of it. Filtering this data opens up the opportunity to use one survey per campaign, which can zoom in on each category in a better way. Additionally, filtering data allows for easy organization.
How does the filtering data system work?
Clients can use an advanced filtering system post-survey results to divide it into two sections: the questionnaire and the audience. It also allows clients to divide their data into multiple categories for a complete and elaborate survey result.
How do you filter data in the results dashboard?
There are filtering options on the left panel of the page where researchers can sort the result by choosing their desired filters. For example, they can also use filters to view how respondents have answered certain questions.

Diving Into the Customer Satisfaction Score Survey (CSAT) Survey
Diving Into the Customer Satisfaction Score Survey (CSAT) Survey
The Customer Satisfaction Score (CSAT) survey is an effective tool to measure customer satisfaction. Customer satisfaction has always been the chief performance goal for businesses, as customers are the lifeblood of any business.
The need to satisfy customers is at an all-time high, as a third of customers will leave a brand they love after just one bad experience, proving that companies need satisfaction upkeep of even their loyal customers. Nearly 60% of US consumers will abandon a brand after a few bad experiences.
Businesses, therefore, need a solid strategy that prioritizes customer satisfaction. A customer satisfaction survey, the CSAT survey is one of the foremost methods of gauging this crucial concept. This article delves into the customer satisfaction score survey and all that it entails and provides.
Defining the CSAT Survey
The Customer Satisfaction Score (CSAT) survey evaluates customer satisfaction based on a specific touchpoint in their customer journey, whether that’s in a website’s navigation menu, at checkout or while using a product they’ve already purchased (post-sales).
Another key differentiating factor of the CSAT survey is that this customer satisfaction survey is based on its eponymous score. This score signifies the percentage of satisfaction that customers endure and therefore, rate some point(s) in their customer experience (CX). Higher percentages reflect higher degrees of customer satisfaction.
Understanding this score helps businesses determine how segments of their target market assess their satisfaction in relation to their business. The CSAT survey comprises more than just the question used to calculate the score. Since it is a survey, it uses follow-up questions based on the respondents' answers. These can include open-ended questions so that respondents can elaborate on their CSAT rating.
How to Calculate the CSAT Score
The CSAT score is the heart of this survey. It uses a specific formula for its calculation. Although the CSAT survey measures a specific customer experience, market researchers can use it for general customer satisfaction assessments.
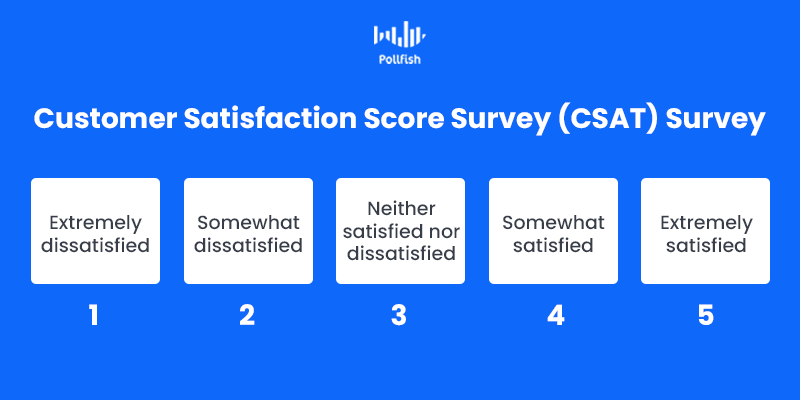
The CSAT score is measured with a Likert scale question type. The scale is between 1 and 5, in which 1 represents “highly unsatisfied” and 5 represents “highly satisfied.” 4 also represents predominantly satisfied customers.
The CSAT score is the most flexible type of customer satisfaction score, as it is not limited to the numbered scale. You can use various in-survey tools to exhibit the same sentiments as the 1-5 scale, such as emoticons, stars and other visual elements.
Here is an example of a general CSAT survey question, which responders answer with the aforesaid scale: How would you rate your overall satisfaction with our company?
Here is how you measure the CSAT score after you receive this critical variable:
CSAT= (Number of satisfied customers (4 and 5) / Number of survey responses) x 100
Round the result to the nearest whole number.
An example of the CSAT Calculation:
Number of satisfied customers (those who answered with a 4 or 5) = 32
Number of survey responses = 84
CSAT= (32/84) X 100
CSAT= 0.38 X 100
CSAT= 38%
As such, only 38% of respondents were satisfied.
How the CSAT Survey Differs from the Customer Effort Score (CES) & Other Surveys
There are several other key customer satisfaction survey types. The two other main surveys are the Customer Effort Score (CES) survey and the Net Promoter Score (NPS) survey. Additionally, researchers can experiment with other customer satisfaction surveys, like ratings scale and custom surveys.
While it measures the same business aspect of customer satisfaction, the CSAT survey differs from the other such survey types, in that it studies particular things and thus has a discrete formula.
The Key Differentiators of the CSAT Survey
The following lays out the key facets of the CSAT survey. These distinguish it from other customer satisfaction surveys.
- Measures how satisfied or dissatisfied customers are at a particular time, with a particular service, procedure, interaction, product or any single CX moment.
- Uses a Likert scale question, with a scale of 1-5.
- Has two key outcomes: the score (whether its low (1-3) or high (4-5)) and the percentage of the high scores.
- Focuses on the latter, i.e., the percentage of satisfied (high) scores.
- Should be launched after a specific occurrence in the CX, such as:
- A technical support call
- A product demo
- A purchase
- Visiting a store
- Interaction with a UI element
The Customer Effort Score (CES) Survey DIfferences
The Customer Effort Score (CES) survey studies a completely different aspect of customer satisfaction. This survey measures the ease of service experience customers undergo with a business. Thus, it asks respondents to rate the ease of using a product or service via a Matrix-like question, on a scale ranging between “very difficult” and “very easy.”
Also a Likert scale question, the scale is usually between 1 and 5, in which 1 represents very low effort and 5 represents a very high effort. This can cause some ambiguity since the scale is inverted (1= good, as it’s low-effort/easy, 5= bad, as it’s high effort/difficult). 3 represents a neutral degree of effort in doing business with a company.
The Customer Effort Score formula:
(Very easy + easy answers) — (very difficult + difficult answers) = CES
Another way to calculate the CES: (sum of all individual scores) / all the respondents = CES
Following suit to the first calculation, the lower the score, the easier and thus more satisfying the experience is.
The Net Promoter Score (NPS) Survey DIfferences
The NPS survey differs from the CSAT survey in that it measures the likelihood of a customer to recommend a product or business to others. This survey is intended to understand customers’ outlook on a business, particularly their positive CX.
This is because the NPS question doesn’t merely question customer satisfaction — it asks whether customers reached a satisfaction high enough that would spur them into advocating for the business.
Respondents answer the NPS question on a scale of 0-10. The scale is divided into 3 sections of responders based on their scores.
- Detractors: Scores 0-6, they represent the low end/ negative sentiment
- Passives: 7-8 is the mid-range; their name denotes more of a neutral sentiment
- Promoters: 9-10 represents high customer satisfaction
The Net Promoter Score formula:
(Number of Promoter Scores/Total Number of Respondents) - (Number of Detractor Scores/Total Number of Respondents) = NPS score
The Customer Satisfaction Score survey is therefore divergent in its calculation along with the aspect it measures.
The Advantages and Disadvantages of the CSAT Survey
The CSAT survey is a nimble tool for tracking and measuring customer satisfaction. But as any survey tool, it too has a few limitations. It’s key to learn both its benefits and snags when deciding whether this survey type is the right one for your market research needs. The following posits the pros and cons, so that you can weigh them against each other during your deliberation.
The Pros
- Versatile measurements: It can be used across a wide range of interactions and experiences.
- Extremely flexible formatting: The grading scale is not limited to numbers. For a simple rating, researchers can use emoticons, stars, etc.


- Specific: Brands can spot-check different components of their CX, whether it’s digital or in-store and make precise improvements.
- Provides regular, up-to-date info: This survey can regularly be deployed as a check-up on your customer satisfaction, thus providing up-to-date customer feedback.
- Positive for your brand’s perception: Customers like it when their feedback is considered. When you specifically tie their opinions to your brand, you’re positing it in a good light.
- Can build benchmark data: By administering the same type of survey from time to time, you’ll be gaining continued insight that you can compare over time, allowing you to benchmark the data over several years.
- Simplicity in design: Although the question can pertain to all kinds of CX components, it is simple and requires few follow-up questions, unless you need a deep read of customer interactions.
The Cons
- Limits with specificity: Since it zeroes in a specific touchpoint, the feedback is limited to that experience only. It doesn’t provide a wider view of the overall customer relationship.
- Can overwhelm respondents: Although a simple survey, the CSAT warrants constant check-ups for updated info and benchmarking. This can irritate repeat customers or even first-time buyers.
- Privacy concerns: Not all interactions are private. A purchase, for example, isn’t private in that customers provide their names, addresses and credit/debit card details. As such, their identities are tied to their CSAT survey responses. This can be concerning for customers that value their privacy and want to maximize it.
When to Use the CSAT Survey
The capability of being used to survey everything can mean nothing for market researchers and business owners who want to narrow down the most expedient opportunities for measuring customer satisfaction.
As such, here are some of the most opportune moments and occurrences in your customers’ CX for you to employ the CSAT survey.
- Customer support interactions
- Chatboxes, emails and all other digital communications
- On the phone
- In-store and at a support center
- Sales interactions
- In-store
- During a meeting whether it’s via Zoom or in-person
- Over the phone
- During a marketing event, tradeshow, etc.
- Customer onboarding
- Particular to SaaS companies
- Includes products/services that require training (mainly for professionals)
- Event feedback
- Digital events like webinars, company introductions, etc.
- In-person events from grand openings, to sales weeks, etc.
- Site Navigation
- Homepage
- Landing pages
- Product pages
- Banners
- Ads
- Checkout
- Search bar
- Product Satisfaction
- Newly purchased products
- Products owned for a period of time (from weeks to a year)
There is virtually no limit to testing customer satisfaction with the CSAT survey, as it can be adapted to test all customer experiences.
Taking Your Customer Satisfaction Above and Beyond
The CSAT is but one consumer survey, but it has a major takeaway: the importance of keeping your customers happy. With customer expectations at an all-time high, it is integral to provide them with experiences that raise their customer satisfaction.
In essence, customer satisfaction measures a consolidation of customer perceptions and expectations. While it is impossible to meet every expectation, achieving a good perception is doable. In order to meet this end, you need to constantly study your customers in relation to their satisfaction with your business.
Online surveys are the most effective measures in this regard, in that they catch customers in their natural environments. Regarding the CSAT score, online surveys empower it, as market researchers can place and launch surveys during various customer interactions. The more you study your customer satisfaction, the better you can perfect it.
Frequently asked questions
What is a customer satisfaction score (CSAT) survey?
Customer satisfaction is essential for any business, and therefore, it is important to measure how customers feel about the offerings. Customer satisfaction or CSAT survey is one of the foremost methods of gauging this crucial metric.
How does the customer satisfaction score work?
A Customer Satisfaction Score (CSAT) survey evaluates the customer's satisfaction based on a specific touchpoint. For example, it could be a customer's interaction with the brand's website, checkout, or experience during purchase. The score represents the percentage of satisfaction that the customer felt and adds the rating to the overall customer experience (CX).
How is a customer satisfaction score measured?
The CSAT score is evaluated on a Likert scale question. The customer is asked to rate their experience on a scale of 1 to 5. 1 signifies highly unsatisfied customers while 5 represents highly satisfied.
What is the difference between the customer effort score survey and the customer satisfaction score survey?
The Customer Effort Score (CES) surveys show how easy and comfortable customers feel while interacting with a business. On the other hand, a CSAT score is determined based on consumer feedback. It asks customers to rate their experience using a product or a service, whereas a customer satisfaction score evaluates a customer's satisfaction at a given customer touchpoint.
What are some advantages of the CSAT survey?
There are several advantages of using a CSAT survey that include versatile measurements, benchmarking data for continued insights, flexible formatting, and spot-checking different components of a CX application. These things help in deducing customers’ satisfaction at a particular touchpoint that can help boost engagement and understand customer’s preferences better.

B2B Survey Questions to Turn MQLs into Customers and Scale Your Business
B2B Survey Questions to Turn MQLs into Customers and Scale Your Business

B2B survey questions provide a powerful and versatile opportunity for marketers to optimize their efforts. Yet, the concept of using surveys to better understand prospects is often overlooked by marketers.
If you’re looking for an innovative way to glean additional information about leads in your sales funnels, a B2B survey may be the perfect solution.
Don’t let inexperience with this research methodology stop you from launching your first B2B survey. This guide from Pollfish will provide you with a variety of B2B survey questions that you start using today to enhance your marketing strategy and turn more leads into sales.
How B2B Survey Questions Improve Your Sales Funnel
B2B survey questions can serve as the ideal follow-up to prospects after they have made initial contact with your company.
When a prospect completes a form, i.e., to ask a question or gain access to gated marketing content such as an eBook, your business will be in possession of key demographic information about your prospect and, most importantly, their contact details.
At this point, your marketing campaigns are already yielding B2B engagement, so it is the perfect time to engage with the prospect.
This is an opportunity to learn more about your prospect. B2B survey questions are a viable means to engage with your prospects at several points in their CX. For example, you can survey them prior to their gaining access to a gated content asset or follow up after they’ve seen/downloaded your content.
This will gain you valuable information about their role in their company (to see whether they are responsible for conducting business or report to someone who does), their nurture needs, buyer readiness and other factors that build their business relationship with your company.
Questions to Identify MQLs
Marketing qualified leads (MQLs) are leads from marketing campaigns that are the most likely to convert; however, it is difficult to identify these leads from basic demographic data alone. B2B survey questions can provide you with the information you need to determine whether to pass the lead along to the sales team, whether they need to be nurtured further or whether they aren’t qualified MQLs. These questions will help you make that decision:
- What is your job title?
- Multiple choice: COO, Director of Operations, Manager, Sales Manager, Marketing Manager, Etc.
- Who do you report to?
- Multiple choice: Board of Directors, CTO, Director of Technology, Other.
- How large is your company?
- Multiple choice: 1 - 10, 10 - 100, 100 - 1,000, 1,000+.
- What is your purchasing authority?
- Multiple choice: I have the authority to make purchases, I can make purchases with the authority of my manager, I can influence purchasing decisions but I can’t make them.
- On a scale of 1 - 10, how likely are you to download and read a free marketing report on changes in [industry name]?
- A scaled response, with 10 being “extremely likely.”
Questions that Explore B2B Pain Points
If a lead is familiar with your company (e.g. from spending time on your website or by reading content from your organization), but still hasn’t made a purchase, it is important to understand what stands in their way.
This is the opportune time to gain information about their pain points by asking the following survey questions:
- What is the biggest challenge you face in your line of operation?
- Text entry field
- Of the following, what is your business lacking?
- Multiple-choice answers with multiple selections allowed: lead generation tool, an effective customer communication tool, better user testing capabilities, etc.
- What types of assets would help your business grow?
- Multiple-choice answer with multiple selections allowed: i, benchmark data, content on how [your product name] can improve processes, industry reports, etc.
- What are you hoping to accomplish by setting up a [enter your product/solution here]?
- Multiple-choice answer: Improve internal processes, Save money, Find efficiencies, Scale my organization.
- Text entry field
- What is holding you back from purchasing today?
- Multiple-choice answer: Cost, Unsure if features suit our needs, Ease of use, Not sure we need it.
Questions to Nurture MQLs Further Down the Sales Funnel
B2B survey questions can provide invaluable insight to your marketing team as you plan and create content to further nurture MQLs down the sales funnel.
This info can be used to personalize various marketing literature and ancillary marketing functions such as ABM campaigns, marketing events and non-textual video content., These can make the difference between your MQL going cold or moving to the next step in their journey. The following questions provide insight for further MQL nurturing :
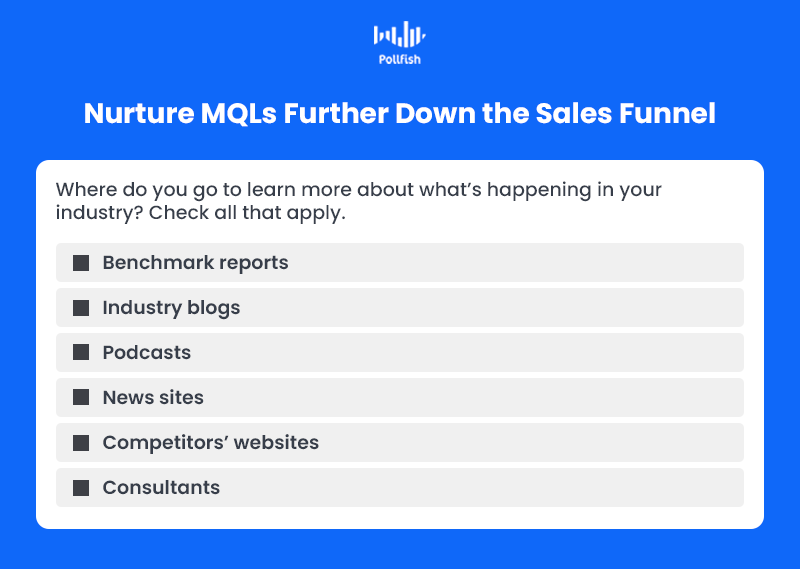
- Where do you go to learn more about what’s happening in your industry? Check all that apply.
- Multiple-choice response with the ability to select multiple answers: Industry blogs, benchmark reports, Podcasts, News sites, Competitors’ websites, consultants
- What kind of digital assets would most help your organization? Check all that apply.
- Multiple-choice response with the ability to select multiple answers: benchmark data, verticalized reports, webinars, blog posts, guides, eBooks, etc.
- Which terms do you use to search for more information about [product/service name]?
- Text entry field.
- What is your preferred communication method?
- Multiple-choice answers: phone, email, video conference
Questions about Satisfaction with an Existing B2B Relationship
Customer retention is essential to your organization’s bottom line, as loyal customers engage in prolonged business relationships, bringing a longer customer lifetime value (CLV. Once your B2B customers have chosen you as their supplier, or B2C customers have chosen you as their partner, you can use B2B survey questions to check-in with them to understand and adapt to their needs. Here are some customer satisfaction questions you should plan to ask:
- How satisfied are you with our company?
- Multiple-choice answer: Very satisfied, Satisfied, Neither, Dissatisfied, Very dissatisfied.
- On a scale of 1 - 10, how would you rate the ease of doing business with us?
- Scaled response, with 10 being “extremely easy to do business with.”
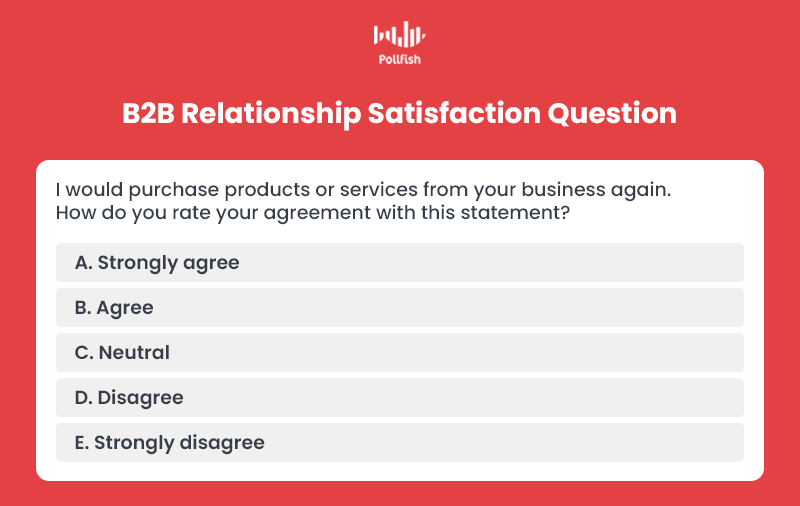
- Please rank the following state: I would purchase products or services from your business again.
- Likert scale: Strongly agree, Agree, Neutral, Disagree, Strongly disagree.
- How likely are you to recommend our organization to a friend or colleague?
- If Net Promoter Score is used, the response should be provided on a scale of 1- 10, with 10 being “highly likely to recommend.”
- A multiple-choice response can also be used: I have already or will recommend, I may recommend, I am not sure if I’ll recommend, I would not recommend.
- On a scale of 1 - 10, how well do we handle concerns when they arise?
- Scaled response, with 10 indicating “concerns are handled very well.”
- What can our company do better?
- Open text entry form.
Questions to Spur Cross-Sells and Upsells
You can continue to enhance your relationship with your B2B customers with additional offerings by encouraging cross-sells and upsells. Not only does this increase your company’s sales, but it also ensures they won’t leave you for a competitor who offers more.
- Is your organization considering additional technology purchases this year?
- Multiple-choice answer: yes, yes, but it’s not a top priority, unsure, unlikely, a definite no.
- Use skip logic to send “yes” answers to additional questions about the technology they may purchase.
- How much do you know about the following services/products that our business offers?
- Use a matrix to list out the services and products you offer. Then offer responses across the top row:, I’m interested in this, I know you offer this, but I am not interested, I did not know you offer this, I don’t need this.
- What other services would you like us to provide?
- Multiple-choice answers, with multiple selections allowed (list out features or services that your competitors offer or that you plan to develop)
- Text entry field
- If we offered X, would you consider purchasing from us?
- If asking about a single product or service, you can use a binary response.
- If asking about multiple items, use a matrix to understand the interest level in each.
B2B Success Is in the Details
We have provided you with a number of B2B survey questions that you can leverage to power your sales funnel, increase conversions, elongate contractual relationships, maintain partnerships and improve customer retention.
In order to get the information you need from prospects and existing customers, you will have to pay careful attention to your approach.
Consider the wording of early emails to your customers. Remind them about why you are reaching out: i.e., “You filled out a form on our website. We’d like to know how we can better meet your needs. Do you have 2 minutes to complete a short survey?”.
Alternatively, consider offering an incentive to get prospects to engage (e.g. discount code or free gift. However, you decide to approach this, know that the information you receive will help improve your marketing and sales processes, as well as turn those MQLs into happy customers.
Frequently asked questions
How can B2B survey questions help companies know more about their customers?
B2B Survey questions provide an opportunity for businesses to learn more about their customers. They are an effective way to engage with prospects before they gain access to your content, so you have an idea about what kind of content they're looking for.
What are marketing qualified leads (MQL)?
Marketing Qualified Leads (MQLs) are prospects from the marketing funnel with the highest likelihood of converting to sales. However, it might be challenging to identify these leads from the overall demographic data.
How can B2B survey questions help identify MQLs?
B2B survey questions can help identify leads by identifying whether the lead is secure enough to be passed along the funnel to the sales team. Moreover, they determine whether the leads need nurturing or are fit to be qualified as an MQL.
What B2B survey questions are the most important to ask for moving a lead up the sales funnel?
Ask questions that give customers the power to make suggestions for improvements. For example, ask them what the business can do to enhance their services. Offer multiple-choice questions to guide customers who might need to be pointed towards a possible answer.
How can you tailor B2B survey questions to boost customer retention?
Once you've got B2B customers in your sales funnel, understand their journey and check in with them to make sure that they remain satisfied. Ask them questions like how pleased they are with the overall service provided and if they have any suggestions for improving any service.

How SaaS Integrations Help Sustain Agile Data for Market Research
How SaaS Integrations Help Sustain Agile Data for Market Research

In today’s mobile-first digital age, market researchers would be hard-pressed not to find SaaS integrations and solutions designed to carry out market research campaigns.
Given the efficiency that SaaS brings organizations, a colossal 94% of businesses already use SaaS products. Sustaining a compound annual growth rate (CAGR) of 16.4% from 2017 to 2022, the SaaS industry is not at risk of undergoing a slowdown — on the contrary, it is slated for growth.
SaaS has also progressed into the market research space, with the prevalence of online survey tools, platforms and integrations.
While it is undoubtable that SaaS offers value to market researchers, not all SaaS solutions foster agile data.
In keeping with our stance on agile data for market research, this article explains how SaaS integrations can forge agile data, with a real use case example from one of our clients.
Defining Agile Data
Agile data refers to a variety of techniques traditionally used by IT professionals to ensure effective collaboration on the various data aspects of software systems.
As opposed to entailing a uniform approach, agile data employs several techniques and philosophies to allow for efficient and productive cooperation when dealing with software systems.
Although smooth collaboration appears to be a self-evident necessity — therefore not needing the concept of agile data — in reality, it is very difficult to achieve. This is due to the different role specializations, visions and priorities among IT and data professionals.
Thus, agile data is a crucial concept to incorporate into software systems so that teams have a stronger means of working collaboratively and quicker speed to insights.
The same notion applies to agile data in market research, given that it too relies on SaaS and copious amounts of data.
The Need for Agile Data in Market Research
Market research requires agile data solutions in order to keep up with business needs. This entails access to accurate data on target populations through efficient means.
In market research, such a population is often the target market, the group of consumers most likely to buy from a business and are thus the target of various business endeavors such as advertising, user testing, etc.
Businesses pour so many investments into their target market, thus, the stakes are much higher than a traditional research project, as there is a heightened requisite to acquire an ROI. Thus, the data that market researchers extract must be above par.
But agile data in market research does not merely represent the results that a market research campaign has yielded. Rather, it requires the means of extracting the data in the first place to be agile as well.
As such, SaaS solutions in market research must offer agile data aggregation and agile interfaces. Most market research SaaS exists in the form of an online survey platform, given that effective survey studies provide a vast array of insights for market research projects.
But not all of these survey platforms are optimized for agile data. There are several ways for a survey platform to provide agile solutions. The first was via the aforementioned mobile-first approach (link above).
You can also gain agile data through the use of SaaS integrations. That way, you are not limited to relying on a survey platform on its own.
How SaaS Integrations Build and Strengthen Agile Data
SaaS integrations buttress various business endeavors, including those of market research. This is because using SaaS integrations with a main solution or even in tandem with smaller solutions, strengthens your market research campaigns with an ecosystem instead of a lone wolf market research platform.
The addition of integrating your existing SaaS solutions in your market research certainly has its advantages. SaaS products are built to cultivate agile data and provide other advantages as add-ons to your main SaaS provider.

In order for an online survey tool to gain agile data, its SaaS integrations must advance the key efficiencies found within agile data. These include:
- Easing collaborations
- Enhancing the features of your online survey platform or other market research SaaS
- Using only the aspects of each software that you only need due to the presence of more than one SaaS
- Identifying course changes more quickly, and holding market research directly accountable for business results.
- Organizing data for practical survey data analysis
- Accessing information sooner
- Improving the quality of data
- Garnering further insights delivered at speed
SaaS Integrations Use Case with a Pollfish Client
There is a vast amount of available SaaS integrations for market research products, even if they are not all built the same and do not offer the same functionalities.
In order to generate agile data, market researchers, business owners and marketers need to employ the correct SaaS integrations, particularly those that help researchers gain the benefits laid out in the prior section.
To prove that SaaS integrations can build agile data for market research, the below explains how a Pollfish customer was able to do just that: use a SaaS integration to sustain agile data for their market research needs.
One of our clients in our vast clientele pool is an audio streaming and media services provider.
The audio streaming provider has multiple accounts on the Pollfish platform, including a main account, which runs surveys across the world, in over 15 countries. The main account is used for various market research needs, which include:
- creative testing
- ad testing
- push notification concepts
With 9 users on the account and various survey campaigns in the works, the streaming provider is in constant need of agile data. There is little room for error in the main account of such a major enterprise; it therefore has the necessities that only agile data can provide.
These exigencies include:
- speedy insights
- ease of collaborations
- enhanced data organization and displays
- quality data
- a smooth integration
The audio streaming client was able to fulfill these needs through an integration with BigQuery on the Pollfish platform. BigQuery is a serverless warehouse on which the client was able to build a massive dashboard.
This SaaS integration allowed the client to store, segment and view the data that it extracted from Pollfish in their BigQuery dashboard. It enabled the client to route all the Pollfish data into the BigQuery database in real-time. This includes survey demographics, respondent profiles and the questionnaire content itself.
Pollfish was able to provide agile data through its platform’s capabilities, along with the friction-free integration with BigQuery, which allowed the media client to view and segment their Pollfish data.
Additionally, the client was able to keep track of several performance metrics, receive translated responses from Pollfish and was able to benchmark their metrics on a rolling basis.
All in all, the media client was able to quickly and efficiently make use of their data via a SaaS integration on the Pollfish platform.
Striving for Agile Data in Market Research
The agile data (AD) concept is a method involving various strategies for IT professionals to implement in software systems. Used in different situations, agile data is used to improve collaborations and other kinds of productivity, while avoiding snafus.
Agile data is a must in market research and other data-heavy industries — and most industries must rely on consumer data in order to build customer loyalty and remain competitive. Thus, numerous sectors can stand to use agile data solutions.
In market research, the key is to choose an online survey platform that can provide agile data — in a proven way. SaaS integrations are one of the ways in which such a platform can remain agile, that is, if the integration itself and the integrated platform permit agility.
Frequently asked questions
How can agile data make market research easy?
Agile data improves collaboration between data sets and surveys and makes collecting information more efficient and productive. Therefore, it is vital to choose an online survey platform that provides agile data for market research. One such way is using SaaS integrations.
Why is agile data market research important for industries?
Agile data is a must in market research and other data-heavy industries since all industries require consumer data to build customer loyalty and remain competitive. Furthermore, agile data makes it easy for industries to collect data from different platforms, increasing collaboration. This also eliminates repetition and any chance of errors. Thus, numerous sectors stand to use agile data solutions.
What key efficiencies should Saas Integrations have to strengthen agile data?
A few ways that SaaS Integrations can make the collection of agile data easy are by enhancing online survey platforms and easing collaborations between data sets and survey platforms. It can also organize data quickly for practical survey results and analyze business results directly through market research surveys.
How can Pollfish's SaaS Integrations help clients with their data?
SaaS Integrations allow clients to store, segment, and view all their survey data stored in the BigQuery dashboard in real-time. The dashboard includes respondent profiles, survey demographics, and the questionnaire content itself.
What is agile data?
Agile data is a data collection technique used by IT professionals to ensure coherency between various data aspects of software systems.

How to Increase Your Survey Completion Rate
How to Increase Your Survey Completion Rate

The survey completion rate is a key metric in determining the success of your overall survey campaign.
A prudent market researcher will check the status of their surveys, as a means of creating effective survey studies for their market research campaigns. Checking your survey status requires looking into more than just the amount completed.
Instead, you should take your survey completion rate into consideration.
This article explains this metric, how it differs from the survey response rate and how to increase it so you can quickly gain all the necessary responses from your target population.
Defining the Survey Completion Rate
The survey completion rate, as its name implies, measures the rate at which your surveys are filled out and submitted by your intended responders. It is expressed as a percentage.
Specifically, it alludes to the number of surveys completed in relation to the number of surveys your respondents started.
This means that the entirety of your targeted sampling pool isn’t a part of the survey completion rate, only the respondents who have entered and interacted with your survey count towards this rate.
As such, the more respondents that complete their survey out of those who began one, the higher your completion rate will be.
A low survey completion rate is a consequence of survey attrition, specifically dropout attrition.

How Survey Completion Rate Differs from Survey Response Rate
The survey completion rate is often conflated with or used interchangeably with the survey response rate. Although they delve into similar territory, that of completed surveys, there is a notable factor that differentiates the two.
Like the survey completion rate, the survey response rate measures survey completions. However, it refers to the amount of respondents who completed a survey in relation to the total sampling pool, i.e., all those who received the survey, or were prompted to take part in one — not just those who started one.
A low survey response rate is also a consequence of survey attrition, but that of nonresponse attrition.
The calculation for the survey response rate is as follows:
# of completed surveys / number of sent surveys (via email, survey software, CRM, etc.) X 100
An example of the calculation:
Surveys sent: 500
Number of respondents who entered the survey: 240
Number of completed surveys: 229
Response rate = 229 / 500 = 0.458
0.458 x 100 = 45.8%
The survey response rate in this scenario = 45.8%
How to Calculate the Survey Completion Rate
The calculation for the survey completion rate mirrors that of the survey response rate, save for the differing variable. In this case, you aren’t dividing the total number of completed surveys by all those in the sampling pool, i.e., by the amount of sent surveys.
Instead, you must divide the total complete surveys by the number of surveys your respondents started. Below is the formula.
The calculation for the survey completion rate is as follows:
# of completed surveys / number of respondents who entered the survey X 100
An example of the calculation:
Surveys sent: 700
Number of respondents who entered the survey: 380
Number of completed surveys: 300
Response rate = 300 / 380 = 0.78947
0.78947 x 100 = 78.95%
The survey completion rate in this scenario = 78.95%
Why a Low Survey Completion Response is Disadvantageous for Your Research
As you can see from the differences in the calculations, it is critical to achieve a high survey completion rate.
When your survey response rate is relatively low, it is understandable in that you are comparing the completed surveys in relation to the entire sampling pool, whereas in the survey completion rate, the completes are in relation only to those who already began taking your survey.
Thus, a low survey completion rate points to dual survey attrition: both nonresponse and dropout attrition. This is because respondents with nonresponse attrition are always present, despite not being taken into account in the survey completion rate calculation.
A low survey completion rate compounds this in that nonresponse attrition is already present, yet exacerbated as those who have already started the survey declined to finish it.
Here are some of the other disadvantages and consequences of a low survey completion rate:
- A poor survey experience
- Distaste with your brand (especially if the survey mentions it, whether directly or indirectly)
- The wasted opportunity of understanding key members of your target market/ population.
- Wasted survey deployment (whether it's via email or an online survey tool)
- Longer times to reach your target amount of survey completes.
- DIfficulty in receiving responses from all your audiences (some survey tools allow you to enter multiple audiences per tool).
- Incomplete data (especially if you use any method other than an online survey tool.
Methods to Increase Your Survey Completion Rate

A low completion rate can be unsettling for many market or general researchers. Fortunately, there are certain best practices that can increase your survey completion rate. These pertain specifically to the survey-taking experience, as the completion rate is contingent on the survey itself.
Here are a few critical methods that improve your in-survey experience.
- Keep your survey short, on-topic and relevant to your target market. You can go so far as to create multiple surveys that befit your different market segments.
- Mention the point of the survey and highlight its benefits. Some respondents will be much more willing to finish a survey if they know its purpose. This will motivate them, especially if it is designed for some sort of greater good, whether it’s societal or concerned with the respondents’ own CX. Even if this won’t be a motivating factor, no one will want to finish a survey if they feel it is useless or done in vain from not knowing its basis.
- Don’t create questions that are difficult to answer. For example, if you need to better understand your CX, conduct a customer experience survey and ask questions about a specific experience in a customer journey. Or get even more granular with a survey based on specific aspects of one experience. In short, simplify questions.
- Assure you don’t offend anyone of your sampling pool members. Although most surveys are anonymous, all cultures aren’t the same. The same goes with demographics; some won’t feel comfortable answering certain questions that may be based on topics sensitive to them. If respondents don’t leave a survey, this may cause them to partake in survey bias at the very least.
- Only ask the questions you need — conduct secondary research. In keeping with the first piece of advice of maintaining relevance, avoid unnecessary questions. These will easily bore or irritate your respondents. That means you should only ask the most pressing questions, the answers of which you won’t find elsewhere. As a good market research rule of thumb, begin your research via secondary research. This will assure you steer clear of unneeded questions, unloading your question output.
- Test your survey among your team. There’s no better way at getting a feel of your survey experience than by taking the survey yourself — or having someone at your team test it out. Your team members can give you some of the quickest feedback that is both honest and actionable. Other ways to test your survey are via A/B tests; this is the most optimal method of testing variations of your survey and their corresponding performance.
- Create engaging elements. Boredom is a survey killer; keep respondents engaged with visually stimulating elements. This can include adding a few visual-ratings questions, questions with media files and those with various formats, ex: mixing Matrix questions with basic multiple-choice questions.
Elevating Your Research with a Healthy Completion Rate
Researchers ought to bear in mind that a healthy survey completion rate will vary between survey campaigns and the surveys themselves. With that said, you should aim for a high completion rate, as this is indicative of a well-built survey, meaning it will play a role in increasing the overall response rate.
The larger your completion rate, the larger your completed sampling pool is. A larger sampling pool signifies a greater representation of your study’s target population. Thus, it provides for a more accurate data set.
The best way to take control of your survey completion rate is to implement a strong online survey tool. Such a tool will deploy surveys across networks, iterating repeatedly until all your survey quotes are filled. As such, you won’t have to worry about this metric as much as those using another survey distribution method, such as via email. Nonetheless, a strong survey platform should allow you to keep track of your survey completion tool, as it shows you how well you’ve designed your survey.
Frequently asked questions
Why is the survey completion rate important to know?
The survey completion rate is the rate at which surveys are filled out. It refers to the number of surveys filled out and completed by respondents in the total sampling pool. It is expressed as a percentage and shows the relationship and enthusiasm of your customers.
Will a low survey completion rate be harmful to my business?
A low survey completion rate shows dissatisfaction of your customers towards your business. It also reflects a poor survey of customer experience like experiencing technical glitches. This is why it is important to use an automated market research platform for building surveys.
What is a good completion rate for a survey?
A 50% or more survey completion rate is considered an excellent response rate and is usually driven by increased motivation and a better customer/business relationship.
How does an online survey tool help in boosting the survey completion rate?
An online tool enables businesses to distribute the surveys to different networks where it sends them repeatedly to ensure that all the questions are answered. This, in turn, increases the survey completion rate.
How can I increase my survey completion rate?
Create simple, easy-to-understand questions. Most importantly, keep the survey short and relevant to the topic. Mention the point of the survey and highlight the benefits, so that respondents know its purpose. Avoid including questions that are likely to offend anyone. Only ask the questions that you cannot extract from secondary information or research. Finally, check the effectiveness of your survey by testing it on your team members.

Using Automated Surveys to Attain Business Goals
Using Automated Surveys to Attain Business Goals

Automated surveys are leading the charge on catering to a business’s target market; consequently, they make up the building blocks of a business. While this may seem like a long shot, it is the case for a number of reasons.
Firstly, customers of the present are more demanding than ever, as 76% of customers expect businesses to know about their needs. Automated surveys are the most apt tools to deliver on this front, given that the raison d'etre of automated surveys is extracting key insights about customers as a means to better serve them.
As such, these tools are the most equipped to understand customers as precisely as possible and thus help businesses in fulfilling their needs.
Moreover, companies in the U.S. lose over $62 billion annually due to poor customer service. Automated surveys function as preventative efforts against losing money. This is because they help gather key insights on your target market, allowing you to test your own marketing efforts.
This article explains automated surveys and their various formats, along with how they help attain business goals.
Defining Automated Surveys

Automated surveys are surveys designed for the modern age. As their name hints at, these surveys are conducted via automation — the application of technology that performs tasks that humans otherwise would, in an effort to minimize human labor while achieving the same outcomes.
This new form of surveys has rung in the era of automated surveying, the practice explained above. In doing so, automated surveying has brought about new auxiliary tasks, which have led to many improvements in different areas.
These improvements hinge on the capabilities unique to automated surveying and have allowed marketers to gain insights for different areas of business.
The Capabilities of Automated Surveys
Automated surveys can be used for a variety of campaigns and macro-applications. They also carry out specific uses, such as avoiding customer churn rate, etc. Here are a few more key purposes and ends that these surveys can help you attain in your research endeavors.
- Marketing: Marketing market research surveys can be used to study a wide variety of behaviors and opinions, as they relate to marketing. These surveys automate processes that deal with learning about competitors, campaign effectiveness and customer base.
- Branding: These surveys help you conduct branding market research, i.e., surveys that test brand awareness, design, logos and other associations of a brand.
- Advertising: You can automate surveys for advertising market research, which involve high-level campaigns, concepts and individual ads.
- Market segmentation: These surveys allow you to conduct market segmentation, which allow you to learn the subgroups of your target market. This is ideal for more advanced targeting, as not all members of your target market share similar interests, behaviors and other categorizations.
- Competitor intelligence research: These surveys gather data on competitors, both direct and comparable, so that your business can find market opportunities, product ideas, costs and other competitor aspects for comparison. This shows you businesses how they stack up against your business contenders. From this intelligence, businesses can make key decisions on how to differentiate themselves from competitors and offer better customer experience (CX).
- Customer loyalty: This is a key differentiating factor in the success of any business, as loyal customers will make repeated purchases and engage in other positive behaviors, such as leaving positive online reviews and engaging with your social channels. The customer loyalty survey can be conducted in a number of formats and styles.

- Obtaining quality answers: This is also referred to as avoiding survey fraud. There are various ways your surveys can receive poor answers — the kind that are inaccurate, rushed or spell out gibberish, as nefarious respondents do not care about providing honest, quality answers. Respondents can also simply be too bored or exhausted to partake honestly. Automated surveys can bypass low-quality responses by way of technical checks.
The Pros and Cons of Automated Surveys
Automated surveys help simplify various difficulties; by easing tasks for businesses, they can reach their goals that much quicker and less laboriously. But like any form of automation, they too can fall prey to a few snags. Here are a few of the key advantages and drawbacks that automated surveys present:
The Pros
- Discovering key unknown facts: Automated surveys can amass a wide swath of insights, allowing you to come across facts that were otherwise unknown, such as certain customer preferences, needs, distastes and even personas.
- Reduction of labor: By their very nature, automated surveys were designed to cut back on human input, making certain business campaigns less labor-intensive. They especially curb difficult manual tasks such as finding qualified respondents and typical manual tasks such as sending the surveys out to the correct respondents.
- AI-powered: Artificial intelligence is arguably the strongest force of automation in that it learns human behaviors as it automates. As such, it mimics human intelligence so that surveying takes key actions (preventing disqualified demographics and answers, instituting quality checks, etc.)
- Quickening the research process: Market research can be a lengthy process, as it involves turning to both primary and secondary sources of information. These surveys are known for ramping up speed, allowing you to breeze through the survey and larger market research process.
- Identifying key business strengths and pitfalls: These surveys allow you to dive deep into the perceptions surrounding your business along with its various campaigns and communications. This gives you insight into how your business excels in the eyes of your target market, along with the areas for improvement.
- Keeps boring and technically challenging tasks at bay: These surveys automate a series of tasks and subtasks that are not only laborious, but dull as well. Certain key tasks to the survey experience, such routing respondents to particular questions based on their previous answers is virtually impossible to do manually. It would take too long and require technical knowledge.
- Accruing real-time responses. As these surveys accrue responses, you can view them in real-time, allowing you to analyze, report and understand how much more time your study will need and the rate at which you get responses.
The Cons
- Parked answers: This refers to respondents who begin a survey at a particular time, yet “park it,” i.e., leave it inactive, until a later time that they wish to complete it. This can create biases, in that certain events that occurred in the interim can sway respondents’ answers.
- Additionally, it slows down the survey process, regardless of its real-time results.
- Lengthy surveys: Automated surveys typically allow researchers to take the DIY approach. As such, many researchers create surveys on the longer end of the spectrum. This may be detrimental to your survey response rate and campaign at large if you don’t provide incentives.
- Sometimes, even in the case of incentives, long surveys lead to boredom, disinterest and therefore, biases.
- Misinformation: Even a well-built survey can be susceptible to misinformation. While a strong survey platform can weed out biased answers, some can still fall through the cracks. For example, a respondent may provide an open-ended answer that is not thought out and presents a half-truth just to finish the survey.
When Automation Powers Market Research
Automated surveys provide recourse in the overarching campaign known as market research. Although there are still many types of research you’ll need to conduct manually, such as rifling through secondary sources, organizing focus groups and the like, automated surveys remove a major weight from researchers’ shoulders.
This is because, aside from the macro applications and main purposes that automated surveying helps businesses fulfill, there are a myriad of other capabilities they can perform.
Their edge lies in their capacity of automation, a relatively new concept. This makes automated surveys far easier to conduct than phone, email and CRM-based surveys.
Frequently asked questions
What are automated surveys?
As the name suggests, surveys that are conducted by using automation are known as automated surveys. They reduce human labor while offering the same outcomes that have led to many improvements in different areas.
What can you use automated surveys for?
Automated surveys can be used for a range of campaigns, such as preventing customer churn. Not only this, automated surveys are used in different fields including marketing where it analyzes the behavior and opinions of people. Other fields include branding, market segmentation, advertising, customer loyalty, and competitor intelligence research.
What are the pros and cons of automated surveys?
When it comes to the pros of automated surveys, they help businesses differentiate between their strengths and pitfalls, reduce manual labor, quicken the research process, collect real-time responses, and enable businesses to discover previously unknown facts, such as customer preferences. Not only this, these AI-powered automated surveys enable businesses to study human behavior in real-time. The cons of automated surveys include parked surveys left inactive by the respondents, lengthy surveys, and misinformation, for instance, open-ended answers that present a half-truth response to a question.
Why are automated surveys better than manually designed ones?
Automated surveys are better than manually designed ones as they are easier to conduct than phone, email, or CRM-based surveys when it comes to market research. They also offer researchers an edge as they minimize the burdens associated with manually designed surveys. Automated surveys achieve this by performing several capabilities in addition to macro applications.
What are the capabilities of automated surveys?
Automated surveys can be used in marketing to automate processes that deal with competitor research or studying the customer base. In branding, automated surveys test brand awareness, logos, and their link with a brand. They are also used in advertising, marketing segmentation, and competitor intelligence research to advertise market research, learn the subgroups of a brand’s target market, and gather data on competitors, respectively. Other than this, the capabilities of automated surveys include assessing customer loyalty towards a brand and preventing survey frauds.

Understanding the Data in Multiple Selection Questions
Understanding the Data in Multiple Selection Questions

Several market research campaigns and survey types will require using multiple-selection questions — questions in which respondents have the option to select more than one answer.
In opposition to single-selection questions, multiple-selection questions allow researchers to gain a more granular understanding of their target market.
They are often generated via advanced skip logic, that is, the automatic function that routes respondents to different questions based on their answer(s) to a previous question. They may also be used as the original questions on which skip logic is based.
In the Pollfish platform, multiple-selection questions yield various data in the form of percentages. This article explains the meaning behind the different data and how to navigate them with ease.
The Utility of Using Multiple-Selection Questions
There are a number of reasons as to why you should create multiple-selection questions. First off, they provide more precise answers. This is especially important when respondents cannot settle upon one answer, as multiple answers may apply to them.
Secondly, using multiple-selection questions help you thwart the Survey Scope Error. This error arises when researchers omit certain things from questions that would fully address the issue surrounding a topic. Multiple-selection questions help evade this error, as you are able to cover as many possible answers as possible in solely one question.
Moreover, multiple-selection questions help researchers clamp down on other survey biases, such as Demand Characteristic Bias. As its name suggests, this bias takes hold during the presence of a demand characteristic. Denoting an unintentional cue in the survey that influences respondents' answers, this bias can occur if a researcher gives away the purpose of the survey study.
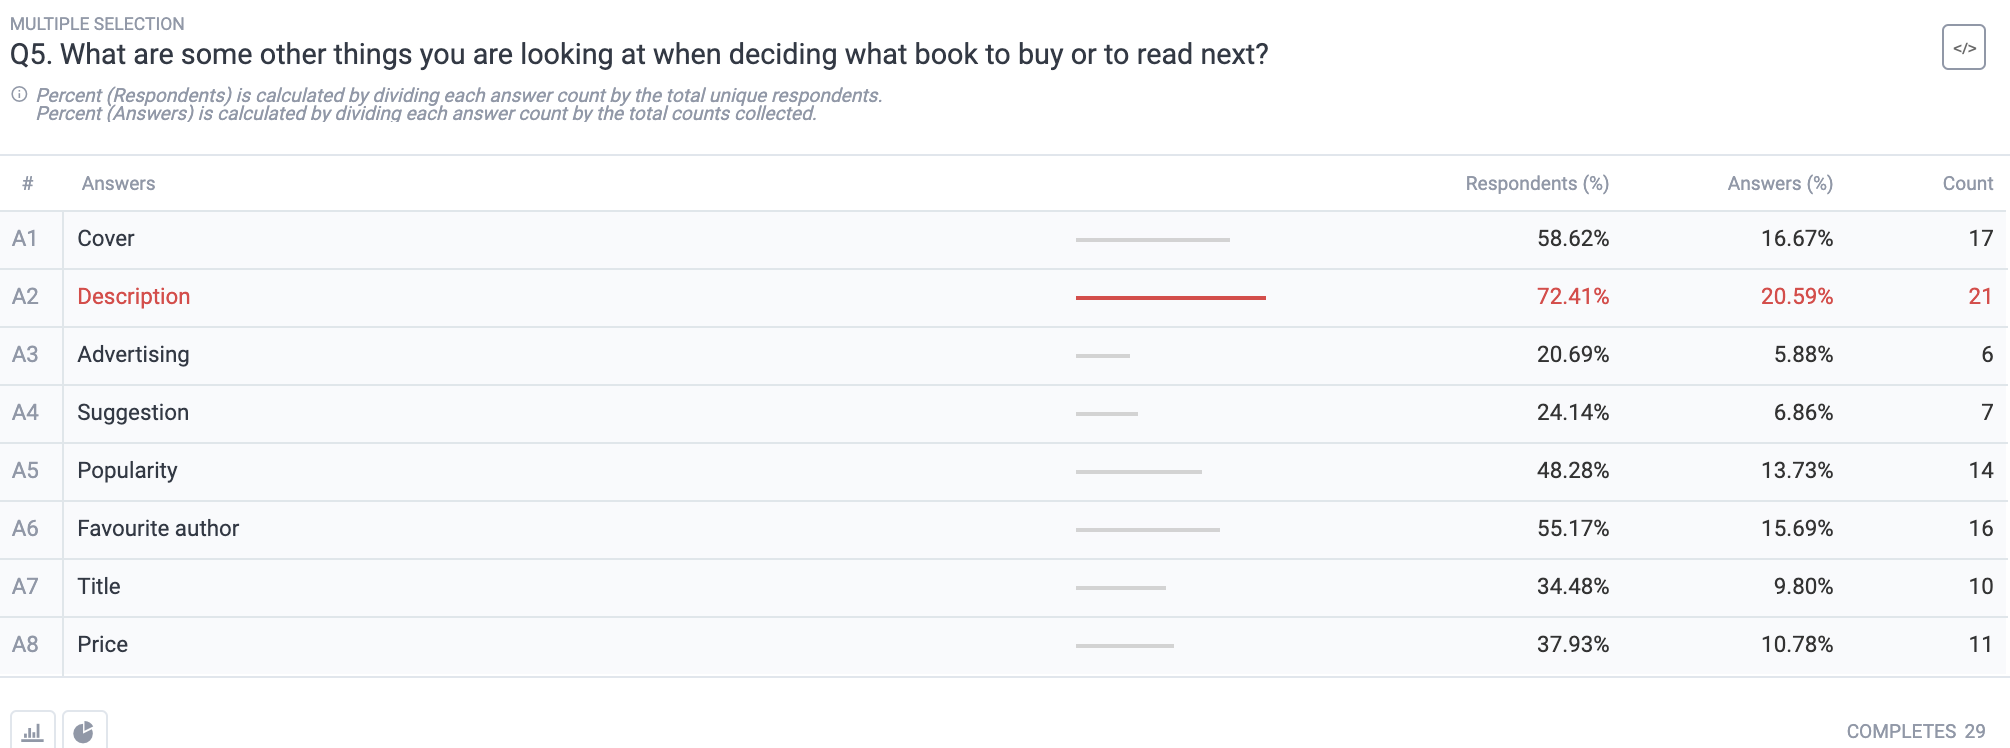 Multiple-selection questions stamp out this bias, as providing various answers helps keep the purpose of the survey latent. In other words, it drowns out the obvious. Thus, respondents won’t be inclined to give false answers to produce specific results, ie., those that will benefit them somehow.
For example, in a community survey, respondents may change their answers if they discover the purpose of the survey is to allot benefits to community members. The same idea applies to all other verticals and survey types.
Lastly, multiple-selection questions provide an overall better experience on the researcher side and the end-user side. This is because these questions allow respondents to better express themselves, coupled with gaining more concrete insights to researchers and businesses.
They also remove the need to ask multiple questions about the same topic and can incorporate a choice for an open-ended answer by using the choice designating “other”.
The Different Data in Multiple-Selection Questions
Since these questions deal with multiple answers as opposed to just one, they offer more than one point of data about every such question. In the dashboard, you’ll see two metrics in the results of a survey with these question types.
These can be confusing since they deal with multiple answers; some respondents may choose only one, while some may choose two or even all of the selections.
We’ve laid out the meanings of each metric to avoid any confusion. But first, you ought to understand the meaning behind “count,” which is used to calculate the other data.
Count
The count refers to the number of times that one answer was selected. It would need to be selected at least once to be considered.
For example, if the count is 51, that means an answer was selected 51 times.
Percent of Respondents
This piece of data is calculated by dividing each answer count by the total amount of unique respondents. Then, to get the percentage, the quotient is multiplied by 100.
For example, if the count is 51 and the total number of unique respondents is 82, the calculation is as follows:
51/82 = 0.6219
0.6219 x 100 = 62.19
% of Respondents: 62.2%
Percent of Answers
This percentage refers to a calculation centered on counts. It is calculated by dividing each answer count by the total counts collected per question. This variable is not readily visible. This is because it involves adding all the counts per question.
As such, this is typically where researchers stumble upon difficulty, as adding each count together gives you a number far higher than the number of respondents participating.
But, this is the nature of multiple selection questions: the fact that each respondent can select more than one answer, the total count of answers will be much higher than the number of respondents.
After you work out the quotient from the preliminary calculation (above), you multiply it by 100 to get the percentage.
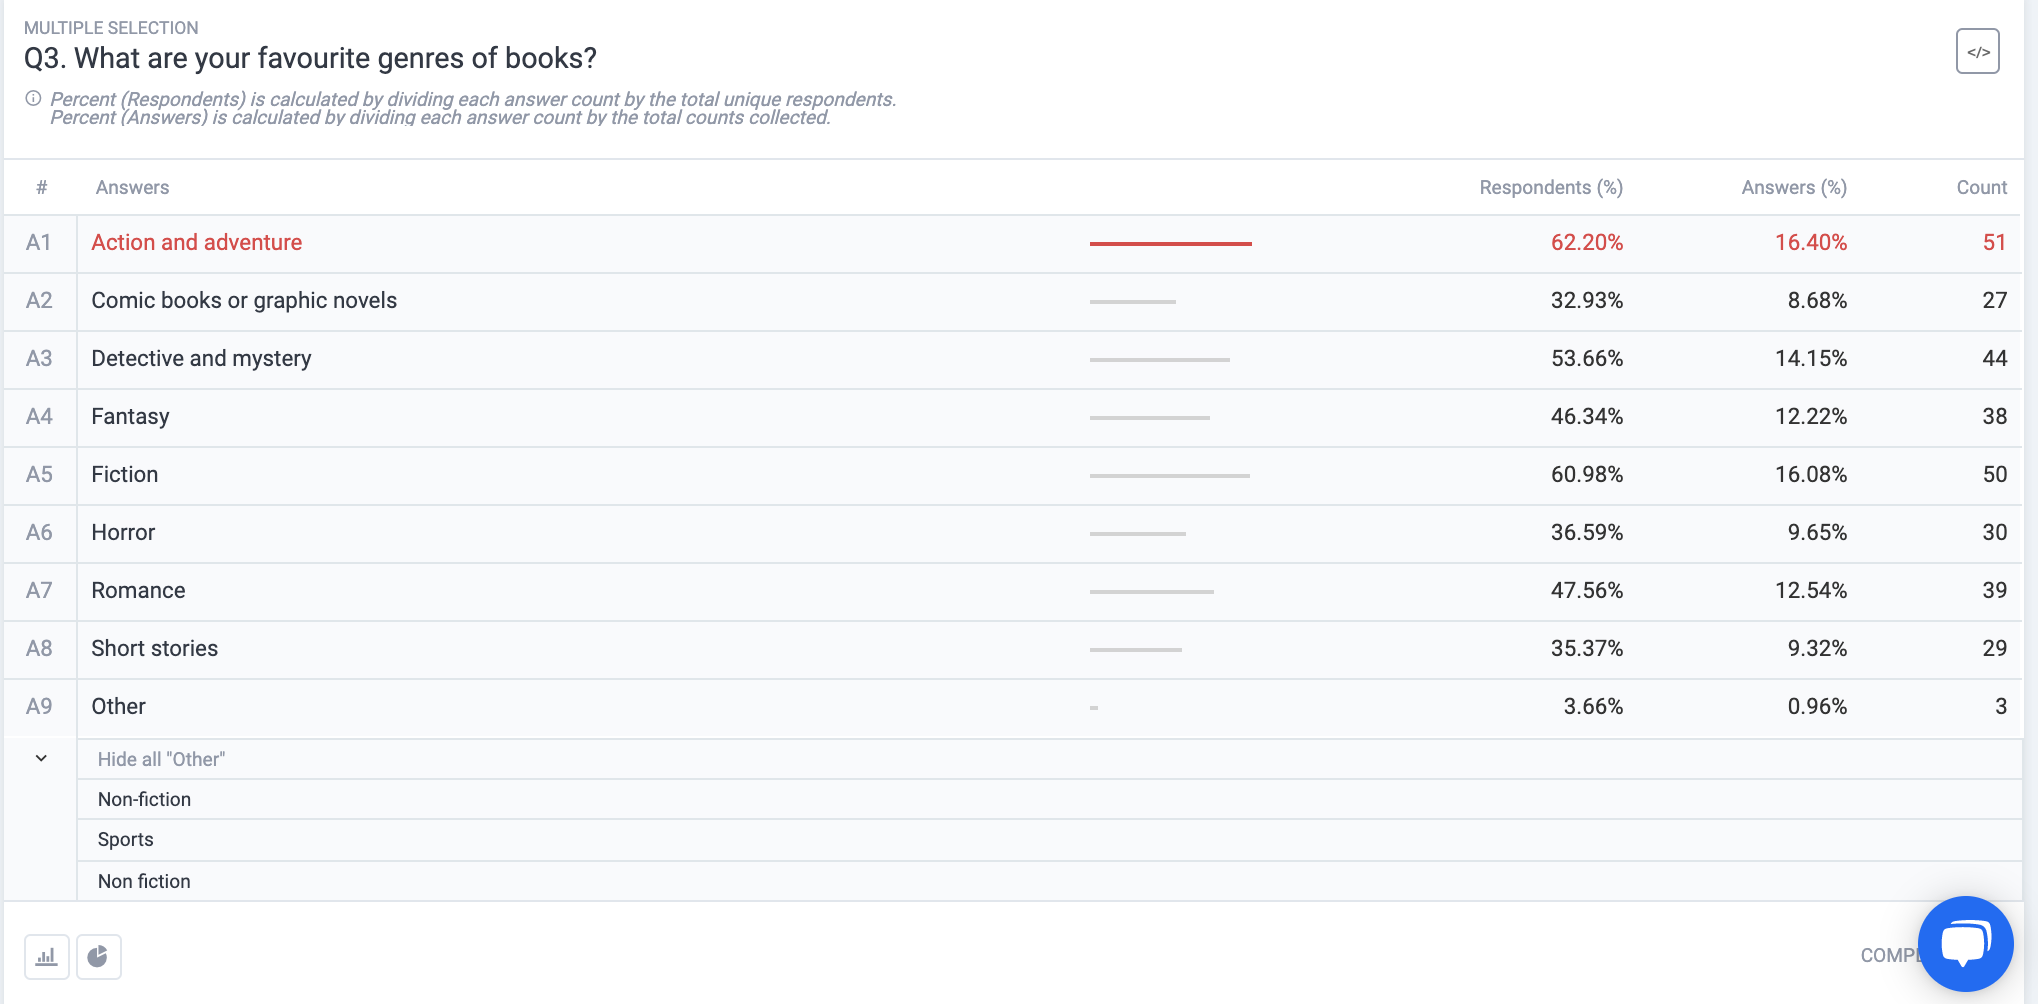 For example:
Number of counts of one answer = 51
Number of answers in the question = 9
Add the count of EACH of the 9 answers:
51 + 27 + 44 +38 + 50 +30 + 39 +29 +3 = 311
311 = total counts per questions
51/311 = 0.1639
0.1639 x 100 = 16.4%
% of Answers: 16.4%
Making the Most out of Multiple-Selection Questions
Multiple-selection questions can be more difficult to navigate, given that there are more answers to parse.
As such, understanding the metrics illustrated above will empower you to understand the overall sentiment around your answers. They are also critical when you conduct survey data analysis, as more points of data serve as key findings in your survey campaign.
These bits of data help you understand your respondents’ answers in a more quantitative way, which you can use for further analysis, such as follow-up emails in your current campaign.
When you comprehend these metrics, it will be far easier to make sense of the multiple answers you receive. So go ahead and use multiple-selection questions. They render a deeper read of your target market and allow you to explore more concepts while using less real estate in your survey (meaning fewer questions).
This makes the questionnaire adept for a mobile-first survey design.

How to Conduct a Survey in 5 Easy Steps
How to Conduct a Survey in 5 Easy Steps

If you need to conduct a survey for market research or any other kind of research, there are certain steps you should adhere to. Complying with these steps will ensure you form effective survey studies.
Surveys are powerful tools for extracting virtually any kind of information. Whether you need to examine the behaviors of a particular population, perform market segmentation, find correlations between variables or discover attitudes towards your own brand, survey research makes it possible.
This article instructs marketers, researchers and business owners on how to conduct a survey that brings value to your research endeavors in 5 steps.
What Constitutes a Useful Survey
A survey must be business-savvy if you need primary research for a business, medically apt for medically-oriented research, socially-inclined for a social science study and so on. As such, each type of survey is unique to its study, macro application and specific type of survey research.
This is because surveys should never be used as lone tools. They work best when connected to a larger campaign. Thus, before you embark on survey research, you should consider what it is you need to study.
If your research is specific to a vertical, you will need to conduct other research, such as secondary research before turning to surveys. Only then can you decide which gaps you need to fill.
A useful survey fulfills a certain purpose; for some, it can be finding a correlation between a variable and a phenomenon, for which you would need to conduct descriptive research. Another research effort may require statistically valid information, for which you would need to conduct quantitative studies and a longitudinal survey.
All in all, a valuable survey is a survey generated through methodical means, as survey research involves a process.
How to Conduct a Survey
Since conducting a survey is contingent on a methodology, researchers ought to understand how a general survey campaign must be conducted. The following explains how to run a survey campaign in five simple steps.
Step 1: Determine the Higher Levels of Your Survey Campaign
Even if you have a target population you’d like to study, start from the top of your campaign. As aforementioned, you’ll need to attach your survey to a larger campaign, or macro application.
For example, if you require a survey for market research, decide which subsector your study fits under. For example, it may belong to digital marketing, advertising, branding, PR, or competitive research — in the overarching campaign of market research. If you would like to study a social phenomenon, find a category under the social sciences into which the survey fits into.
Step 2: Filter Your High-Level Campaign Further By Considering General Inquiries
After attaching your survey to a larger campaign, group your campaign further by considering your general themes and inquiries. Identifying them will help you filter your specific survey beyond the macro and higher-up levels.
You’ll need to find the correct type of survey research and survey method to dictate your survey study. Regarding the former, you’ll need to determine if your survey requires descriptive, exploratory or causal research.
As for the latter, which has a greater focus on the length of a survey and its respondents, you can group your survey into retrospective, cross-sectional, longitudinal and prospective studies.
Since the latter methods involve frequency of deployment, you can better understand whether you’ll need to conduct one or several surveys for your study. Since surveys are best kept short for more responses and quicker data collection, your study will likely need more than one survey.
This is especially true if you opt for retrospective or longitudinal surveys, which can last for weeks to years.
Additionally, the length of your study will also give you an understanding of how many questions you’ll need and how to thematically divide your survey.
Step 3: Create a Specific Campaign and Generate Questions
Now that you’ve found the type of survey research to undertake and tied it to a method, you’ll need to go back to step one (so to speak).
From the general inquiries you’ve put together in step two, attach them to a specific campaign under your macro application. For example, say you’re conducting market research and require a study on advertising. You’ll need to attach your survey to an existing campaign under your advertising department or create a new campaign within it.
In this case, consider your advertising needs and general inquiries. Do they revolve around a new ad campaign? Specifically, what exactly do you need to research? Perhaps you would like to learn how your target market responds to different messaging, imagery and promotions. If so, create a campaign centered on it.
Once you’ve chosen or formed a specific campaign within a higher-level campaign (in this case, advertising), take your general inquiries and use them to form specific questions.
Step 4: Put Together Your Screener and Questionnaire
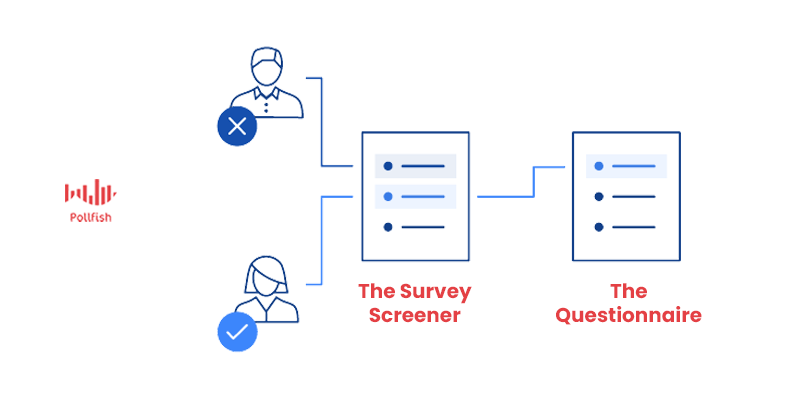
Step 4 revolves around the survey itself, which requires a dual approach: forming the screener (the screening questions and demographic quotas) and the questions themselves, i.e., the questionnaire.
You may need to conduct secondary research to understand the kind of people who constitute your target market or target population. Or you can conduct market segmentation to learn about the specific segments of your target market, as mentioned in the introduction.
Once you know exactly who to target the survey to, input them into the screener section via demographics, geolocation and other audience criteria. Add screening questions for a more precise targeting. With these questions, you can permit respondents with specific answers to take part in your survey as well as prohibit certain ones based on their answers.
For the question portion, add the questions you’ve come up with in Step 3. As you input them into the online survey tool of your choice, consider how you can make them better. Some questions will warrant an “other option,” while others will require a follow-up question (but only to certain answers.”
Example: “Which of the following brands have you heard of?” (A multiple-choice, multiple selection question)
If the respondent chooses one (or more) of the answers you provide, they should be routed to a follow-up question about the brand(s) they selected. This can be done via skip logic.
But, if they select “none of the above,” they shouldn’t be routed to a question about any of the brands, but rather to another question. Or if your survey is dependent on knowledge of the brands you provided, you can consider ending the survey for this respondent.
There are of course, plenty of other question considerations to take when creating insightful market research questions. For example, some questions may require a scale, such as the Net Promoter Score or the Likert scale.
The former is appropriate to use in customer satisfaction and customer loyalty surveys, while the latter can be used in virtually any survey that requires answers with variations in, say, agreement with a statement. In such a case, the answers would include a scale with “strongly disagree” and “strongly agree” at opposite ends of the scale.
Step 5: Launch, Analyze & Take Action Post-Survey

When you’ve decided on how you’re going to organize your survey based on your questions and settled on all the necessary questions, you’re almost at the launching point.
First, review your survey. Make sure there are no technical glitches (ex: if you’ve added media files to questions) or typos.
Before launching the survey, consider adding survey incentives. These will assure you receive your results sooner. They will also posit your brand in a favorable light if your survey mentions it explicitly.
After launching the survey and receiving all the preset amount of completed surveys, it’s time to analyze survey data. There are a number of ways to go about this, from deciding on a data presentation mode(i.e., as cross-tabs, in charts, graphs, spreadsheets, etc.), to searching for statistical significance, to finding patterns and correlations.
With the correct survey data analysis, you’ll be able to put your data to use effectively and make informed decisions. After analyzing your survey results, you should amass key findings into another document and organize it into the nature of your findings.
Then, you’re in the final stage: post-survey mode. At this final juncture, you should consider what to do from the insights you’ve gathered. Perhaps it’s time to take action, or you may need more information, for which, you can create another survey.
If you decide to take action, consult with your team on the most logical course of action to take, whether it requires price markdowns, different approaches to improving CX, or providing customers with additional information or anything else to improve your business or research needs.
Mastering Survey Research for all Campaigns
To master survey research campaigns, you ought to perform research (usually secondary) on the research sphere itself, which is steadily innovating. Additionally, you need to have one secret weapon in tow: a strong online survey platform.
Through this platform, you’ll be able to conduct a survey — from creation to the launch phase to the analysis — with ease. A proper survey platform provides all the necessary interfaces, capabilities and quality checks to power your survey research.
Frequently asked questions
What are some useful points for conducting a survey?
A useful survey is never used as a lone tool. It always accompanies a bigger campaign. A useful survey fulfills a specific purpose - it can be finding a link between a variable and a phenomenon, for which you would need to conduct descriptive research. If your research is specific to a topic, you might need to conduct other research, such as secondary research, before turning to surveys.
What makes for a good survey?
Keeping survey questions neutral, having close-ended questions, a balanced set of answer choices, and diversifying option standards (having a rating scale of multiple-choice questions) are among some of the fundamental ways of making your survey interesting and valuable.
What constitutes an effective questionnaire design when conducting a survey?
When creating a questionnaire, the questions should be as specific to the target customers as possible. They should use basic wording and always have the option of 'other' to have more avenues for research. However, to skip all this hassle, use a market research survey platform to provide you with the data you need.
What is your survey launching process?
Once we have all the questions we want to include in the survey, we review them for any technical glitches. We also add survey incentives to encourage people to fill out these surveys and then launch these surveys on our target market's choice of social media platform.
How do you analyze survey data?
We analyze data sets in different ways. For example, sometimes our researchers organize all the collected data in tabs, graphs, and charts to find common patterns and correlations or sometimes to look for statistical significance.