
What to Expect from an Online Survey Tool: The Pros, Cons, Applications & More
What to Expect from an Online Survey Tool: The Pros, Cons, Applications & More
The online survey tool is the foremost tool for gaining customer intelligence for various business and research purposes.
As the digital landscape expands and competition stiffens, businesses are vying for online consumers more than ever. As a matter of fact, there are between 12 million – 24 million ecommerce websites worldwide and these figures continue to rise daily.
Tapping into the minds of customers is thus a necessity for businesses across verticals. As such, one of the most effective methods to conduct primary research on a target market is via an online survey tool.
This method systematically gathers data from respondents by inciting them to take part in various websites and mobile apps.
The internet in general is a sufficient tool for conducting secondary research. An online survey tool couples the internet as a means of distributing the survey, along with the traditional questionnaire.
This article explores what researchers and businesses alike can expect from the online survey tool.
Defining the Online Survey Tool
This tool merges the digital space with surveys, as it is a kind of software that allows researchers to form a questionnaire, set rules on respondent qualifications and deploy the full survey across partnering websites and apps.
The survey portion of the tool often incorporates two major components: the screener and the questionnaire. The screener portion allows researchers to set conditions on who to permit to move on to the questionnaire.
It collects demographic information, as market research and virtually all others aim to study particular demographics. It also has a section for screening questions, the answers of which determine whether the respondents are qualified to take part in the survey or not.
Researchers can input any question they wish to receive a particular response. Therefore, this portion allows researchers to take a granular approach to who takes the survey. The questions can delve further into demographics, or ask about psychographic or behavioral matters.
There are several things to look for in an online survey tool. There are also various business applications of this sort of tool. In this way, brands should consider it as more than merely a vehicle for collecting question-based data.
Instead, it can provide valuable feedback on critical business matters, such as for improving marketing efforts, advertising, branding and others.
Other Key Functions in a Survey Platform

An online survey tool doesn’t simply create and distribute surveys, not if it’s a potent one, that is. A valuable survey platform offers other functions.
For example, with so many survey software available, researchers often take a dual or even multi-pronged approach for their survey research. As such, a strong survey tool will allow integrations between survey tools. This can mean acting as the third-party survey distributor of a survey created in another platform.
Another function involves creating multiple paths in a single survey, so that respondents are only channeled to questions best suited towards their answers. This involves using advanced skip logic, which routes respondents to the appropriate question based on the answer they provided.
For example, if a question asks whether a respondent is familiar with a certain brand, they would need to be moved to a follow-up question about the brand — if they responded with “yes,” but not if they responded with “no.” The latter would require another question that better suits it logically, such as a one about awareness of a different brand.
A strong online survey will also allow researchers to create multiple audiences within one survey. This entails that each audience type can have completely different demographics and quotas for each demographic. The purpose of using multiple audiences per survey is to gain insight across as wide a target population as possible in one interface.
Some survey campaigns will require researchers to do just that.
How Data Is Stored & Presented
Dovetailing off additional functions, an online survey tool stores data and a robust tool can extract the data into multiple formats. The platform itself serves as a database for all the surveys conducted, along with their collected information.
Some platforms enable researchers to extract survey data into various file types. For example, researchers can export their data as cross-tabs (cross-tabulation). This data presentation format allows users to aggregate data and analyze the relationships between variables. The variables are displayed in a matrix, i.e., in rows and columns in a matrix for researchers to quickly find data in corresponding cells.
There are other formats that online survey tools support can export. These include PDFs, Excel sheets and SPSS. The latter is the statistical analysis and machine learning tool from IBM.
While these help create a more diverse survey research campaign, it is key to note that not all online survey tools include these kinds of data exports. Some may have fewer options, while others none at all.
Aside from different formats of exported files, the data displayed per each survey can also be viewed in different ways. These include tables, pie charts and column charts. These options grant researchers the ability to choose the visualizations they’re most comfortable with, or those that are best for a particular purpose. For example, presentations may require different displays than a research document.
A practical survey platform will offer several layouts to view and store data.
The Pros
Online survey tools offer a variety of advantages for market research and research for other sectors, such as medicine, psychology, other sciences and more. Here is a list of all the benefits you can obtain from an online survey tool.
- Ease of data collection: The online survey tool you use does all the heavy lifting for you in many ways, including collecting participants from your target market. That means no more worrying about how you’re going to get survey respondents to take your survey.
- Access to a wide pool of consumers: This kind of tool (the proper variety) deploys your surveys to a massive network of internet and mobile app users. Since millions of users frequent the web every day, you can rest assured that members of your target market will be exposed to your survey.
- Saving time and workload: Face-to-face interviews, focus groups, phone calls and the outdated mail-in surveys take too much effort to execute. Besides being more labor-intensive, these methods will also consume a great deal of time that you could be spending on other market research efforts, such as secondary methods, along with other business matters. Online surveys free up much of the time you would otherwise spend on the above methods.
- Insights into personal and sensitive topics: This does not include things like names, addresses and other identifying information. Rather, an online survey tool emboldens brands to ask more personal questions, the kinds that deal with politics, social issues and matters that are private to respondents. These kinds of questions would be discomfiting for respondents to answer face-to-face and even on the phone. But with online surveys, they are granted the confidentiality to give honest answers, including in-depth answers on sensitive matters (via open-ended questions).
- Easy set-up: An online survey tool makes it easy to create a survey and design it precisely to a researcher’s needs. This makes it easy to come up with question types, as this tool offers a variety of them, such as matrix questions, rating scale questions, Likert scale questions, single selection multiple-choice, multiple selection multiple-choice, open-ended questions and more. Additionally, this tool makes it easy to add media files for picture choice questions, or a picture-based question. It should make adding things like skip logic free from friction.
- Projected time to complete the survey: A well-built online survey platform will eliminate the guesswork that comes with having your target audience complete a survey. It grants researchers an estimated completion time, so that you will know the approximate time it takes for all your preset survey quotas to be completed by the intended respondent base.
- No cost-based geographic restrictions: This means you can send your survey across the world uninhibited. If your target market has internet access, then they can take part in your survey. Most survey tools don’t charge extra for deployment to specific geographic areas. A strong survey tool also gives you the option of setting up your survey in various languages.
The Cons
As with other market research tools, survey platforms aren’t free of flaws. As such, business owners, marketers and researchers should understand the drawbacks present in this kind of research method. The following lists some of the stumbling blocks of using an online survey tool.
- Ingenuine answers: No survey is foolproof. Sometimes, the respondents may become bored or tired when taking a survey. Thus, they provide answers that are not accurate to their real opinions and phenomena that occur around them. There are flatliners, those who answer with the same choice in a multiple-choice question consecutively across many questions. Then there are the self-explanatory rule-breakers, who break survey participation rules by lying. There are several more survey respondents to look out for.
- Some populations have limited availability: Not all members of your target market have quality internet access. Some market segments, such as those who live in particular geographic areas have restricted internet access. This is evident in rural parts of the USA and poorer regions across the world. This can be especially difficult if you run a nonprofit and would like to learn more about a needy population.
- Responses are not always representative of a population: Surveys provide valuable insights, but this data is not always representative of a targeted population. Sometimes, this will require running multiple surveys, or increasing quotas. Also, since certain consumers change their minds, a survey tool will not catch this unless there are follow-up surveys sent to the exact same users who took an initial survey. You will need to pay attention to the margin of error to avoid unrepresentative opinions.
- Repeated survey requests may annoy respondents: Depending on the publisher site or app that the survey is deployed in, and the survey tool itself, there may be repeated requests to take the survey. This is bound to irritate users, which carries the risk of their ignoring the survey, or at worst, leaving the site.


When to Use an Online Survey Tool in the Market Research Process
Researchers can employ this kind of tool at virtually any point in their research process. When conducting market research, it is best to begin with sources of information already made available, aka, secondary research. This will guide your business on the happenings, trends and innovations within your sector and niche.
Moreover, you can use secondary sources to study your direct and close competitors. This includes looking at statistics websites, along with blogs, news sites, forums and others that report and cater to your industry. It is also apt to study the websites of your competitors to see how their products, service and experiences compare with yours.
After you’ve gathered a suitable amount of secondary data, you can make certain inferences on your particular marketing plans or other business goals. At this point, you’ll find some unanswered matters arising, at which point you can generate specific questions you need from your target market. This is where the survey process begins.
During this point, it would be useful to design surveys for specific campaigns and aligning the surveys with the needs of a specific campaign.
The Verdict on the Online Survey Tool
Survey research requires surveys, as its name implies. An online survey tool is the most powerful source of primary information, because it allows researchers to ask any questions and get answers relatively quickly from their most sought-after target audience.
This tool supplies all the privacy a respondent needs to confidently and truthfully answer much-needed research questions. Researchers can rejoice in having their surveys distributed across a massive network of online publishers where their surveys will iterate until all the quotas are met and the preset survey amount is completed.
Also, since customers spend much of their time online anyway, why not approach them in their natural digital environment? Thus, despite any flaws or slight difficulties the researchers may encounter, our verdict is that an online survey tool is of the essence for a research campaign.
Frequently asked questions
What is an online survey tool?
An online survey tool is a type of SaaS, defined as a platform that allows surveys to be created, distributed, and analyzed completely within its providing survey platform.
What are some of the extra functions included in a strong online survey platform?
Survey platforms differentiate themselves by offering additional functionality such as distribution on third-party sites or apps, advanced skip logic, the ability to create multiple audiences, and advanced data analysis tools.
What are cross-tabs?
Cross-tabs, or cross-tabulation, is a way of organizing data that allows the user to analyze and understand the relationship between variables.
What export formats should you look for when assessing an online survey tool?
Good online survey tools will offer the ability to export data in a variety of formats including, PDFs, Excel spreadsheets, CSV, and SPSS.
What are some benefits of using an online survey tool?
There are many benefits associated with online survey tools including ease of creation, distribution and data collection, access to a wide variety of participants, and lower cost than other methods of survey distribution.

Building Effective Prospective Studies with Online Surveys
Building Effective Prospective Studies with Online Surveys

Prospective studies are a powerful form of research to understand how the behaviors, attitudes, feelings, and/or physical attributes of a population develop over time.
Particularly, researchers and marketers are using prospective studies to understand outcomes more broadly. For example, perhaps a brand needs to study how a customer or customer segment developed a certain habit, whether it is favorable or unfavorable to the business.
While researchers typically have a primary objective in conducting prospective studies, the data that is collected over time may reveal factors that were not considered when outlining the study’s original objectives.
Given the large amount of data that is gathered over time, prospective studies are a treasure trove of information for researchers. While it takes time and patience to collect the data, the results of a prospective study may yield completely new or unexpected insights.
Defining Prospective Studies
Once the territory of public health researchers, prospective studies have entered a wider area of study due to the application of survey research.
Prospective studies can help understand the factors that influence anything from consumer loyalty to employee retention to customer churn.
In prospective studies, data is gathered from individuals over a period of time. The data is then analyzed with the objective of identifying associations between variables. Traditionally, prospective studies have been most strongly associated with the fields of public health and medicine.
Prospective studies fall into the broader category of cohort studies, which are used to determine how often a phenomenon occurs within a specified population. Retrospective studies are another type of cohort study but differ from prospective studies in that they investigate an outcome that occurred in the past.
In research studies, the term “cohort” refers to a group of people who share common characteristics, which help define them as part of the sample group. The defining characteristic can be:
- demographic in nature, i.e., age or location
- behavioral i.e. where consumers purchase a product or how they use a certain digital property )
- psychographic, i.e., values, opinions and inclinations.
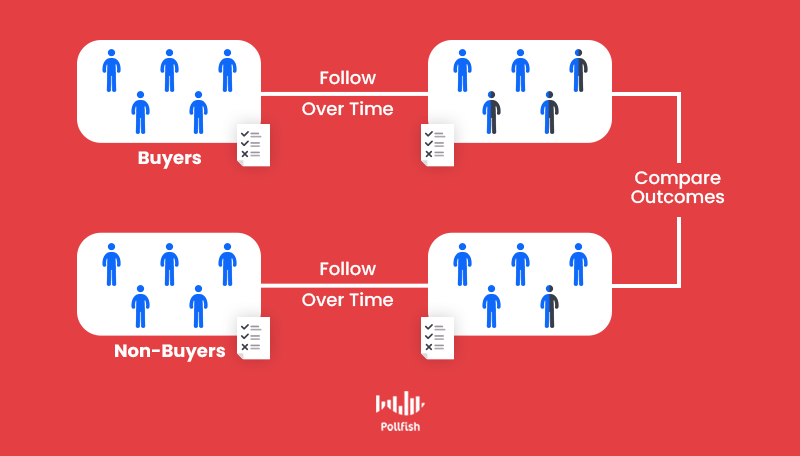

A unique aspect of prospective studies is that researchers fully plan and design the study, recruit participants, and collect initial information before any of the participants develop remarkable outcomes. Researchers must watch and wait for outcomes to develop before they draw any conclusions.
Prospective studies were previously cumbersome to conduct due to the need to follow a group of people and collect data over longer periods of time, but the use of prospective surveys has made this type of longitudinal research more accessible to a wider variety of organizations.
Examples of Prospective Studies
Some of the most famous prospective studies have been conducted within the field of medicine. The outcomes of the studies mentioned below have helped solidify our understanding of how certain factors influence our overall health.
- The Framingham Heart Study is an ongoing study that started in 1948 with an original cohort of 5,209 healthy individuals located in the town of Framingham, MA. With the objective of identifying major cardiovascular disease risk factors, this study has fundamentally changed our understanding of cardiovascular health.

- The Nurse’s Health Study refers to two of the largest investigations into the risk factors that contribute to chronic disease in women. The studies began in 1976 and have followed a total of 280,000+ participants over three generations.
While prospective studies are particularly useful in following medical developments, they are also used to reveal deep and sometimes unexpected insights in business subsectors and other verticals. Here are some examples of scenarios in which businesses can apply prospective studies:
- Researchers want to understand how early exposure to social media influences the feelings and attitudes of young adults. They plan a 10-year study to follow a cohort of children who are 9-11 years old at the outset of the study.
- A large company decides to investigate the link between certain hiring practices and long-term employee retention. This is done by following new hires over a period of 5 years, or until they leave the company.
- A large online retailer plans a study to understand how buying behavior changes with age. Their prospective study will follow a large sample of 20 - 30-year-old customers for a period of 20 years.
- A SaaS company wants to understand how consumer loyalty changes over time. They decide to conduct a prospective study that follows anyone who signs up for their software subscription during 2021.
- A global beverage company wants to understand how health and lifestyle choices influence customer behavior. They decide to conduct a prospective study following a cohort of Millenials over 10 years to better understand their decision-making process.
Use of Surveys in Prospective Studies
Since prospective studies are often conducted over a long period of time, an important aspect of planning a prospective study is to determine how to collect and organize data during the study. In the past, the enormity of this challenge was one of the reasons why prospective studies were rarely undertaken outside of the public health sector.
The advent of online survey platforms has made it easier to conduct prospective studies and analyze the resulting data. After establishing the cohort, researchers can easily design and distribute surveys at predetermined intervals and allow the respondents to complete the surveys within an allotted period of time.
In comparison to older methods of data collection, such as phone or in-person interviews, online surveys provide a flexible and cost-effective way to interact with the cohort where and when it suits them best.
In addition, data collection is seamless, with data being automatically compiled with each survey iteration. Whereas prospective studies previously required a team that was well-versed in survey data collection and analysis, online surveys have made it possible for marketers to use prospective studies without needing to engage an outside company.
The Pros and Cons of Using Surveys in Prospective Studies
While surveys are a relatively easy way to collect data from a cohort, especially over a longer period of time, there are pros and cons to consider before choosing to use this method.
Prospective surveys are typically more cost-effective than conducting in-person phone interviews over a period of time. You may also experience a higher survey response rate by allowing the respondents to complete the survey when and where it is convenient for them.
If you decide to use an online survey platform to conduct prospective surveys, you will benefit from the ability to more easily complete, export, organize, and analyze data. This is an important consideration if you think about the large volume of data that will be collected over several months, years, or decades.
Since prospective studies are often conducted over a long period of time, the cost of data collection may be a barrier for certain organizations. The use of online surveys can help minimize this cost by reducing the need to hire specialized personnel to design the study and gather feedback.
On the other hand, there are some benefits to conducting interviews or performing physical exams. During the repeated interactions with the interviewer, the respondent may come to form a relationship that helps them feel more comfortable about answering the questions. This may allow for more honest or unexpected responses, which may not occur with the use of a survey.
Similarly, the design of a survey can greatly affect the results. With a limited set of responses, there is less flexibility to uncover unexpected or new responses. This can be avoided by including open-ended questions or text entry fields to submit additional information.
Gaining Deeper Understanding with Prospective Studies
Thanks to online survey platforms, it is possible for more organizations to benefit from the ability to gather data from their respondents over a period of time. If you are looking for a way to gain a deeper understanding of how certain factors influence the thoughts and behaviors of your customers over time, consider conducting a prospective study.
There is no denying that prospective studies take a great deal of effort to plan and manage, but the results of this type of study can lead to completely new insights and understanding of your target market
This allows you to innovate on your offerings, personalize your customer experience (CX) and foster stronger marketing efforts, all of which will help scale your business.
Frequently asked questions
What is a prospective study?
A prospective study is a longitudinal cohort study that studies a group of similar respondents with only a few differing factors to determine how these factors affect an outcome or outcomes.
What is a cohort study?
A cohort study is used to gather information about a group of people who share common, defining characteristics (i.e. a cohort) over a period of time.
What is longitudinal research?
Longitudinal research is a type of research that is performed over a period of time to understand the relationship between the same variables in an observed population. The period of time ranges from several weeks to years to decades.
What are the benefits of using surveys in a prospective study?
Surveys are a cost-effective way to collect information in a prospective study, in which data collection costs tend to be higher due to the longer period of study They also encourage a higher survey response rate and allow researchers to easily compile and analyze the huge amount of data that is collected during the study.
What are some disadvantages of using surveys to collect data in a prospective study?
Surveys do not allow the participants to form a connection or relationship with the researcher, which can be beneficial because it may result in deeper, more honest insights. They also do not allow for physical examination, for example by a doctor or nurse, which can provide additional data to support the study.

The Product Satisfaction Survey Question Guide
The Product Satisfaction Survey Question Guide

Product satisfaction survey questions power their namesake survey, which allows businesses to quickly gain valuable information about their products directly from their paying customers.
Well-designed product satisfaction survey questions will not only measure how satisfied your customers are with your product(s), but also provide valuable information about how to improve your product or the product experience.
How you create your product satisfaction survey questions can make the difference between lackluster insights and those that can drive real change for the future of your product.
This article will help you understand how to create strong survey questions that will elicit useful responses that drive improvements, innovations and profitability.
Planning Your Product Satisfaction Survey Questions
The product satisfaction survey comes in a variety of formats and lengths. Your motivation for conducting a product satisfaction survey will influence the survey format that you decide to use.
In many cases, companies will conduct a variety of surveys over a period of time, with each survey type designed to fulfill a specific purpose.
Here are two principal considerations for these questions:
- If your company sells many different types of products, it may be useful to deploy a short product satisfaction survey on each product that customers bought. In order to ensure an optimal survey response rate, your survey questions should remain at just a few critical questions.
- On the other hand, if your company develops high-end products or ones that require a longer period of use before a customer could rate it, you may benefit from surveys that are distributed less frequently but ask more in-depth questions.
In the following section, we provide examples of different types of product satisfaction survey questions. These questions will help you get started, whether you choose to create a survey with 2 questions or 10!
Questions about Overall Product Satisfaction
At the outset of your survey, you should seek to understand your customers’ overall product satisfaction. To get a greater number of responses, consider having just 1 or 2 questions in this part of the survey, followed by an optional second part that dives deeper into the product.
Overall product satisfaction can be understood by asking one or more of the following questions:
- How satisfied are you with this product?
- If you wish to use the Customer Satisfaction Score survey (CSAT) format, the response should be provided on a 1 - 5 scale, with 5 indicating “highly satisfied.”
- Alternately, you could use a visual rating system using emoticons or create your own multiple-choice responses (e.g. “I love it!” / “It could be better.” / “I regret buying this product.”)
- How likely are you to recommend this product to a friend or colleague?
- This is the golden question asked in a Net Promoter Score (NPS) survey, which is popular because it can help companies quickly gauge overall product satisfaction. The response is provided on a scale of 1 - 10, with 10 being “most likely to recommend.”
- You could also use binary (yes/no) or multiple-choice responses for this question.
- How likely are you to purchase this product again?
- Responses can be scaled i.e.,. 1 - 10, with 1 being least likely, or multiple choice (“I would definitely buy this product again!” / “I might buy this product again.” / “I would not buy this product again.”.
- How easy is it to use this product?
- If your product has many features, consider using the Likert scale to get responses about each of its features.
Questions about Product Features
If your product has multiple features or uses, you may need to get a better understanding of how each feature contributes to product satisfaction or dissatisfaction. This can help you decide how to improve, create, or retire certain product features.
In this section, you may wish to include a combination of close-ended and open-ended questions to give your customers the opportunity to provide additional feedback.
- Where do you use this product?
- Multiple-choice response (e.g. “At home” / “At work” / “At home and at work”)
- A Matrix or Likert scale if you want to understand how frequently the product is used in certain situations.
- A text entry field
- Why did you purchase this product?
- Multiple-choice response
- A text entry field
- Which of the following features do you use and how often?
- To quickly gain information about various features, use a Matrix to gather information about the product features. The Matrix can have a list of product features in the first column, with responses along the top row, such “I use it every day.” / “I use it occasionally.” / “I rarely use it.”
- How would you rate each of the following features?
- A matrix with scaled responses is a good way to quickly assess satisfaction with each product feature.
- What can we do to improve this product for you?
- The response can be a text entry field to give customers the opportunity to provide spontaneous feedback, as you never know where the inspiration for your next product feature will come from.
- You could also use multiple-choice responses to prompt users to think about certain ways to improve the product, i.e., “Improve the on/off switch.” / “Include timer functionality.”
Questions about Price and Quality Balance

How your customers perceive the balance between the price and quality of your product can affect their overall satisfaction levels. These questions can help ensure that your pricing strategy is appropriate for your customer base.
- How would you rate the price of this product?
- The response may be scaled or multiple choice (i.e.e.g. “Too expensive” / “somewhat expensive” / “as expected” / “less expensive” / “much less expensive”).
- If this product was priced at [insert a lower value here], how would you describe your feelings?
- Multiple choice answers with responses such as: “I would start to doubt the quality of the product and might not purchase it. / “I would think it was a good deal and would consider purchasing.“ / “I think this is a better price for the product.”)
- How likely would you be to try this product if it were priced at [enter a value you wish to test here]?
- Scaled answer, with 1 being extremely unlikely and 5 being extremely likely.
Questions to Help with Product Innovation
One of the most exciting aspects of evaluating product satisfaction is the opportunity to learn how your customers would like to see your product evolve in the future. This is your opportunity to explore potential features and, potentially, uncover some unexpected ideas.
- Please rate how likely you are to use the following features:
- For this question, a matrix will allow you to understand how likely your customers would be to use any number of potential features. List out the features and allow users to select from options such as: “extremely likely” / “likely” / “unlikely” / extremely unlikely.”
- What is the one thing that you wish this product could do?
- Multiple choice (list out potential features that could be added)
- Text entry field to allow for free-form responses.
- What do you like least about this product?
- Text entry field
- Multiple choice (list out some of the potential flaws in your product).
- What do you like most about this product?
- Text entry field
- Multiple choice (list out some of the most important features of your product).
Questions about Product Retention

Finally, you may wish to explore how product retention affects satisfaction. Long-term company profitability has been linked to how long customers keep a product, so this is an important metric to explore. This information can also be used to segment your customers and understand how product retention affects satisfaction levels.
- Did you keep this product?
- Binary response.
- Those who answered “no” could be directed to the following questions.
- If you did not keep this product, what did you do with it?
- Multiple-choice answer (e.g. “Returned it for a refund.” / “Exchanged it for another similar product.” / “Gave it away.” / “Threw it in the trash.”
- Why didn’t you keep the product?
- Multiple-choice answer (e.g. “I wasn’t happy with the quality.” “It didn’t work properly.” “I found a better price.”)
- Provide an optional text entry field for additional information.
- How long did you use the product before you returned or discarded it?
- Multiple choice response (e.g. “1 day” / “3 days” / “1 week” / “Longer than a week”).
Tips for Creating Strong Product Satisfaction Survey Questions
Regardless of the type of survey you choose to conduct, it’s important that you give careful thought to each question. Here are some tips to keep in mind:
- Ask questions about overall product satisfaction first, before diving into more specific questions.
- This ensures that you have at least one strong metric to track over time.
- Keep the survey short and focused to ensure an optimal response rate. Aim for 3 - 6 well-written questions (less if you are using the NPS or CSAT format).
- Give participants the opportunity to provide additional feedback by including open-ended questions with text entry boxes.
- This type of question should be optional, so it doesn’t prevent other users from completing the survey.
- Consider using a combination of quantitative and qualitative survey questions to gain a 360-degree view of your product from the customer’s perspective.
- Ensure that each question has a single focus. Cramming two questions into one will confuse your respondent.
- Use clear language and avoid using industry jargon. This helps respondents understand each question and pick the appropriate answer accurately.
To learn more about creating powerful survey questions, visit our comprehensive guide about creating survey questions and responses.
Better Planning with Product Satisfaction Surveys
Product satisfaction surveys are essential tools for granting companies the ability to understand much more than just overall satisfaction levels. These tools can be used to help chart out the course of your product by learning how to improve it over time.
Whether you choose to deploy a short survey or a more comprehensive one, you will gain invaluable data that describes exactly how your customers feel about your product. By taking the time to plan out more detailed questions, you can also make smart decisions about adding new product features and improving or retiring existing ones.
Unlike many other survey types, your audience is preselected, which means you don't need to go hunting for people to take your survey. Once you take the time to create strong product satisfaction survey questions, simply distribute the survey to your customers and get ready to dig into the data.
Frequently asked questions
What is a product satisfaction survey?
A product satisfaction survey is any type of survey that is conducted in order to better understand how satisfied existing customers are with a company’s products.
What types of companies can benefit from product satisfaction surveys?
Any type of company, from brick-and-mortar shops to online stores, that sells products can benefit from conducting product satisfaction surveys.
Why is it important to ask questions about product features in a product satisfaction survey?
Companies can gain a better understanding of which product features are beneficial and which are problematic by carefully examining the various features in a product satisfaction survey.
Why is the Net Promoter Score (NPS) a useful product satisfaction survey question?
Based on a scale of 1 - 10, the Net Promoter Score (NPS) seeks to measure how likely a customer is to recommend a company’s product to a friend or colleague. This simple indicator gives the company an overall idea of how satisfied customers are with their product.
What is the right number of questions to include in a product satisfaction survey?
Product satisfaction surveys can contain any number of questions, but short surveys of 3 - 6 questions are more likely to yield an optimal response rate.

Mastering Survey Sampling Methods for Consumer Intelligence
Mastering Survey Sampling Methods for Consumer Intelligence
Survey sampling methods are a crucial part of the survey research process, as the aspect of sampling is more than just a data collection practice.
This is because in order to glean any valuable insight from surveying, the respondents must be as representative of the study’s target population as can be. The correct survey sampling method can make this possible.
When conducting survey research, there are several sampling methods researchers can leverage. In order to apply the correct method, there are certain things you need to establish. This article delves into survey sampling methods, including the considerations to take before settling on a sampling method for your research needs.
Defining Survey Sampling Methods
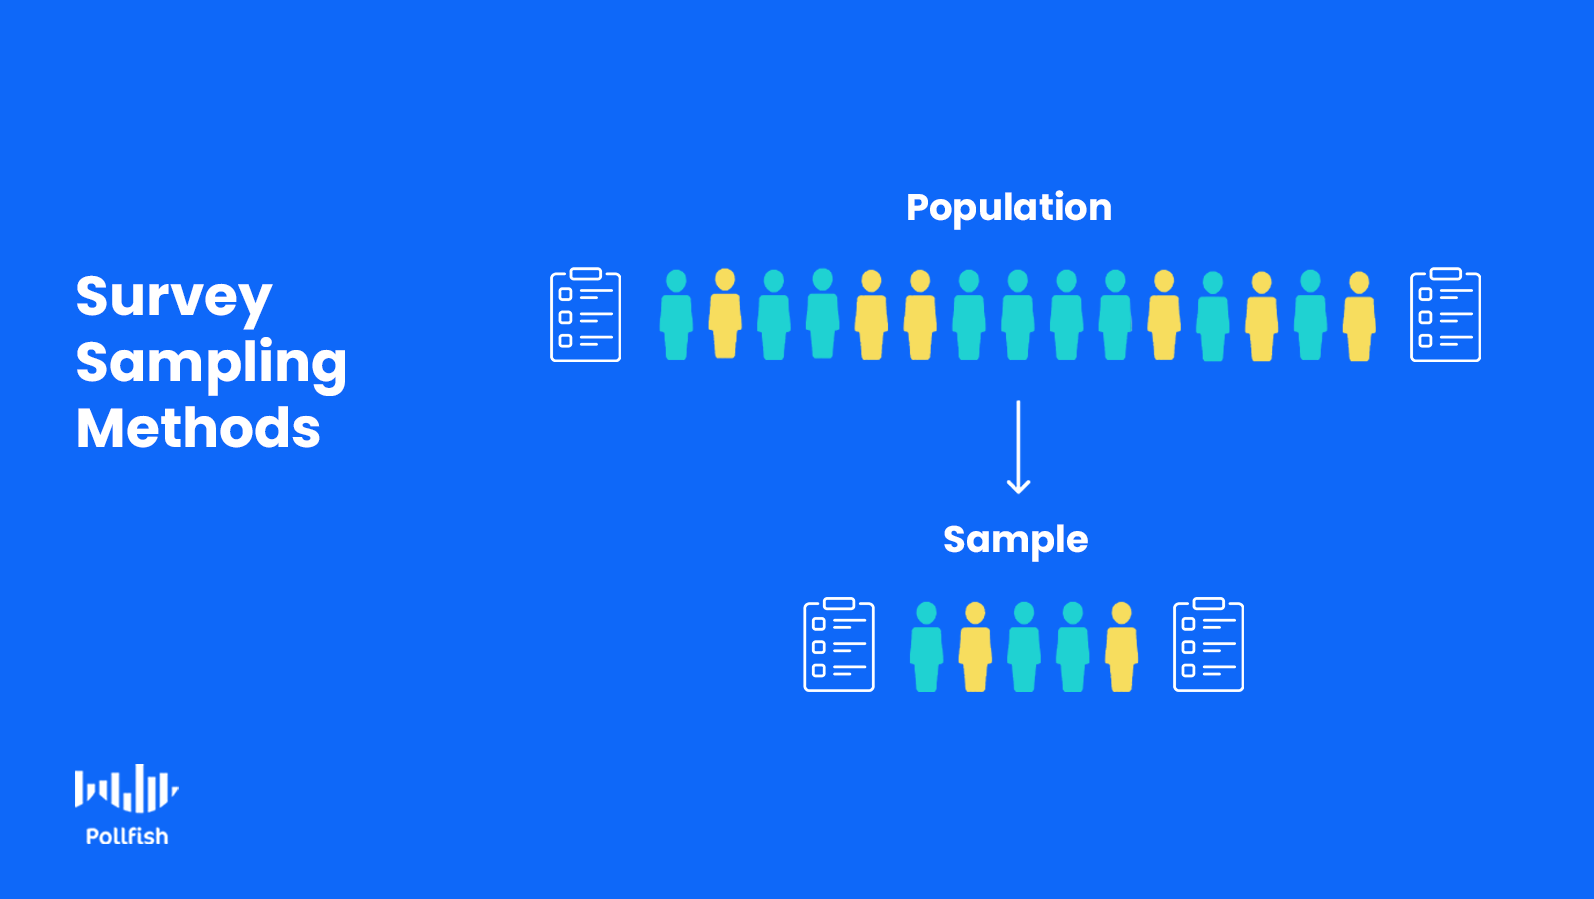
Survey sampling methods denote the types of techniques used to select participants from a target market (or any target population) to take part in a survey sampling pool.
In survey research, the sampling pool is the group, or “pool” of targeted respondents who participate in a survey study. This sampling pool must accurately represent the targeted subject population.
It is important to have a group of people who will participate in the survey and be able to represent the whole target population. This group is called a “sample".
Settling on the proper sampling pool is known as sampling, which is critical to surveys, as it makes up the foundation of the survey campaign.
Why Survey Sampling Methods are Necessary
The main goal of surveys is to gather accurate information about a particular population. As such, they would be futile if they insufficiently accounted for the participants that they’re set on studying.
Survey sampling is necessary, as sampling provides a potent means of extracting and analyzing a targeted subset of a population. Even when researchers zero in on a subset, it is still virtually impossible to study the entire population of a targeted group.
The reason is twofold and fairly straightforward: not all members of a particular population will be exposed to a survey, and out of those that do, most will not be willing to spend time filling out a survey.
As such, researchers turn to survey sampling methods, so that their sampling pool best represents the population of researchers’ interest. With the right method, researchers can make well-informed inferences about their targeted population.
Sampling reduces the sampled respondents, which lessens both the workload and costs associated with a particular survey study. However, researchers have to find the correct balance of participant involvement to accurately ascertain associations between variables.
Determining Your Target Population: The Precursor to Survey Sampling
Effective survey sampling occurs when the researchers have established the population subset which they intend to study. As such, you should begin any survey sampling campaign by defining your targeted population.
If you need to conduct surveys for a business, you should always aim your studies on your target market (when not observing your competitors). This is because the target market is the group of individuals most interested in your sector and most likely to buy from you.
In this regard, it is also important to conduct market segmentation of your target market, as your target market is made up of several consumer segments. Surveys are a powerful tool for segmenting your target market.
But again, you must properly sample your population before conducting any survey research. There are several ways to approach survey sampling.
Probability (Random) Sampling Vs. Non-Probability Sampling
There are various kinds of survey sampling methods, which fall under two main classifications: probability and non-probability sampling. Businesses, governments and other entities can apply either one or both of these methods for their research needs.
Before navigating the multitude of survey sampling methods, it is key to be able to differentiate the two main categories of sampling. This will put the subcategories, i.e., the specific sampling methods into sharper perspective.
The following explains the core aspects of the main types of sampling methods.

Probability Sampling:
Also called random sampling, this category initiates with a full sampling of all the individuals qualified to be in your sample. This main method grants all eligible participants the chance to be used in the sample. In this way, your sample will be able to allow you to make generalizations from your survey results.
The methods that fall under probability sampling can be more expensive and take up more time than their non-probability sampling counterparts.
The main advantage of using probability, or random sampling is that the chosen sample is more representative of the target population. As such, this kind of sampling fosters credible statistical conclusions.
There are five main types of probability sampling methods: simple random sampling, stratified sampling, cluster sampling, multistage sampling, and systematic random sampling.
- Simple Random Sampling: The most common form of probability sampling, random device sampling involves each member of the population receiving an equal chance of being selected in the sample pool. True to its name, the respondent is chosen by chance. This method reduces selection bias and allows you to calculate the sampling error.
- Stratified Sampling: This method involves dividing the population into subgroups. Known as strata, these groups are divided based on a shared characteristic. This method is used when there is reason to believe the variables will differ between each subgroup. Populations can be stratified by gender, age, location, interests, habits, etc. The study sample is acquired by taking either equal or unequal sample sizes from each stratum. This method enables all categories within the population to be represented in the sample.
- Cluster Sampling: This form of sampling assigns every member of the population to a single group called a cluster. Then, a sample of clusters is chosen, typically via simple random sampling. Contrary to stratified sampling, which includes elements from each stratum in the sample, cluster sampling uses a sample with elements only from the sampled clusters. As such, it is more exclusive. This method can be efficient when it comes to studying a wide geographical area, as it’s easier to contact many members of one area than a few members of various regions. The disadvantage includes an increased risk bias when chosen respondents are not representative of a population, which yields sampling errors.
- Multistage Sampling: This technique relies on selecting a sample by way of combining different sampling methods. As such, this method involves different stages, wherein Stage 1 may use random sampling, while Stage 2 may use stratified sampling. This method allows researchers to merge different styles of sampling, as a means to study various variables and draw conclusions through different focuses.
- Systematic Random Sampling: This method is used when a given population is logically homogenous. It involves enumerating all members of the given population on a list. When all members of the list are compiled, the researchers select the first sample element from the first several elements on the list at regular intervals. The advantage in using this method is its relative ease of use, in comparison to simple random sampling. Also, since simple random sampling may involve clusters, systematic random sampling offers a contrast: evenly sampling the population.
Non-Probability Sampling:
Also referred to as non-random sampling, this chief method does not start with a complete sampling pool, as some participants will not have a chance to be selected in the sample. Instead, it relies on the researcher's judgment.
As such, researchers can’t assess the effect of the sampling error. Additionally, there is a higher risk of using an unrepresentative sample, which harms the chances of reaping generalized results.
On the other hand, non-random sampling methods are less costly and are easier to conduct, making them conducive for exploratory research and formulating hypotheses.
There are four main types of non-probability sampling methods: convenience sampling, quota sampling, judgment (purposeful) sampling and snowball sampling.
- Convenience sampling: Known as the simpler non-random sampling method, convenience sampling selects respondents based on their own availability and willingness to participate in the sample. Although researchers can amass valuable information, this method carries a greater risk of volunteer bias, as those who wish to take part may be significantly different from those who don’t. Thus, the sample may not be representative of certain characteristics, such as habits, age or geographical location.
- Quota sampling: The most pertinent non-probability sampling method for market research, as respondents are chosen based on quotas. For example, a survey study may require 100 adult men, 100 adult women and 200 children. The quotas used would need to represent the characteristics of the studied population. The benefit in this method is the potential to be highly representative. However, respondents may not be representative of characteristics that were not considered, which is one of the general drawbacks in non-random sampling.
- Judgment Sampling: Also referred to as purposeful, selective or subjective sampling, this method involves exercising the researcher’s own judgment when choosing sample participants. Therefore, they may decide on a representative sample, one that exhibits certain characteristics. Oftentimes, media outlets use this method when surveying the public on qualitative research.
- Snowball sampling: This method is named based on the analogy its methodology puts into practice. Typically used in surveying groups that are difficult to reach, respondents are tasked with calling on more respondents (the ones they know) to take part in the sample. This is how the sample of an otherwise hard-to-recruit group increases, or snowballs, in size. This method is productive for bringing on individuals that can be difficult to study, but it risks selection bias, as is the case when choosing a large group of people with similar traits to the original respondent).


Survey Sampling Size, Bias & Other Considerations
When undertaking survey research, aside from understanding your target population and what kind of data to derive from them for your survey research, researchers need to decide on a sample size. This does not necessarily need to occur before deciding on the best survey sampling methods for an investigation.
Instead, it is apt to start with an approximate number of respondents in your sample, while identifying an exact size after you settled on a sampling method. This is because researchers may come upon factors that change the proper sample size for their studies. Additionally, facets such as budget and availability come into play.
Researchers also ought to note that both probability and non-probability sampling methods run the risk of developing a survey bias. These biases take place in various situations. These include omitting respondents from hard-to-recruit groups, straying from sampling rules, replacing already opted-in individuals with others, low response rates and others.
Another critical issue to consider is that your survey vehicle, the tool you will use to design and deploy your survey. A strong online survey platform can help you avoid biases and will offer a modern survey sampling method. One of the latest and most potent techniques is RDE (Random Device Engagement), which can reach a massive sample and incorporate several of the methods listed above.
Businesses and researchers in other industries should therefore consider using this survey sampling method.
Frequently asked questions
What is a survey sampling method?
The survey sampling method refers to the technique used to choose individuals to participate in a survey.
Why are survey sampling methods necessary?
In order to gain accurate information about a population, researchers must select participants who provide a good representation of that population. Survey sampling methods provide a way of selecting participants that will best represent the targeted population.
What is a target population?
A target population is a narrowly defined group of people that will be studied in order to draw conclusions about a wider population.
What is probability sampling?
Also called random sampling, probability sampling is a sampling technique in which participants are chosen at random from a larger population.
What is a survey sample size?
A survey sample size is the number of individuals who have been chosen from the target population to participate in a survey.

How Surveys Help Reduce Customer Churn Rate
How Surveys Help Reduce Customer Churn Rate
The customer churn rate can be a disappointing metric that businesses must contend with — that is, it measures a negative behavior, but when the rate is low, it signifies a positive business attribute.
This is because churn rate quantifies an aspect of financial health by way of a customer behavior; a low churn rate is indicative of favorable customer relations. Companies should strive for a low churn rate as it helps pave the way for a strong financial standing.
On the contrary, a high customer churn rate is bad news; it points to poor consumer loyalty, which all brands should avoid like the plague. Implementing market research, particularly surveys can help reduce churn.
This article explains what the customer churn rate is and how surveys are a proven antidote.
Defining the Customer Churn Rate
This is a financial metric that measures customer churn, which is a behavior defined by customers who stopped using a business’s products or services within a certain time frame.
Also called customer attrition, this metric is especially relevant for businesses who offer subscriptions or contract-based services. In this case, the churn rate specifically refers to the number of subscribers who either cancel their subscription or don’t renew it.
Customer churn rate is expressed as a percentage, in which the percentage refers to churned customers within a given time period.
“Churn” also alludes to loss on a larger scale; this means it can describe losses beyond customers alone. Here are a few examples of matters that churn rate determines:
- The number of customers (the most common measurement)
- The value of lost recurring business
- The percentage of the loss of recurring value
How to Calculate the Customer Churn Rate
Calculating churn rate is fairly simple; all you need is to consider two variables: the number of customers you lost within a time period and the number of customers you started off with previously.
Divide the number of customers you lost, say, in the last quarter, as is the common variable, by the customers you started with in the last quarter. Move the decimal point twice to the right to get the percentage. This percent represents the churn rate.
Example:
Customers you lost last quarter: 50
Customers you started with at the beginning of last quarter: 900
50/900= 0.05555555
Churn rate = 5.55%
This standard calculation also represents the simplest kind, as there are 4 ways to calculate churn rate. You ought to consider which calculation is most needed for the unique situation of your business.
It’s important to note that the simple method of calculating churn does not take newly acquired customers into consideration. For example, say you gained 40 new customers during the last quarter — these are not part of the formula, therefore do not count towards your quarterly churn rate.
It’s also critical to remember that the time period used above is just an example; you can quantify customer churn on a monthly or yearly basis if you so choose.
Why Churn Rate is Significant to Consider

You should be regularly checking your churn rate as it helps you gauge your customer loyalty. Loyal customers are unlikely to churn, so the ones that do are significantly less loyal.
By understanding the disloyal customers, you can craft better experiences, messaging and even product innovations to ensure less churn and therefore greater customer retention. In today’s competitive digital landscape, customer retention is more important than customer retention.
Not only is acquisition more expensive, as it costs 5 times more to acquire a new customer than to keep an existing one, but it also yields less profitable results. Customer retention, on the other hand, increases profits up to 95%, after a mere 5% increase in retention, as one study found. Therefore, it is key to a successful business.
Additionally, retention is critical, as existing customers don’t require as much persuasive efforts to stay with a business (they’re already doing so). They are also willing to spend more — up to 31% more, as well as being more inclined to try new products.
The lower your churn rate is, the greater your customer retention is for a particular time. As such, it is in the best interest of any business to keep churn rates low, so they must be carefully observed.
As far as customer retention is concerned, churn rate is also useful to study in comparison with Customer Lifetime Value (CLV), which measures a customer’s entire worth to a business during their lifetime relationship with one.
All in all, the churn rate helps you keep track of your lost customers. In order to keep this rate to a minimum, you must at the very least calculate it.
Customer Care: the Most Potent Way to Minimize Churn
Your product or service may be useful and necessary to your target market, but if you are disconnected from your customers, many of them are bound to churn. The strongest method to avoid churn or reduce it significantly is to provide the best care for your customer.
Caring for your customers involves a number of different actions, as it is not bound solely by friendly customer relations, as its name may suggest. Here are several ways to care for your customer to minimize churn rates:
- Offer multiple methods of communication, to ensure your customers that they are being listened to and heard. This will also allow you to understand what they seek and what they loathe.
- Create incentives; these help your company stand out among competitors and grant your customers more value.
- Formulate a loyalty program; this incites multiple purchases, fostering retention and relationship-building with your customers.
- Implement a strong VoC (voice of the customer) program for customers to be able to express their grievances and desires.
- Practice social listening, the process of overseeing social media networks for mentions of your company and competitors. This will give you a firsthand glimpse into how your customers feel about you in relation to other businesses in your niche.
- Personalize the customer experience, whether online or in-store, personalization shows customers that they’re not just another number making a purchase, but they are individuals you are being thoughtfully catered to.
- Reach out to customers yourself. Don’t wait for them to come to, as most often won’t unless they have a question or concern. Up your marketing ante via emails, social media and calls (especially if you provided free samples for the last method). This also shows customers that they are being heard and more personally served.
Survey Research: Providing a Breeding Ground for Better Customer Relations
Surveys help you achieve all of the techniques aforementioned in the prior section. This is because in order to coax your customers into loyalty and out of churning, you need to be able to understand them.
While plenty of software programs make promises of improving customer satisfaction and thereby relationships, surveys are the only alternative to get specific answers to both your own questions and those of your customers.
Surveys have the power to capture more than merely your customers’ needs. These vehicles allow you to gain direct insight into your customers’ minds on virtually anything: opinions on current affairs, aversions, desires, small irritation factors, shopping preferences, etc.
The better you understand your customers, the better you will serve them, whether it is through your marketing, branding, or product upgrade endeavors.
With mail-in surveys becoming obsolete, an online survey platform is the most optimal method for conducting your survey research.
Surveys help stamp out churn rate as they can be hyper-focused on one aspect of the customer experience. For example, you can create a survey to collect feedback on a recent order, an interaction with a salesperson or a chat representative, or you can gather opinions on current product updates, product glitches, ads and virtually anything else you can think of to avoid customer churn.
The latter is especially useful if the survey platform you use allows you to insert visual elements (images, GIFs, etc) to your questionnaires.
Surveys may appear to provide little depth as most have to be kept short to avoid survey attrition. However, you can design surveys with open-ended questions for a qualitative approach to your surveys. These allow customers to provide invaluable insights on why they churned or are thinking about doing so.
Prioritizing the Correct Actions to Reduce Churn Rate
Once you’ve gathered and analyzed data from your survey research, you’ll be able to understand what causes your unique customer churn rate. This will equip you with the knowledge to move forward with meaningful changes.
You should prioritize on the strongest influences to your churn rate and create a plan of action to reduce them. Survey research can point to problems you’ve never thought were present.
For example, perhaps your product or offering is perfectly fine and even desirable among your customer base. Instead, your customers churn due to poor customer support. This should prompt your business to adopt more training within this particular department.
Or, perhaps your product has no malfunctions; rather your customers want it to do something beyond its capabilities. It is possible that your competitors are already on to this and have adapted their product to this customer desire. Thus, it is easy to see why your customers churned. What’s most important is that with this insight in tow, you can inform your product team and prioritize on innovating.
This will lessen your churn rate in turn. When your churn rate is in decline, it translates to added revenue. Surveys can detect frustration with specificity, allowing you to avoid issues that contribute to customer churn.
Frequently asked questions
What is customer churn rate?
Customer churn rate is the percentage of customers who stopped using a company’s products or services during a certain period of time.
How is customer churn rate calculated?
In order to calculate customer churn rate, a company must first identify two figures for a certain time period: the number of customers who started off with the company and the number of customers who left. To calculate the customer churn rate for a certain period of time, divide the number of customers who left by the total number of customers during this time period.
Why is it important to track customer churn rate?
By understanding how your customer churn rate changes over time, a company can understand the factors that influence customers to stay or leave. The company can also work on creating a better customer experience to improve its churn rate.
What are some of the ways to minimize customer churn?
Customers are more likely to stay with a business if they feel a connection with the company, are easily able to contact the company, have an incentive to stay (i.e., via a loyalty program) and/or are satisfied with the customer experience in general.
How can survey research improve customer churn rate?
Surveys can provide direct and unique insights into the mindset of your customers so that you can enhance the customer experience, improve customer loyalty and reduce customer churn.

How Polling Software Disproves that Polls Don't Work
How Polling Software Disproves that Polls Don't Work

Polling has a bad reputation, but polling software, when used correctly, proves that polls are predominantly accurate.
In order to receive responses that truthfully reflect the views of a certain population, there are a few things to keep in mind on the nature of polls and survey research. When you take these matters into consideration and couple them with robust polling software, you will be poised to glean useful data that you can use to power any market research campaign.
This article will cover polling software, including instances of it having made accurate predictions, along with the key aspects to keep in mind to reap the most out of your polling efforts.
How the Right Polling Software Predicted the 2016 Presidential Election
The Pollfish polling software was able to predict Trump’s lead in several key swing states back in 2016. While most national and state polls projected Hillary Clinton to win the presidency, Pollfish was able to forecast Trump’s victory in several key states.
The platform discovered Trump’s favorability in purple states including Florida, North Carolina, Pennsylvania and Ohio. It also reported Trump winning in blue states such as Wisconsin and New Hampshire, which ran counter to many state polls. These findings painted a far more accurate picture of the direction of the 2016 presidential election.
This is due in part to the sentiment we studied using the Pollfish platform, which included measuring attitudes around each candidate’s stance on key issues. The platform showed that many of the states with Trump’s victory held his opinions on salient topics, like immigration.
This polling software was also able to hyper-localize opinions, by amassing respondents based on their US census region, city and zip code. These capabilities, along with calculating the margin of error allowed Pollfish to extract data that was closely aligned with the 2016 presidential election.
Avoiding Inaccurate Data: The Sampling Error & the Margin of Error
Regardless of the polling software you use, by their very nature, polls do not reflect the views of everyone in your target market or subject of interest. The reason is self-evident; it is impossible to survey everyone who fits within your targeted population.
Even those who would not object to participating in a poll may not happen upon one, whether it is over the phone or online. This is especially true in random sampling, in which respondents partake in a poll by chance. As such, polling is subject to several errors.
The most common error found in polling is known as the sampling error, which comes about from using a sample of a population instead of its entirety. The sampling error itself is unknown; it relies on the margin of error for a calculation.
The margin of error is an estimate of how much of the results of the sample may deviate from chance as compared with what the results would be like if the whole population was polled. It shows the maximum possible size of the sampling error.
In doing so, researchers can understand the range of data, rather than one number for a truer read. For example, if polling finds that 35% of people use their phones to listen to music and the margin of error is at 5%, the statistic is then expressed as 30 to 40%.
Accurate polling requires using the correct methodology. This involves calculating the margin of error to gather more precise findings. Being able to calculate the margin of error helps researchers pinpoint the degree of variability to expect around responses. This will help gain more accurate insights — the kinds that make accurate predictions.
Avoiding Polling Biases
Regardless of how researchers choose to conduct polling, biases exist inadvertently. In order to disprove the myth that polling doesn’t work, you ought to understand the various biases that you are sure to encounter in the polling process.
Avoiding these biases will help refine your polling efforts. Most importantly, using the proper polling software will help you avoid these biases by way of its capabilities. Here are the most common biases to avoid and how an online polling tool can help you circumvent them.
Sampling Bias
Also called the sampling error, as aforementioned, sampling bias arises when only specific portions of a population take part in a poll. Sometimes, leaving out certain segments, or only polling one is intentional, as it may be part of a targeted effort towards one segment of a target market.
But when it’s not, it creates polling results that don’t accurately reflect all the views of the segments that make up a population.
To stamp out sampling bias: use polling software that allows you to zero in on your audience, with multiple subcategories. Make sure the software allows you to add quotas on each subcategory; that way you won’t miss the respondents who belong to this category. If you want to study a wide group of people, opt for a tool that allows you to incorporate multiple audiences.
Non-Response Bias
This bias refers to the inadequate responses or a low response rate from the respondents who you’re targeting. This can include customers who have made purchases from a long time ago or those who simply do not wish to take part in polling research.
To stamp out non-response bias: Make sure the timing of the survey is not too far away from an interaction with your brand, such as a chat, a call with a customer service agent or a digital experience. You can also send it through various ways of distribution such as via a web page, social media or email.
The proper polling survey can remedy this without trouble. This is because this kind of software (the right kind, that is) should be equipped with a response-generating capability. This will ensure that not only is your poll sent out but that it doesn’t stop making the rounds online, until it receives the preset amount of responses.
Often, the software achieves this with quotas and an option for the total number of completes.
Survivorship Bias
This type of bias emerges when your polling is only completed by retained customers, clients and longstanding employees. This kind of bias is present specifically within a business survey. It gravely limits your results to people who generally have a favorable opinion of your business. Their opinions are going to differ in a number of other ways from customers who churned or bounced.
To stamp out non-response bias: software can wipe out this bias with the use of screening questions. These allow researchers to ask for specific questions, as they would in the questionnaire portion of a survey; however, the answers to these questions qualify or prevent a respondent from taking part in a poll.
A potent online polling tool will include several screening questions so that you can diversify your survey respondents.
Acquiescence Bias

This bias occurs when respondents repeatedly and consistently answer with positive responses or connotations. This can arise due to boredom, so rather than entirely reading a question and thinking about it, respondents just answer with “yes” by default. This can also come about out of politeness or fear of retribution in non-anonymized surveys.
To stamp out acquiescence bias: Keep surveys relatively short and ensure your questions and answers are
The best way to minimize the chance of acquiescence bias is to use thought-out questions and answers. You should avoid yes or no questions for this purpose as well.
Polling software is your best bet to clamp down on this bias, as it allows you to create scaled questions. This gives respondents a diverse set of answers, so they won’t feel that the answer they have in mind simply isn't there and then resort to the positive or “yes” answer. A strong polling tool will allow you to create a wide variety of scaled and ratings surveys such as the NPS, CSAT, CET and other such surveys.
Testing Your Marketing, Market Research and Other Business-Related Campaigns
Polls have a bad rep, especially those of the political variety. However, a well-built polling software can overcome any challenge present in market research, which includes gathering responses that are accurate to a specific population.
Aside from making predictions, polling software is also useful for many other market research needs, such as testing the images and messaging of an advertising campaign that’s underway, or seeing if new product releases have been useful for your customer base.
At any rate, it is crucial to pay heed to the features of the software you seek to use. These should empower your research and help you avoid skewed results and other pitfalls.
You should also bear in mind the various biases that exist within polling and keep track of the margin of error of any poll. When you couple these practices with robust polling software, you will be on the right track towards obtaining bias-free information that accurately reflects the thoughts of your subjects.
Frequently asked questions
What is polling software?
Polling software is a type of computerized platform that is used to collect feedback, usually in real-time, from a wide range of people. Polling software is most frequently used to predict the results of elections.
What is a sampling error?
A sampling error is a deviation between the sample group and the actual population. Sampling error occurs when the sample does not represent the entire population or is biased in some way.
What is a margin of error?
A margin of error is a statistical measurement that predicts how many percentage points the results of a sample may differ from the actual value when considering the entire population.
How can sampling bias be avoided?
Sampling bias can be minimized or avoided by using polling software that allows you to target an audience with multiple subcategories or multiple audiences.
What is non-response bias?
Non-response bias is a type of bias that occurs when certain people cannot or will not respond to a survey for a unique reason that separates them from the rest of the population.

How Surveys Help Increase Customer Lifetime Value
How Surveys Help Increase Customer Lifetime Value
Customer Lifetime Value (CLV) is a sweeping metric that helps brands both keep track of and maintain their consumer loyalty. This concept fortifies customer retention, which is central to keeping any business afloat.
In fact, customer retention — which provides a continuous flow of business — is more sustainable for business growth than customer acquisition, as it costs less to retain customers than to acquire new ones.
As the Harvard Business Review revealed, it costs 7 times more to acquire a new customer than it does to retain a current one. Thus, businesses should prioritize maximizing, or at least maintaining a steady upkeep of their customer retention.
So where does the Customer Lifetime Value fit into this? This article explains what the CLV is, how it helps on the consumer loyalty and customer retention fronts, along with how surveys can help increase it.
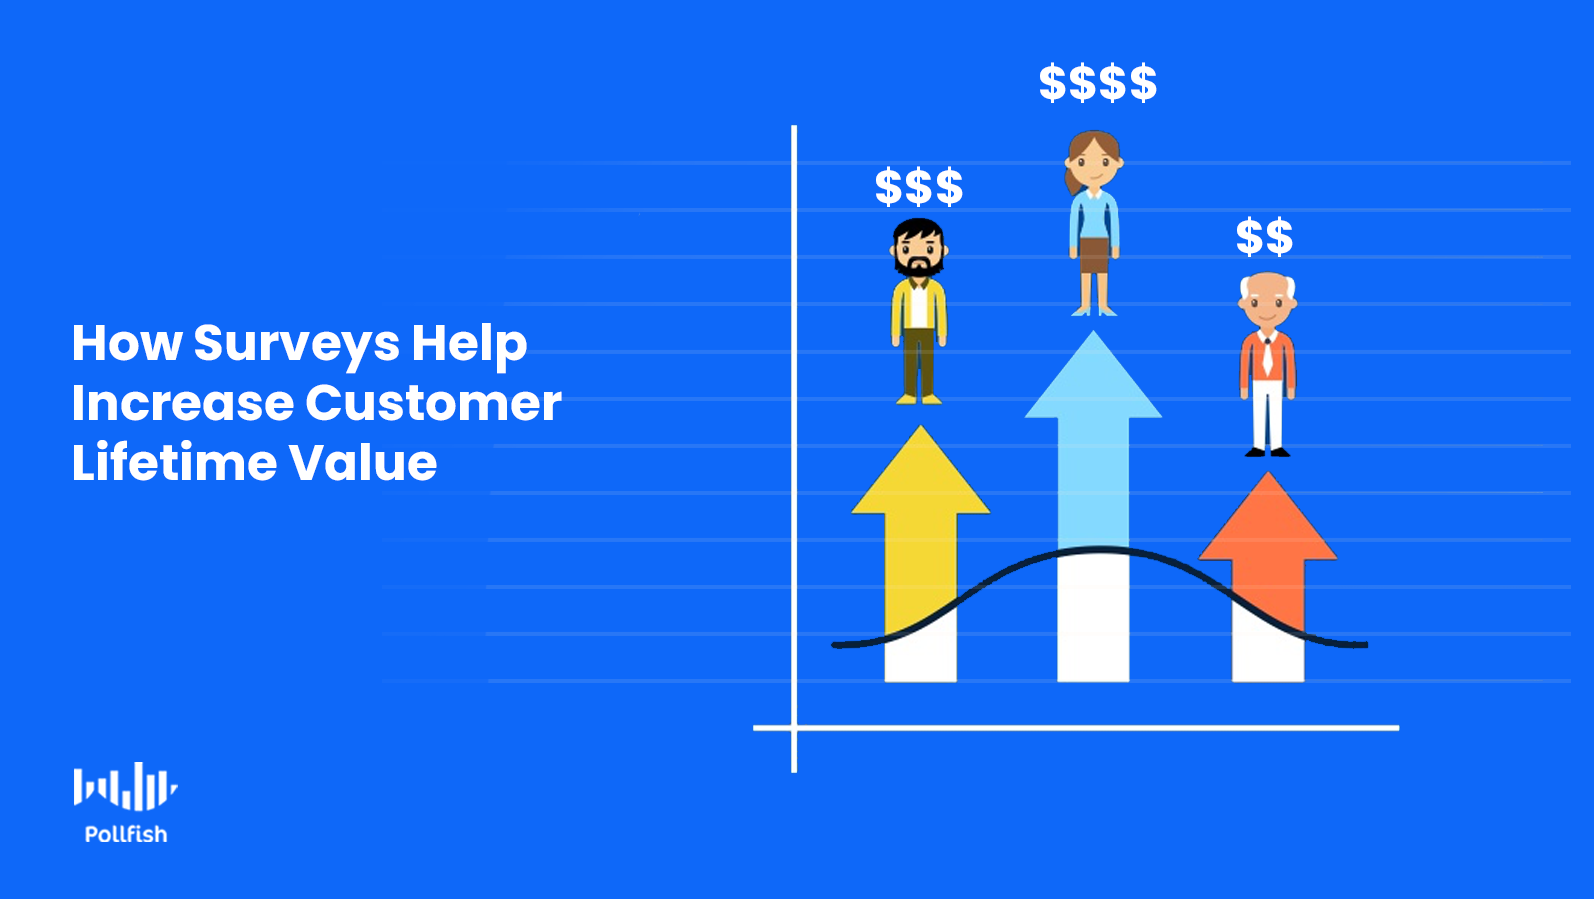
Defining Customer Lifetime Value
As its name indicates, CLV is a statistic that measures the value of a customer in relation to a business. This metric does not merely gauge a customer’s value by their purchases; rather it measures their worth during their entire relationship with the company.
As such, customer lifetime value presents the total monetary value a customer will bring to a business during their patronage with the business throughout their lifetime.
Understanding the CLV of your customers, especially when taking their market segments into consideration, helps brands grasp which segments are most useful to their company. CLV therefore allows companies to focus and better market to their most valuable customer segments.
There are more critical reasons as to why brands should monitor their customer lifetime value, as increasing it gives rise to better financial performance.
The Importance of Monitoring and Increasing CLV
It is crucial for businesses to regularly observe the customer lifetime value of their patrons on several accounts. First off, the CLV provides a concrete dollar amount to the worth of customers and it does so in terms of a customer’s long-term relationship with the company.
With this intelligence, brands don’t have to guess how much in total a customer will contribute to their business. As far as customer retention is concerned, the CLV divulges whether certain customers will make repeat purchases.
Businesses can use this metric to determine how much to invest in their customer retention efforts.
While certain customers (those in certain segments of a target market) will show promise with a high CLV, others will require more marketing campaigns in order to incite retention.
It is therefore best for businesses to increase their CLV, as a high CLV indicates loyal customers, i.e., those who will continue to buy from a particular business. Alternatively, a low CLV is a marker of passive customers, those who have made one purchase and will be more difficult to retain.
As such, this metric allows brands to develop strategies around particular customer segments and individual customers in order to foster customer retention.
Furthermore, monitoring CLV enables brands to understand how their UX and CX (customer experience) efforts have been faring. Perhaps a brand introduced a new feature to its website, a new customer support training program or a new advertising campaign to increase customer retention.
The CLV helps brands understand how those efforts contributed to customer value.
How to Calculate Customer Lifetime Value
Customer lifetime value is relatively simple to calculate. However, there are two ways to approach this unit. These are known as the historic CLV and the predictive CLV.
These calculations involve incorporating the different aspects within a customer relationship, which includes customer revenue, acquisition costs and duration. Here are their differences and calculations:

Historic CLV:
This calculation involves looking at the sum of all the profits of a customer’s past purchases. The final amount is a number derived from existing customer data based on a previous time.
Historic CLV is considered the simpler CLV computation, as it exclusively focuses on what a customer has spent on a business in the past. (Hence the name “historic”). Using the simple historic method is most apt in circumstances in which variables remain the same. Ex: Buying a $20 kit from the same brand for 3 years, in which case, the CLV is $60.
The formula:
Customer revenue per year multiplied by
the length of the relationship in years minus
the total costs of acquiring/serving the customer = simple historic CLV
Example: Yearly revenue of Customer #1= $200
Relationship duration = 10 years
Cost of acquisition = $50
Cost to serve = $50 per year ($500 over 10 years)
Calculation:
$200 x 10 = $2,000
$2,000 – $550 = $1,450
CLV for Customer #1 = $1,450
Traditional CLV:
Aside from the simple historic, CLV formula, there is the traditional customer lifetime value formula. This is suitable for customer revenues that don’t remain flat year after year. As such, these require adding in those additional changes in the customer relationship. That is where the traditional customer lifetime value formula becomes handy.
Before you use the formula, you’ll need to understand some of the variables/terms that make it up. Here are the explanations behind each.
GML: The gross margin per customer lifespan, this is the profit a business can expect to earn during the average customer lifespan (the revenue minus the costs).
R: The retention rate, which is the percentage of customers who stay with a business over a fixed period of time (instead of the ones who churn during that time).
D: The discount rate, which is a percentage that accounts for inflation. It is usually at 10%.
The formula:
GML multiplied by
(Retention rate divided by (1+ Rate of discount – Retention rate) = traditional historic CLV
Example: A business’s GML = $1,900
Its customer retention rate = 70%
Its discount rate = 10%
Calculation:
1 + 0.70 – 0.1 = 1.6
0.70 / 1.6 = 0.4375
0.4375 x $1,900
CLV = $831.25
Predictive CLV:
This allows brands to forecast how much profit a customer is going to generate for their business over the course of their relationship with the customer. This is known as the more complete method of computing the CLV.
This calculation combines customers’ behavioral patterns with their transaction history as a means to discover 2 components: the current customer value and the value will alter as time progresses.
The accuracy of this method increases as brands gather more data in regard to customer transactions and behaviors.
Here are the explanations behind several of the variables used in this formula:
Average Gross Margin: The total sales profit a business earns after subtracting only the production costs.
Average Customer Lifespan: The average time a customer makes their first and last purchase with a company. For example, if the time between a customer’s first and last order is 100 days, then the average customer lifespan is 100.
The formula:
((Average monthly transactions * Average order value) Average gross margin) * Average customer lifespan divided by
Number of clients for this period = Predictive Customer lifetime value
Example: A business’s average monthly transactions = 30
Its average order value = $35
Its average gross margin: 25%
Its average customer lifespan= 5
Number of clients during this period:100
Calculation:
((30 X $35) x 25%)x 5) / 1000
CLV= $105,000
How Surveys Help Boost Customer Lifetime Value

Conducting market research will allow you to understand your customers and your industry at a more in-depth level. Secondary research is especially helpful for discovering trends within your niche, along with the marketing tactics your competitors are using.
However, it is primary research that grants businesses with a deep understanding of their customers. Surveys are the most optimal method for understanding the needs of your target market— this includes studying your existing customers, along with those in your customer base that haven’t patronized your business yet.
This is because you can gather data on virtually anything through survey research. Additionally, there are numerous survey types and methods. For example, if you need to measure customer loyalty, you can do so with the Net Promoter Score Survey or with a retrospective survey.
Moreover, an online survey tool can help you conduct market segmentation, so that you’ll understand the different segments of customers that make up your target market. You’ll need to know these when measuring your customer lifetime value.
When you constantly track the needs of your most valuable customers with surveys, you’ll understand how to serve them better, whether it be via product satisfaction, customer satisfaction, user experience (UX) or any other aspect in their customer journeys. By improving their customer experience (CX), you will, consequently, increase the CLV of your customers.
Questions to Use to in Surveys to Increase CLV
In order to improve your customer lifetime value, you’ll need to create surveys with content that is most relevant to your target market, with special regard to existing customers. After all, businesses ought to measure their CLV as a means to increase their customer retention.
The following includes pertinent questions to boost CLV. You may use them in a number of different surveys.
- What do you feel is missing in [niche, industry, product]?
- How can we better improve this product/ experience?
- What would you like to see in this product/ service/ experience?
- What is the most aggravating thing about buying [a product or service]?
- How can we make the purchasing process more efficient for you?
- On a scale of 1-10, how would you rate this company/product/service?
- What product features would you like to see added in the future?
- If the price wasn’t a factor, which of the following companies would you buy from?
- What would you consider a fair price range for a product/service?
- What would prompt you from buying from [company or product] again and again?
Other Considerations for Improving CLV
Online surveys can power a wide range of market research and marketing endeavors. To reap the maximum value out of surveys for your customer lifetime value, you ought to apply other best practices specifically aimed at increasing CLV. These include creating loyalty rewards programs, which incite customers to buy continuously to earn points that they can later apply towards some reward (a freebie or discount).
Additionally, businesses should consider revamping their customer relationship management. This concept is critical in CX, as a bad experience with a support agent will tarnish their opinions towards your business. Consider the CRM system you use, along with the training your representatives receive. If you optimize on these fronts, you’ll improve your CX, and by extension, your CLV.
Remember to pay special attention to customers with the highest CLVs. These tend to make repeatedly larger purchases. Retaining this group ought to be your first priority in terms of customer retention.
These customers are your most profitable; keeping them content with your business will provide the strongest stream of sales. You’ll need to study their motivations, behaviors and desires, which you can easily achieve with the help of online surveys.
Frequently asked questions
What is the Customer Lifetime Value (CLV)?
Rather than measuring a single transaction, the customer lifetime value (CLV) is a metric that defines the value of a customer throughout their entire relationship with a business.
What are the three approaches used to calculate customer lifetime value?
The three ways to calculate CLV are known as historical CLV, predictive CLV, and traditional CLV.
How is historic CLV measured?
Historic CLV is measured by calculating the total amount of money that a customer has spent with a company in the past, and then subtracting the total costs of acquiring and/or serving the customer over that period of time.
What is predictive CLV?
Predictive CLV is a method of forecasting how profitable a customer will be over the course of their relationship with the business. The value is calculated by studying behavior patterns and purchase history in order to arrive at their CLV.
How can surveys improve customer lifetime value?
Surveys can provide a better understanding of your most profitable customers. By continually tracking their needs, you can better serve and retain them, thereby improving customer lifetime value.
Incorporating the Translate Survey Feature into Your Surveys
Incorporating the Translate Survey Feature into Your Surveys
![]()
![]()
With this feature, you can translate a survey that you already conducted in English (or other languages) into your target languages. This new feature allows you to translate surveys that are either underway (running but not complete) or have already been completed.
It will enable researchers to build, store, and view their survey results in different languages as a means to help their analysts across geographical regions.
This Pollfish School article will teach you the aspects of this new feature, along with the steps required to activate it.
Key Aspects of the Translate Survey Feature
As its name implies, the “Translate Survey” feature translates surveys into other languages. This is especially useful for businesses and organizations that need to share survey research across countries.
There are several capabilities that Translate Surveys offers, along with certain characteristics that this feature does not support. The following provides an in-depth account of what the Translate feature supports and does not.
What Translate Surveys supports:
- Elite accounts
- Translations from Google Translate
- Supports ALL the languages of Google Translate — 109 languages in total!
- There is no limit in how many translations you can add per survey.
- Surveys that are currently running or have reached the preset amount of completes.
- Exports of results as a PDF, Crosstab, Excel sheet or SPSS.
- Results are updated in real-time.
- Can be used in BigQuery if integrated with this PaaS.
- Researchers can add their own translations manually if they prefer in on both questions and answers in editing mode.
- Can view each edition of the translated survey via the dropdown of translated languages within the survey’s dashboard.
- Can translate a question that contains a recall of a previous question’s answer(s).
- Can translate a question with Carry Forwarded answers.
What Translate Surveys does NOT support:
- Basic accounts
- Translations of the drafts
- Canceled or failed surveys
How to Incorporate & Use the Translate Surveys Feature

Now that you know the attributes and limitations of the new Translate Survey tool, let’s get acquainted with using it. The following provides step-by-step instructions on how to incorporate the feature in your surveys and how to use them.
To Activate the Translate Surveys Feature:
- In the Pollfish dashboard, go to “All” and find the survey you’d like to apply the Translate Surveys feature to.
- Click on the general dropdown menu of your designated survey (activated by clicking on the three dots beside it).
- Select Translate Survey. This will open up the survey.
- On the right-hand side in the middle of the screen, select the language you would like to translate the survey to by typing it into the field.
- All languages that begin with the letters you typed in will appear as options.
- You can now translate the questions and multiple choice answers in a twofold way:
- By typing in the questions/answers in their corresponding fields manually in the selected language OR
- By clicking on the upper right button called Google Translate, in which Google will provide the translations.
- If you need to add more languages to translate the survey, click on the + in the box on the right side, adjacent to the box above with the first language you chose to translate the survey to.
- Click “save translation” to save the added translations to your survey.
To find the translated results and make exports:
- Go to the Pollfish dashboard and find the survey on which you applied the Translate Surveys feature.
- Hit the three-dot button and select “See Results,” which will trigger a new tab with the results of the survey, translated in the language(s) you selected.
- The top-left box will feature a dropdown with the languages you used with the new Translate Survey feature. Select the language you would like to view your survey in.
- Scroll to the bottom of each question to select the buttons to view the results as a bar graph or pie chart.
- At the top right-hand corner, click on “Export Results.” This will prompt a pop-up in which you can choose the language of the survey you need to download, along with the kind of export you need.
Other Considerations for the Translate Surveys Feature
There are a few other considerations to take note of, including expanding on some of the topics aforementioned.
First off, you can export the surveys to Big Query — only in their translated views. As a side note, after concluding the Translate Surveys process, a three-letter code will appear in the upper left corner of the translated survey in the dashboard.
Although this feature won’t translate the drafts it can be used as an internal tool in the dashboard, one that allows you to create layers on their surveys in other languages.
How to Conduct Market Segmentation with Survey Research
How to Conduct Market Segmentation with Survey Research
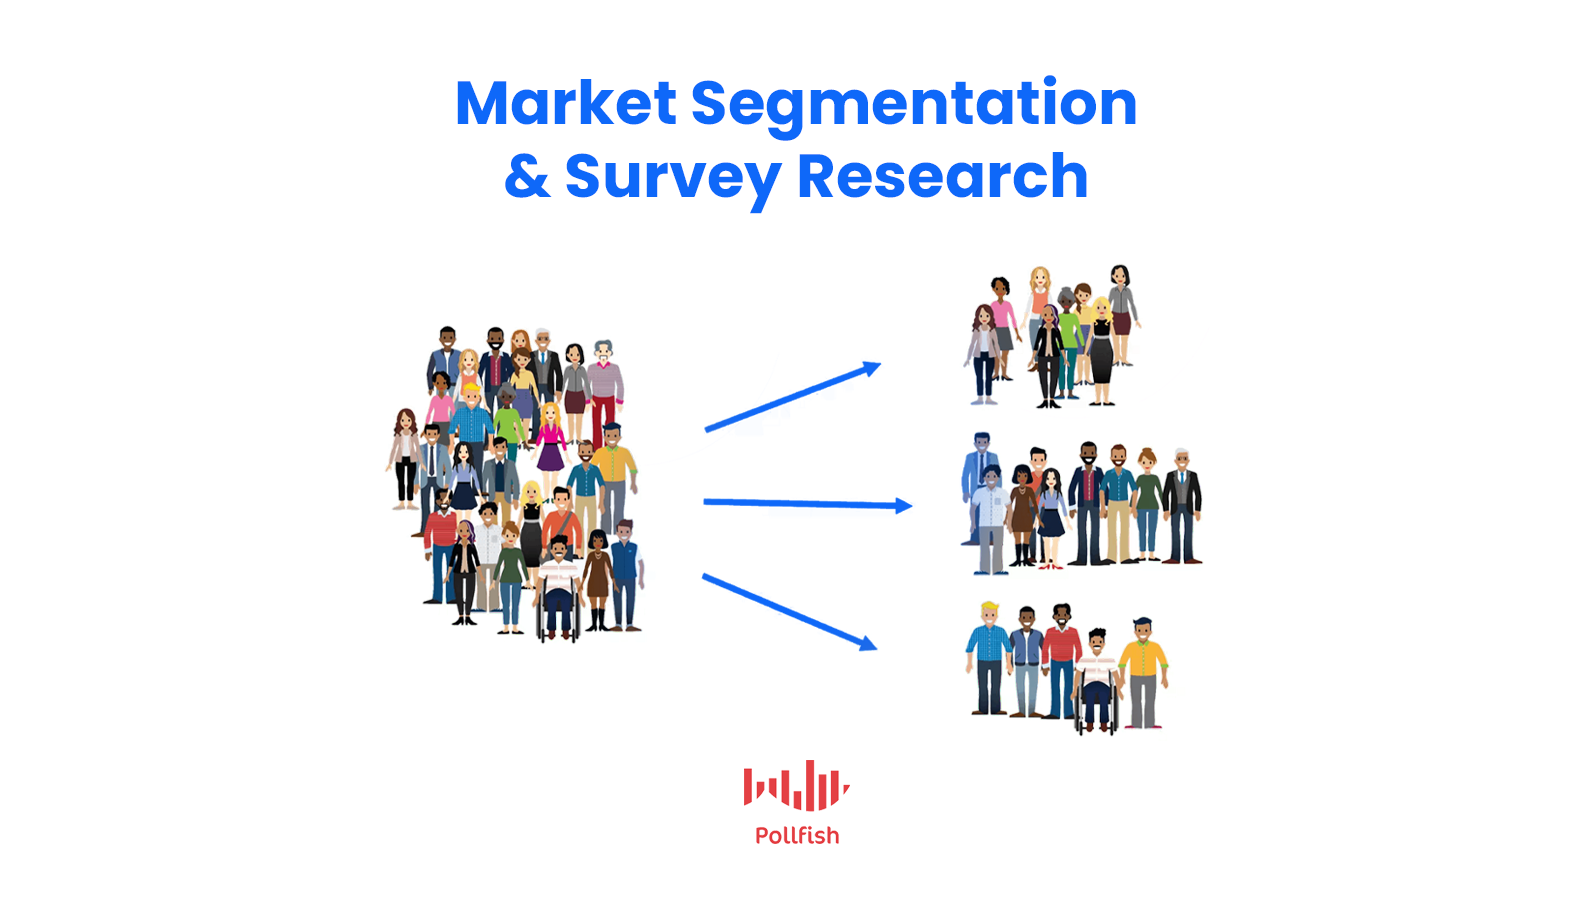
In the world of an ever-increasing need to be customer-centric, conducting market segmentation is an absolute necessity. That is largely because customer experience (CX) has set the stage for business success.
86% of consumers have said they would pay more for a better customer experience and 89% said they would stop doing business with a brand that delivers a poor CX.
However, despite these stark outlooks, only 1% of brands consistently meet these expectations, according to consumers. Clearly, there is much work to be done on the customer experience and customer-centricity fronts.
To create optimal customer experiences, brands must profoundly understand their target market. Although this may seem to be a demanding feat, market segmentation provides the missing pieces to the puzzle.
Although it exists as a separate discipline from survey research, when you pair market segmentation with survey research, your brand is armed with a wealth of knowledge on how to properly cater to your customers' needs.
This article will explore how to do market segmentation in survey research.
What is Market Segmentation?
Market segmentation is a sub-discipline within marketing, in which you divide your brand’s broader target audience into smaller segments or subsets, based on various criteria such as demographics, behaviors, needs, opinions, interests, and other standards to better categorize your target market.
The better you understand your segmented audience, the more effectively you can target your consumers for various business needs, such as product development, sales, brand awareness and most importantly, customer retention.
For example, market segmentation allows you to understand how to improve your advertising based on segments such as low vs middle income, men vs women, those who enjoy online shopping vs those who don’t.
The Benefits of Market Segmentation
This practice offers more benefits than the ones listed above. The contributions of each of these benefits weed out unproductive marketing practices, thereby saving you time and money. Here is a list of the several advantages of market segmentation.
- Gather pain points on specific segments. These pain points are not present within the entirety of your target market, proving the need to segment it. When you segment your consumers, you’ll understand each of their issues on a more intimate level, allowing you to resolve them faster (and know of their existence).
- Convey stronger marketing messages. This practice allows you to avoid coming across as too vague and impersonal. Instead, by understanding your different segments, you’ll be able to create more specific and personalized messages, the kind that speak better to certain groups.
- Avoid making the mistakes of your competitors. Your competitors aren’t going to admit their shortfalls at any time, unless they were able to bounce back ten times stronger. As such, you can use market segmentation to understand how particular marketing, offerings or experiences fell short among particular customer segments.
- Pique the interest of high-quality prospects. Well-targeted messages will lure in the most likely segments to increase sales in your target market. These are the consumers who don’t merely click on your ads, but actually make purchases
- Gain a larger reach by using the right channels. Segmentation helps you uncover the best digital (and other types) of channels through which to market to your segments. Some segments may prefer content, others may attend events, while others are heavy social media consumers. Understanding these preferences and being able to assign them to certain segments is key. You wouldn’t want to spend resources on a seldom-used channel by your segments.
- Identify niche markets. Finding particular segments is known as niche marketing, meaning that your product/service is not necessarily niche, but certain segments of your target market form their own niches. Segmentation enables you to market to these niche audiences, so that you can create new products/services for your underserved segments.
- Accumulate brand loyalty. Brand loyalty is ever important, as it is a pillar of a profitable business; it virtually guarantees that your target market will continue buying from your brand and think of your brand first when they need something from your industry.

How to do Market Segmentation
Before you begin on survey research, which is a crucial stage in market segmentation, you need to carry out the segmentation process at its basic levels. This means understanding all the major steps that make up this practice.
The following steps provide an overview of how to do market segmentation. Note that this article covers segmenting your market by four types in the following section.
- Study your market. Conduct market research via secondary resources and the market research survey. What you should seek:
- What’s the market demand for your product/service? Is it large or too small (niche)?
- How does your brand fit into your overall market?
- Find the proper type of segmentation. Market segmentation is conducted through 5 categories of study: demographic, psychographic, geographic and behavioral (explained in the next section). Choose which your brand needs to study the most; you don’t need to focus on just one. Instead, you can do market segmentation with a few or even all of these criteria.
- Continue doing market research. When you settle on which type of segmentation you are going to conduct, you’ll need to perform it via market research. You can do so by conducting more secondary research and implementing primary research as well. For the latter, focus on questions that relate to the above categories. You should create more personalized ones as you come to grips with your segments.
- Categorize and develop your customer segments. Gather all your research based on which of the 5 types of segmentation you use, and all the secondary and primary research you garnered. Group customer types into their various commonalities, as part of the 5 methods. Group them into segments and personas.
- Create new marketing strategies accordingly. Test them out on your newly found customer segments. This is not only beneficial for general marketing purposes but can lead to finding new personas within your segments.
The 5 Types of Market Segmentation
The previous section presented a general rundown of the market segmentation process. The core of this process, as its name implies, is the segmenting portion, i.e., step two. This is because market segmentation is divided into 5 sorts. These classifications will help you understand you to better market to and serve your segmented customer base.
Demographic Segmentation:
This segmentation type creates groupings of customers based on their demographics. These include categories such as gender, age, education, race, ethnicity, occupation, income level et al. Demographics is the most prominent and widely-used type of segmentation. Many products have been developed simply based on and for particular demographics.
Geographic Segmentation
This type of segmentation focuses on locations such as countries, territories, states, counties, cities, zip codes and others. Although it can exist as a demographic category, it is also regarded as its own type of segmentation. This segmentation is critical for marketing, as customers within different geographical regions have their own sets of needs, preferences and limitations.
This segmentation is also of great use to market research, especially specific types, such as real estate market research or quantitative research, when you need to make generalizations on segments in particular locations.
Behavioral Segmentation:
This divides markets by behaviors and behavioral patterns. The focus is on actions such as consumer purchases, loyalty, lifestyle, usage of products/services in your industry, device preferences and brand interactions. Conducting this segmentation will inform you on how the different subsets in your target market behave in relation to your brand and your industry at large.
These behaviors are crucial to know so that you can create a more tailored marketing approach and better user experiences. That is because this segmentation allows you to glean how your customers make purchases and by how much.
Psychographic segmentation:
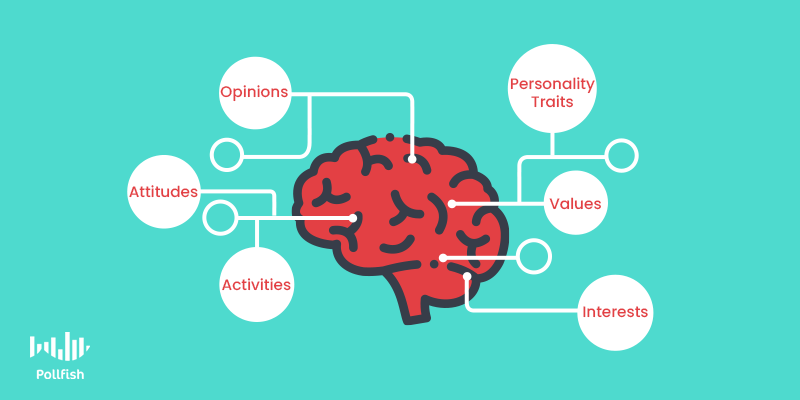
This categorizes people based on the psychologically driven aspects of behaviors. As such, the target market is divided on the basis of certain opinions, values, personalities and inclinations. Psychographic segmentation is the type of classification that not only allows you to assign segments to groups of people, but to pick their brains.
That is because you can create surveys centered on each of these segments to understand the intentions and feelings of a particular consumer group. This segmentation is especially useful in qualitative research, as it helps you pinpoint trends in opinions and uncover the causes behind actions.
Firmographic Segmentation
Comparable to demographic segmentation, this kind factors in demographics, except the kind that zero in on organizations. As such, this segmentation method would study aspects such as company industry, type, size and employee count, among others.
This is useful for a number of market research campaigns. You can use it to aid competitive analysis along with understanding your consumers from the perspective of their employment. Most of all, this segmentation is crucial for B2B businesses as it helps you discover how to market to other companies. You would certainly need to know how to divide this customer base into smaller markets.
Using Survey Research for Market Segmentation
Market segmentation is a clever practice for market research and marketing purposes. This is because it allows you to narrow your focus in advertising, social media and other marketing campaigns, to a smaller group of people who are nonetheless a part of your target market, the consumer group most likely to buy from you.
This methodology should therefore remind you that you should not merely focus on broad campaigns when addressing your target market. You should keep in mind that this market tends to be wide-ranging, thus has its own subsets that differ from one another.
In addition, survey research, as laid out in several above examples, is key to deploy when conducting market segmentation. But it is also crucial to employ after conducting market segmentation, as surveys allow you to dig deeper into the minds of your consumers.
Market segmentation (led primarily by survey research), like other marketing activities, must be acted upon. For example, if you were able to segment your target market into several categories, how will you know how to give them precisely what they need? Survey research will help you find out, not to mention help you avoid unproductive marketing campaigns.
Frequently asked questions
What is market segmentation?
Market segmentation is the process of dividing a brand’s audience into smaller groups (segments) based on more narrowly defined characteristics of the group.
What is the purpose of market segmentation?
Market segmentation is performed to help a company better understand its customers or potential customers by focusing on the varying needs of each specific segment.
What are some of the applications of market segmentation?
Market segmentation can be used to understand the needs of each segment in order to improve products or services, create more effective marketing campaigns, identify new markets, encourage brand loyalty, explore the competition, and expand the reach of marketing channels.
What is demographic segmentation?
Demographic segmentation is used to create market segments based upon the demographics of existing or potential customers.
What is geographic segmentation?
Geographic segmentation is used to create market segments based upon location. The location size may be small (e.g. neighborhood or specific zip code) or large (e.g. state or country).

Fortifying Your Market Research with the Qualitative Survey
Fortifying Your Market Research with the Qualitative Survey

Qualitative research is critical for performing market research. Using what’s known as the qualitative survey is the most potent instrument researchers can apply to garner data for this kind of research.
It’s important to be able to distinguish between qualitative and quantitative surveys when delving into either of these main types of survey research methods. As such, this article will focus on the qualitative survey, its corresponding research method, best practices and other considerations worth being mindful of.
With these key insights, you’ll be able to get your qualitative research up in running in no time.
Defining the Qualitative Survey
This type of survey is characterized by its adherence to qualitative research, that is, it seeks to gain descriptive insights on a topic, rather than measuring it.
A qualitative survey is predicated on digging into the details behind a topic. It also seeks to find causality and motivations. This provides details around happenings, opinions, beliefs and sentiments.
In short, it helps brands understand their target market’s psyche, as opposed to measuring for prevalence and other metrics.
This kind of survey is far less structured than a quantitative survey; it also makes more use of open-ended questions. While it provides a great deal of knowledge, this survey data can be more difficult to analyze.
When to Use a Qualitative Survey in Your Research Endeavors

A qualitative survey can be used in the beginning of your market research, or as a way to complement research you’ve already begun conducting. There are specific points during your market or survey research that you can best tend to with a qualitative survey. Here are several such cases:
- Mapping out a hypothesis: A qualitative survey is an excellent way to both form a hypothesis and test it. As you begin your research process, this survey can help you find the most glaring issues and desires your target market has on their minds. These can help you form hypotheses that you can prove through quantitative research. You can also test your hypotheses with follow-up qualitative surveys.
- When numbers and scales aren’t enough: Usually, a scaled survey isn’t enough — neither is one with visual ratings (hearts, stars, etc.). A qualitative survey can benefit your study to completely flesh out the themes, sentiments and general makeup of an occurrence.
- Finding the “why” behind a phenomenon: You can administer a qualitative survey for this point in the middle of your research process. For instance, if you’ve run several quantitative surveys or even a qualitative survey, you will have gathered insightful data on the big picture of a topic. But there may be a few missing pieces, especially regarding the why behind an occurrence or firmly held belief. That’s where you would do further probing with this type of survey.
- Discovering Latent Details: Although these details may be covert, they can help crack a customer experience (CX) or employment satisfaction puzzle. Whereas quantitative surveys help unlock the number of times something occurs or if it occurs in the grand scheme of things, qualitative surveys can help bring hidden details into light. By asking qualitative questions, you can uncover a gold mine when it comes to pleasing customers, as you’ll understand them in greater depth.
- Putting together the final stages of your market research: Often conducted after gathering quantitative findings, you can use a qualitative survey to wrap up your research. There may be times in which you need more details to understand the results of a previous survey. Or there may be some key aspects that you feel you need to find to complete your research. The qualitative survey is a good closer for these needs.
How to Get Started on Formulating a Qualitative Survey
You may have several ideas on the direction you desire your qualitative research to take. When opting for a qualitative survey, there are certain tips you can stand to learn. The following presents certain key practices to take into consideration when embarking on this survey method.
- Find a strong online survey platform to execute your research. Here are a few things to look for in online survey tools.
- Discover the chief campaign of your qualitative research needs. Are you looking to improve your branding? Do you need insights on a specific industry, such as the technology industry?
- Then, find the main need for this application. Or perhaps, see if there are some missing qualitative data you would need to acquire.
- Create an overall theme for a survey, or for multiple surveys.
- Begin with one survey at a time; first, gather the target audience of the survey. You can appeal to your general target market, or to a segment of it.
- Draft your questions and get observations/commentary from other researchers or colleagues.
- Launch your survey and carefully read over your responses. Cross-reference the answers with quantitative surveys, especially if your quantitative survey is underpinned by quantitative research you’ve already begun.
- Iterate with another survey if need be.
- Analyze your responses to find motivations and find deeper insights into themes and opinions.
- Layout a plan of action for your broader campaign based on your analyses.
- Take small steps; don’t rush (unless you’re facing a crisis). Start implementing some of the changes or accommodations for your target market. Or, finish your research with a presentation of your discoveries.
Questions and Surveys to Use in a Qualitative Survey
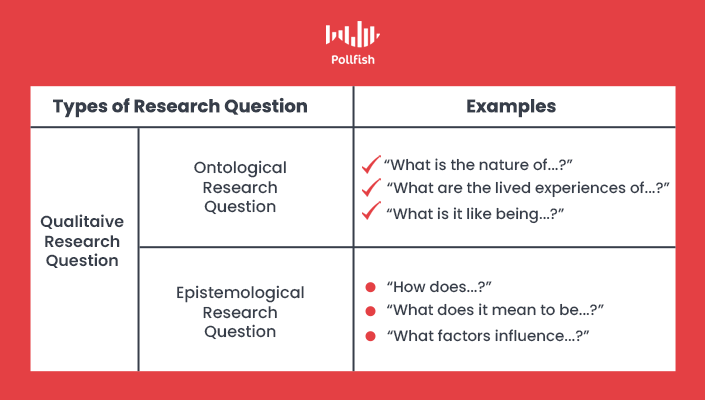
A qualitative survey can exist in a variety of formats. We’ve covered a wide variety of survey research methods and survey types themselves. Since qualitative studies can be applied across a number of survey types, you ought to know how to orient your questions around several of them.
Here are a few question examples of qualitative surveys. You can also add qualitative elements to surveys that are not specifically geared for qualitative research.
Net Promoter Score (NPS) Survey Questions:
Along with the Ultimate Question, aka the main NPS survey question, use the following to extract qualitative data. (This question typically asks respondents on a scale of 1-10, how likely they are to recommend a company to others.)
- Why is it that you’ve ranked us with this score? [open-ended]
- What do you like the most about our company? [open-ended]
- What services or products do you enjoy the most from our brand? [open-ended or multiple choice]
- What are some of the things that we can do to improve how you view our brand?
Customer Loyalty Survey Questions:
Consumer loyalty is a widely-encompassing quality that can be evaluated in a number of market research studies. This includes using the Repeat Purchase Rate and Customer Lifetime Value metrics. Additionally, the notion of customer loyalty has several of its own surveys.
- Do you consider [brand] to be high-quality? Why or why not? [multiple choice and open-ended]
- Would you return to make more purchases from us? Why or why not? [multiple choice and open-ended]
- Why have you bought [x number of times, carry forwarded from previous numerical question] from us? [open-ended]
- Why are you [either considering yourself a loyal customer or not, piped from previous yes or no question]? [open-ended]
Product Satisfaction Survey Questions:
- Which features do you find most useful from this product? [multiple choice]
- How would you rate the product’s ease of use and why? [open-ended and multiple choice]
- Have you experienced any issues with the product, if so what are they? [open-ended and multiple choice]
- How has your general experience been with our product? [open-ended]
Retrospective Survey Questions:
Although these surveys are typically used in the fields of medicine and psychology, they too can be applied to the business market research sphere. Used in retrospective studies, these surveys scrutinize events that have taken place in the past (including the distant past).
- Which aspects in your [in-store, over the phone or online] experience have contributed to the way you shop today? [open-ended and multiple choice]
- How long have you been taking part in/buying [habit, product or brand]? [multiple-choice]
- Have you used [product] in the past and how has it shaped what you currently use for your [niche] needs? [open-ended and multiple choice]
- Why have you bought/chosen from [brand/product] for [x number] of years/months? [open-ended]
Event Evaluation Survey Question Examples:
- What did you like the most about the event? [open-ended]
- What experience stuck out the most to you and why? [open-ended or multiple choice]
- What could we do to improve your experience? [open-ended]
- Is there anything else you would like to tell us about the event? [open-ended]
Expanding Your Research Needs
Although the qualitative survey can help you unearth the “why” and “how” in your research on your target market, you’ll find that much like with quantitative surveys, it too can help you uncover more on the “what.”
The difference is that this type of survey allows you to get more granular and in-depth on a subject matter, whereas quantitative surveys paint a clear picture of its measurements, metrics and other quantifiable data.
Bear in mind that in the aforementioned qualitative question/survey types examples, each survey type is not intrinsically — or solely to be used for qualitative research. In fact, it often includes a mash-up of both qualitative and quantitative aspects.
This is natural in survey research, as both of these surveys and research types work in tandem. As such, make sure to add qualitative questions every now and then to your quantitative surveys. However, if you are looking purely for qualitative research, you can also attempt to conduct an entirely qualitative survey. The online survey tool you choose to apply is your best armor.
Frequently asked questions
What is a qualitative survey?
A qualitative survey is a type of survey that is focused on gathering descriptive insights and exploring motivations or causes for certain phenomena.
How are qualitative surveys different from quantitative surveys?
Quantitative surveys are focused on collecting data that can be assigned a numerical value in order to easily measure or quantify it. Quantitative surveys tend to answer the “what or who,” while qualitative surveys focus on the “why” or “how.”
What types of surveys can include qualitative questions?
Almost any type of survey can include qualitative questions, even if the bulk of the survey contains quantitative questions. Some of the most common survey types to include qualitative questions are the Net Promoter Score (NPS) survey, customer loyalty survey, product satisfaction survey, and retrospective survey.
How can qualitative survey questions help expand your research?
If you have begun collecting data on a certain topic, but have yet to unlock the “why” or “how” behind that data, qualitative survey questions can provide the missing piece. By allowing you to dig deeper into the psyche of your respondents, you can uncover additional information or unexpected responses.
When should qualitative surveys be used?
Qualitative surveys can be used to complete existing research data in order to gain deeper insights. A qualitative survey can help you form a hypothesis, better understand your target audience, and/or figure out why something is happening.