
Diving into the Business Survey for Building Success
Diving into the Business Survey for Building Success

If you own or operate a business, you need a business survey. Although you might know plenty about the intricacies of how your business operates from the inside, that knowledge alone might not be enough to propel your company into its next round of success.
Customer feedback, customer satisfaction, employee morale, upcoming market trends — knowing all this separates thriving companies from businesses that are just one bad decision away from a crisis.
And a business survey is a shortcut to this knowledge.
In this article, we cover how companies use business surveys to operate effectively and without hesitation, and how said surveys inform critical business decisions in today’s fast-paced and uncertain environment.
Defining a Business Survey
A business survey is a survey that allows you to gather data and insights that can be used to enhance various aspects of your business.
Using business surveys, companies can either acquire new knowledge about markets and target audiences while exploring fresh opportunities for growth. At the same, time business surveys can be used to fill the gaps in the existing knowledge of company operations, boost employee performance, and optimize expenses.
Although the data gathered during such research can be used in myriad ways, we recommend setting a specific goal for every business survey to keep your insights focused and actionable.
Applications Of Business Surveys
Due to the high level of customization that surveys provide, business surveys offer a wide range of applications and can be optimized for producing all kinds of value for businesses.
Here are some of the common applications for business surveys:
- Enhancing customer personas. Business surveys allow you to learn more about your customers, their habits, and what they think about your company and products. Studies show that 82% of marketers improved their value proposition using well-developed customer personas.
- Learning more about the new markets. Expanding into new markets and platforms is one of the surest ways to grow your business, but it comes with lots of uncertainty. Business surveys help step into the new territory with more confidence and hard-proof data.
- Increasing customer retention levels. Knowing when your customers are happy with your product is as important as knowing when they are not. Use business surveys to keep track of what your customers think about your products and brand before they start turning to your competition. In addition to that, the mere act of conducting surveys may increase customer retention levels as clients feel more taken care of.


- Improve employee performance. Business surveys can be used to inspect the state of your workforce on several levels via employee feedback: employee motivation, team trust, and management efficiency. With business surveys, you can reveal issues that certain departments experience and address them before the problems affect the rest of the company.
5 Types Of Business Surveys
You can use the following types of business surveys to gain a 360-view of your business, inform your growth strategy, and enhance customer satisfaction levels.
Customer Satisfaction Survey
There are five types of customer satisfaction surveys that allow you to gauge customers’ opinions about your products and company. One of the most commonly used is the Net Promoter Score (NPS) survey, which that checks measures how much your audience is willing to recommend your products to their inner circle.
The NPS survey allows you to segment your audience into three major groups known as detractors, passives, and promoters. The more promoters your business has, the higher will be your organic growth. It’s the other way around with detractors.
Regular customer satisfaction surveys are extremely important in case your business relies on organic growth as they allow you to keep track of how happy your customers are over time and correct your course in case recent decisions stagnated your expansion.
Example question: On a scale of 0-10, how likely are you to recommend our product to a friend or colleague?
Market Research Survey
Market research surveys are a wide group of surveys designed to learn more about the market you currently operate in or gain additional knowledge in case you want to expand into new niches.
These surveys may include demographic surveys designed to gather more data about your current and potential customers, platform-specific surveys such as e-commerce market research, technology market research, market trends research, and surveys designed to enhance various marketing-related activities, e.g. advertising market research
Example question: What are your main social media channels that you use to learn about new products?
Employee Satisfaction Survey
Employee satisfaction surveys are designed to collect information about the general feelings of your employees, their level of motivation, and any roadblocks that might be preventing them from doing their job more effectively.
These types of business surveys are often conducted in companies that want to enhance the performance of their employees or address issues during a transitional period (e.g. company-wide switch to remote work, company buy-out, or a new HR policy).
One of the variations of these surveys is an employee exit survey that aims to determine employee’s reasons for applying for a job or their reasons for leaving the company.
Example question: Are there any roadblocks that currently prevent you from operating at your maximum level of efficiency?
Brand Awareness Survey

Brand awareness surveys aim to elicit customer’s opinions and feelings about your brand.
Brand perception is an encompassing term and may be affected by many factors such as PR-relationships of your company, public stance on local and global issues, and the general representation of your brand in media.
Brand surveys help companies to reveal the current brand perception by their customers and track whether it has been recently affected.
A brand awareness survey can also reveal whether your target market is able to identify your brand, i.e., know of its existence. This is especially important when it comes to differentiating your brand from competitors.
Example question: Which of the following brands have you heard of? (Include your business)
A well-established branding policy has many benefits such as a higher number of positive online reviews, an increase in customers’ trust, and revenue growth.
Example question: Where have you seen or heard about our brand in the last several months?
Product Satisfaction Survey
The product satisfaction survey is closely related to customer satisfaction surveys, but with a focus on your product.
Business surveys that are focused on your product may help you to check whether customers know about your product, if they find your product appealing, discover how your product compares to the competition, and gather quality insights on how it can be improved in the future.
Example question: How long have you used [your product]? Or
What would you like to be improved in [your product]
The Role of Business Surveys In Growing Your Company
There’s no lack of data in our digital age, and often companies are confused and disoriented with the amount of information they gather through various analytical tools and 3rd party data providers.
But business surveys don’t add to this chaos. Instead, they allow businesses to gain a birds-eye view of their whole organization while referring to the most relevant and reliable source of truth: their customers and employees.
Insights gathered through business surveys often allow organizations to organize and enliven previously disjointed sources of data into more coherent and actionable formats.
If you want to see for yourself how business surveys can fuel your company’s growth and obtain trustful and impartial data directly from your target audience, try our market research platform, which makes it easy to create and deploy all kinds of surveys, along with analyzing them in different formats.
Frequently asked questions
What is a business survey?
A business survey is any type of survey that is conducted in order to improve or enhance certain aspects of a business.
What are some reasons for conducting a business survey?
Business surveys may be conducted in order to gain new knowledge about target markets, better understand company operations, improve employee morale and performance, and/or improve a company’s profitability.
What are some examples of business surveys?
There are many different types of business surveys, including customer satisfaction surveys, market research surveys, employee satisfaction surveys, brand awareness surveys, and product satisfaction survey
How can a business survey help a business better understand its target market?
A business survey can provide an in-depth view into customer habits, feelings, and attitudes, which can then be used to develop customer personas. Customer personas allow businesses to understand their customers so they can develop better products, services, features, and market campaigns.
How can a business survey improve customer retention?
Studies have shown that the simple act of conducting a business survey may help improve customer retention rates since customers feel that the business genuinely cares about their needs and concerns.

How to Conduct Market Research for Nonprofits Like a Pro
How to Conduct Market Research for Nonprofits Like a Pro

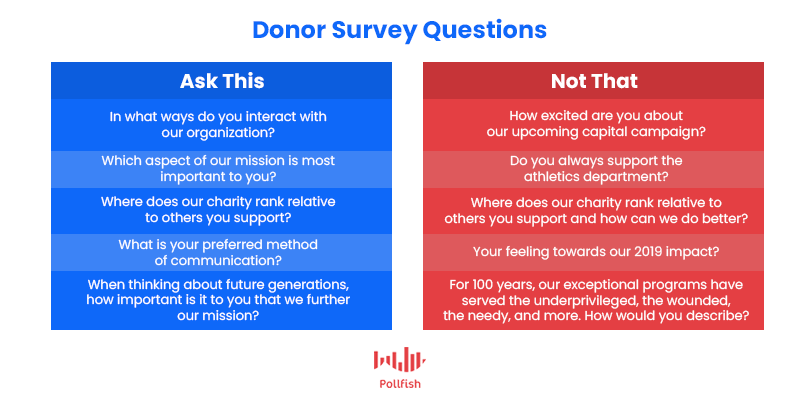
Market research for nonprofits is a necessary action that can help you secure funding and remain financially stable. With over 1.5 million nonprofits operating in the United States, competition for funding is fierce. To make things even more challenging, in recent years the donor retention rate has hovered around 40%.
Nonprofits cannot assume that existing donors will continue to support them. They must find innovative ways to demonstrate the value of their organization in order to secure new donors and retain existing ones.
By better understanding your target audience, you can create a more effective strategy to connect with your supporters, understand them better, rap in more funds and dutifully support your cause. In this guide, we will help you understand how to conduct market research like a pro, with a few key takeaways to help you get your market research started on the right foot.
The Purpose of Market Research for Nonprofits

There are several reasons why an NPO may consider undertaking market research, but all of these reasons lead back to the same goal, to ensure that enough funding is secured to keep the organization running. There is a finite amount of money that can be sourced from your supporters; market research can help inform and strengthen aspects of your overall funding strategy.
The main purpose of market research for nonprofits, therefore, is to understand their donors’ demographics and preferences. By understanding this, NPOs can find more effective ways to reach donors and improve ROI for marketing campaigns, which are almost always run on a tight budget.
While the purpose of market research is to better understand your audience, you will need to be more specific about the objectives of your market research in order to gain insights that you can use. Consider exactly what you hope to achieve before you get started. You may consider undertaking market research for some or all of the following reasons:
- Gain a better understanding of your donor base. Understanding the characteristics of your existing donors will allow you to make informed decisions for your nonprofit.
- Grow your brand. Insights about your existing supporters and those in your target audience can help you develop your brand to make it more appealing to your base.
- Improve communication with your supporters. An effective communication strategy is essential to retain existing donors and encourage them to give year-to-year. By understanding your supporters more deeply, you will be able to create more targeted messages to the various segments.
- Enhance your marketing efforts. Use insights gained about your support base to improve your marketing efforts by creating campaigns that will speak to your base. When operating with a smaller marketing budget, it is vital to achieve optimal conversion rates and ensure marketing funds are well spent.
- Leverage your base to test new approaches. Connect with your existing supporters to trial news ideas before making big changes to your marketing strategy or your mission.
- Measure current communications and campaigns with your supporter base. Gauge the reception of existing communications and level of frequency with your supporter base.
- Compare your nonprofit with others in your niche. Understand how you measure up to other players in the field to ensure you remain attractive to prospective donors.
- Measure brand awareness. Observe how aware or receptive your target market is to your nonprofit so you can make adjustments and increase your audience.
- Ensure that you are operating in a cost-effective manner. Every penny counts. Understanding your audience will ensure optimal ROI on each marketing campaign and initiative you undertake.
The Makeup of Market Research
Your market research project will cover two types of research: primary and secondary. The objective(s) of your market research project will dictate the selection of primary and secondary sources that you need.
Primary Research
Primary research involves gathering and analyzing data from first-hand sources. This means that the information you gather during primary research will be highly relevant and unique to your organization. The primary research methods for nonprofits are:
- Surveys of existing and/or targeted supporters
- Interviews (in person or by phone)
- Focus groups
- User testing (for example, if trialing a new social media or email campaign)
Primary research is an essential tool to better understand your existing donors. Primary research can help you explore aspects such as their reasons for giving, how your brand makes them feel, and what will motivate them to give again.
Secondary Research
When conducting secondary research, you will gather and examine information that is already published and publicly available. Examples of secondary research include:
- Market research papers
- Case studies and white papers
- Research agencies
- Statistic sites
- Industry reports
- Government statistics
- SEO and keyword research
- Trends sites (e.g. Google Trends)
- Websites of other nonprofits operating in a similar sphere
There is a wealth of information readily available for nonprofits - the trick is to identify which of this information is applicable to your organization.
Secondary Research Sources for Nonprofits
To help kickstart your market research, we have compiled a list of secondary research sources for the nonprofit sector.
- NCCS data - The National Center for Charitable Statistics (NCCS) is a vital source of free information and statistics about nonprofits. In order to make sense of the huge amount of data available here, start by reading the Beginner’s Guide to Using NCCS Data.
- The Nonprofit Sector in Brief 2019 - The NCCS publishes a yearly report that provides an overview of the nonprofit sector in the United States. The report includes info on key aspects of the sector, such as size and scope, types of organizations, and donation amounts.
- IRS’s Nonprofit Tax Statistics - The IRS publishes statistics about the tax-exempt sector that can be used to better understand both recent trends and historical data.
- Statista - An excellent source of statistics on any topic imaginable, Statista has a sizeable collection of nonprofit statistics. There is some free information about nonprofits available, while their dossier on nonproft organizations in the United States provides an in-depth view on the sector.
- Propublica’s Nonprofit Explorer - This tool lets you view tax returns for certain tax-exempt organizations in the United States. This information can be used to give you a better understanding of businesses with similar operating models.
Drive Your Market Research with First-Hand Insights
While secondary research provides a strong understanding of the nonprofit sector, primary research is highly necessary to understand how your target market thinks and behaves.
Fortunately, nonprofits have something that many other companies do not — an enthusiastic audience that has already demonstrated a commitment to your brand. Finding a way to reach these supporters and leverage their opinions can help you form future decisions, whether they be monetary, communications-based or deal with outreach.
Whether you have a large existing donor base or a small one, online surveys are a cost-effective way to gather information that can help improve your organization. Use social media or email to ask your supporters to participate in surveys, focus groups, and interviews; after all, this group of people should feel motivated to help you.
The involvement of existing donors in your market research project can help you make much more sense of the data you will accumulate. When you combine survey data on the sector, and you’ll be on your way to more certain financial stability.
Frequently asked questions
What is market research for nonprofits?
Market research for nonprofits is the process of better understanding the target market for a nonprofit to help secure funding and remain financially viable.
How can nonprofits benefit from market research?
Nonprofits can benefit from market research in a variety of ways, such as gaining a better understanding of existing donors, improving communications with existing and potential supporters, improving marketing efforts, and growing their brand.
What types of primary research are beneficial when conducting market research for nonprofits?
The most relevant types of primary research for nonprofits are surveys, interviews, focus groups, and user testing.
How can nonprofits use secondary research sources to support a market research project?
Nonprofits can examine published data in order to better understand trends and statistics in order to see how they compare to other nonprofits in their sector.
How are surveys used to drive market research for nonprofits?
Nonprofits tend to have an involved and interested user base. These individuals are more likely to participate in surveys and provide valuable responses that can help shape future campaigns to secure funding and donor retention rates.

Diving into the Consumer Survey
Diving into the Consumer Survey

A consumer survey is an essential tool for business owners who want a broader understanding of consumer attitudes, desires, and interests before launching a new product, feature, or service.
With the advent of online survey platforms, consumer surveys have become much easier to deploy. In comparison to traditional methods of face-to-face interviews or paper questionnaires, online surveys are more cost-effective and less time-consuming to conduct.
It is now easier for any entrepreneur to launch a consumer survey to understand customer sentiment around a new product or service. This article provides an overview of consumer surveys and suggestions on how to get started.
What Is a Consumer Survey?
Consumer surveys are an increasingly common method of conductinig consumer research. Surveys can be broadly and easily distributed, leading to a higher response rate than other market research methods. With the capability of gathering large sample pools, it is easier to identify trends and patterns among consumers through an online consumer survey.
Consumer surveys are used in two different ways:
- To determine consumer interest in new products, features, or services
- To understand satisfaction with existing products or services
Depending on the purpose of your research, a consumer survey could be distributed to existing customers or to a group of people who have no experience with your company but fall within your target market.
For established businesses, consumer surveys are a great way to understand how existing customers use your product or service, while gauging their interest in potential new features or services.
For entrepreneurs or investors, consumer surveys can help you understand the desires or aversions towards your business idea. Taking the time to perform a consumer survey can help you understand if your idea will succeed or flop.
Complete Enumeration vs. Sample Survey
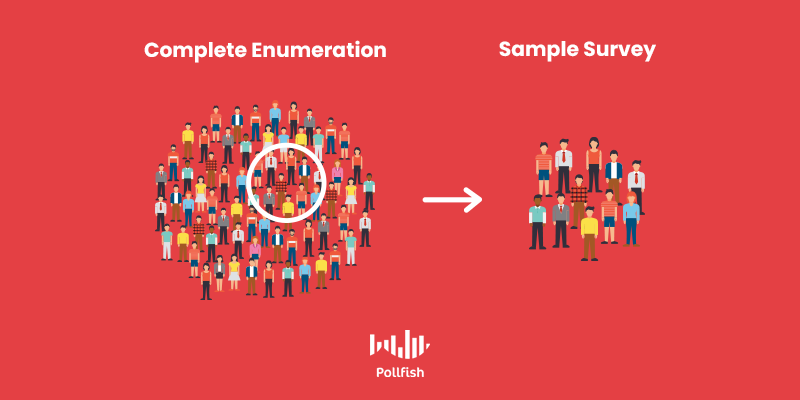
Before you begin planning your survey, you will need to consider which consumer survey method will best serve your purposes.
- Complete enumeration method: With this method, you will need to contact nearly all potential buyers or existing users of your product. A major benefit of this consumer survey method is that it eliminates sampling bias since the entire population is included in the results. Complete enumeration can be challenging in situations where the survey population is large and/or distributed across a wide geographic area.
- Sample survey method: As the name implies, this method involves distributing surveys to a sample of your population and drawing conclusions based on their responses. In comparison with the enumeration method, this type of survey is easier to conduct and more cost-effective; however, you must scrutinize the results to ensure that sampling bias is not skewing your interpretation.
Consumer Survey Types

There are three primary ways to conduct a consumer survey. These methods describe the mode of gathering information from consumers. Each has its own set of pros and cons.
Telephone Surveys
Before the advent of online surveys, telephone surveys were a fundamental component of market research.
Phone surveys allow you to gain more detailed responses to open-ended questions, as opposed to written surveys, in which open-ended questions are likely to be omitted, given their more laborious and time-consuming nature.
On the other hand, it may be difficult to get respondents to complete your survey, resulting in a lower response rate. The skill of the interviewer and level of interest in the topic will help determine whether the respondent will agree to complete the survey or not.
Written Surveys
Written surveys can be successful when researchers have an effective mode of distribution that gets the surveys into the hands of an interested audience. Just like online surveys, written surveys must be thoughtfully designed to encourage a satisfactory response rate.
Written surveys are often used to obtain information about more sensitive topics. A benefit of written surveys is that they can be completed at a time convenient for the respondent, which may be more suitable if you are researching a sensitive topic.
Conversely, without anyone encouraging the completion of the survey, the response rate of mail-in surveys are lower than that of telephone or online surveys. Many business owners will hire a company to conduct their written survey to ensure they get a large enough sample size.
Online Surveys
With the innovation of reliable online survey platforms, online surveys are now the most commonly used type of consumer research surveys. Online surveys can be distributed in a variety of ways, including via website, email, social media, or in-app.
The benefits of online surveys are numerous. This type of survey can be:
- Distributed to a wide audience in every part of the world.
- Designed with skip-logic to route respondents to relevant questions only based on their previous answers.
- Customized with user-friendly UX elements such as graphics, larger text, and call-outs to generate higher response rates.
- Deployed by the business owner via the online survey platform without needing to engage a third party.
The results of an online survey are viewed in a specialized dashboard, making it easy to review, filter, and download survey data. A potent online survey platform will also grant you the capability of viewing the data in various formats, such as through graphs, charts, and cross-tabs. Online surveys are cost-effective, so you can conduct several surveys as part of your broader consumer research project.
Wrapping Things Up on Consumer Surveys
Consumer surveys are incredibly useful tools for conducting market research. Most importantly, these surveys give you firsthand insight into customer experience, a critical business aspect that can make or break your brand.
In fact, 84% of customers feel that their customer experience is just as important as a company’s products and services. Measuring customer experience goes hand in hand with measuring customer satisfaction, another key aspect of the business.
Since you will likely need to deploy a variety of surveys, consider using a professional survey platform that will make it easier to review a large volume of data over time. In addition, survey platforms like Pollfish can help you get your survey in front of the right audience, ensuring that your data analysis will accurately shape the future of your business.
Frequently asked questions
What is a consumer survey?
A consumer survey is a type of survey used in consumer research to understand consumer interest in a new product, feature, or service, or to understand consumer satisfaction with an existing product, feature, or service.
What is the complete enumeration method?
Complete enumeration is a method in which a survey is distributed to nearly every customer of a product or service. Complete enumeration eliminates sampling bias since an entire population participates in the survey.
What is the sample survey method?
The sample survey method involves distributing a survey to a smaller portion of the population, with the aim of accurately representing the overall population. Care must be taken to avoid sampling bias in order to ensure accurate results.
What is a telephone survey?
A telephone survey is one in which participants answer survey questions via phone. This type of survey was more popular before the widespread use of online surveys.
What are some benefits of an online survey?
Online surveys are easy to distribute to the target audience, regardless of geographic location, can provide a better response rate, and can yield more interesting results through the use of skip-logic to send respondents to more relevant questions.

Survey Research Methods: A Deep Dive
Survey Research Methods: A Deep Dive

Although survey research methods are just one tactic under the enveloping market research field of study, they too are administered in a number of ways.
That is because much like market research, there is no single or universal technique when it comes to survey research. Instead, there are various survey research methods, those that only pertain to the survey aspect of market research.
Survey research methods include different sets of classifications, from types of surveys, to data organization and more. It is key to become familiar with all of them to determine which is most suitable for your market research needs.
This article will navigate all the nuances that pertain to survey research methods.
Surveys for Quantitative vs. Qualitative Research
Market research relies on both primary and secondary research; surveys fall under the former and have several classifications. The first major one conveys the duality within survey research methods: that of quantitative and qualitative research.
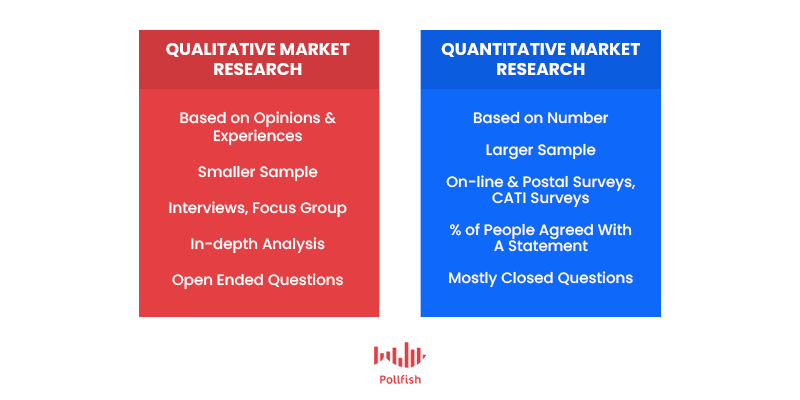
Quantitative research surveys:
Quantitative research involves gathering quantitative, or numerical data. Surveys amass this data by asking questions that quantify attitudes, opinions, feelings and behaviors. The point of this kind of survey research method is to form generalizations.
Quantitative research surveys therefore use a larger sample size in order to crunch numbers on different issues and variables. This survey research method is highly dependent on using and creating mathematical and statistical data.
These surveys use this data to identify patterns in a target market, find averages, make predictions and test relationships.
Essentially, this survey research method uses respondents to understand the “what” and “how much” of a studied subject.
Qualitative research surveys:
Qualitative research zeroes in on experiences, ideas and opinions, instead of focusing on statistical or quantitative results. Instead, this survey research method seeks to holistically interpret an issue, occurrence or phenomenon.
As such, qualitative research seeks to perceive an issue in more depth, find the cause of an occurrence, create inferences, find solutions to problems and uncover trends.
This research method is centered around the “what” and even more so, the “why” of a research subject.
Unlike quantitative research, qualitative research uses a smaller sample size for a deeper understanding of causes, motivations and sentiment.
This kind of survey research method uses open-ended and exploratory questions in natural environments, in which respondents freely discuss their opinions to help researchers identify the “why” behind an issue.
Understanding the “why” is then used to make decisions on how to resolve the issue or how to improve on an existing productive situation.
Survey Panels Vs Random Sampling
The second main classification of survey research methods is categorized via the sampling pool. There are two main types of sampling pools, i.e., the type of respondents that take part in a survey.
Market Research Panel:
A market research panel is a pre-recruited group of survey respondents who have agreed to take part in online surveys. This method is most commonly employed by market research panel companies, which require the panelists to share personal information about themselves.
This includes the information you’d find at the screener section of a survey tool such as demographics, but can also include behavioral data. The panel can be used for more than one survey; this way is convenient for market researchers who require long-term survey campaigns such as longitudinal surveys.
Random Sampling Pool:
A random sampling pool is a group of survey respondents who have not been recruited to take part in a survey. Instead, this method involves, as the name suggests, a random group of participants. They take a survey once they reach a publisher’s website or app, which is triggered by an online survey tool. As such, they take a survey due to their being real-time users on a site or app in which the survey has been launched.
Any business can take this automated approach, which does not require seeking out participants manually, as a market research panel would. Although the pool of respondents has been gathered randomly, the qualifying participants are not random.
This is because the survey software used to launch this survey includes screening questions and demographic requirements that respondents must meet to take the survey. As such, researchers still get the exact kind of participants they seek to survey. This survey research method includes probability and non-probability sampling.
Survey Research Methods Based on Campaign Type & Macro Applications
Survey research methods can be further divided based on the type of macro application (or discipline) you need the data for. They can also be categorized into different campaign types, which can fall under the macro applications, or exist as their own application.
You should understand these purposes before you choose the proper survey type for your research needs. Here are the major campaigns and applications to base your survey method on:
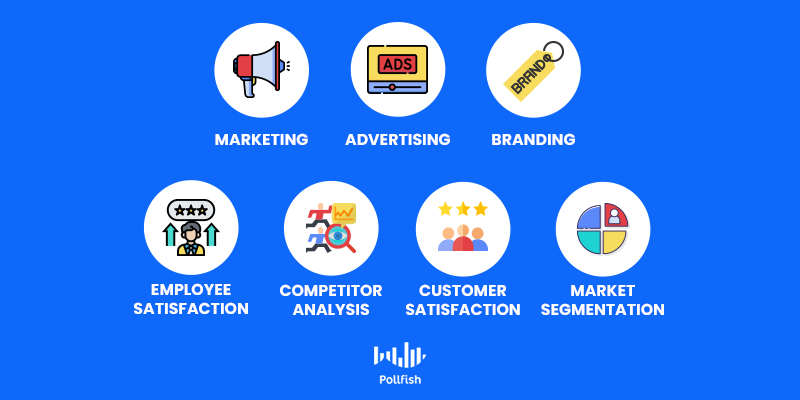
- Marketing: A broad term that includes a wide variety of processes to raise awareness and demand in your company, promote it and understand your target market.
- Advertising: One of the key practices in marketing, advertising refers to communication using overtly sponsored messages to promote or sell a product or service.
- Branding: The development of a brand’s reputation and image, along with increasing the recognition of your company.
- Market Segmentation: Facilitates targeting those most likely to be satisfied customers of your company or content. It involves splitting your target market up into smaller groups of people with similar characteristics.
- Competitor Analysis: It is the process of identifying and assessing your competitors based on their strategies to unearth their strengths and weaknesses relative to your brand.
- Employee Satisfaction: The degree to which employees are content and fulfilled with their jobs, including their schedule, work environment and banter with fellow employees.
- Customer Satisfaction: The measurement of how happy customers are with a company's products, services, experiences and interactions.
Types of Surveys
Finally, we arrive at the types of surveys, the most granular aspect of survey market research methods, that is, unless you delve further by looking into survey questions.
These surveys are classified as belonging to either quantitative or qualitative methods, along with their best application type. As for the latter classification, you ought to know that these surveys are not necessarily limited to these applications.
Rather, they are most apt for the named applications and campaigns, but due to the versatile nature of surveys, the following can be used in other applications, including those not mentioned in this article.
- Cross-sectional surveys: Gather data to make inferences about a population at some point in time.
- Used to provide snapshots of the populations they survey.
- Drawn from a few specific variables to narrow down a unique and smaller population.
- Method: Quantitative surveys
- Best used for: advertising, market segmentation, employee satisfaction, customer satisfaction, branding
- Longitudinal Surveys: Study variables over longer periods of time. (Weeks to decades)
- Require more dedication from respondents and researchers, including time and money. In this regard, a larger pool of participants is used and studied for much longer.
- Like cross-sectional surveys, these are also observational and study the exact sample pool for the length of the study.
- Method: Primarily qualitative, but can be quantitative
- Best used for: marketing, competitor analysis, market segmentation
- Retrospective Surveys: Merge aspects of both cross-sectional and longitudinal survey methods.
- Observe changes that occur over a longer period of time, but are facilitated just once.
- Thus, responders discuss occurrences, attitudes and feelings from the past.
- Method: Qualitative and quantitative surveys
- Best used for: Marketing, branding, competitor analysis
Going Beyond Survey Research Methods
Understanding the various survey research methods are crucial to forming the most fitting market research campaign for your brand. However, it doesn’t end here. With innovations in the market research field, other survey methods and sub-methods are going to emerge.
Moreover, after you’ve found the best survey research method(s) for your company, you’ll need to conduct the proper survey data analysis.
As such, you’ll need to analyze your surveys, and this can be done in a number of formats. Some are going to be more visual than others.
After all, conducting surveys is one thing, but understanding the surveys is the centerpiece of any research campaign.
Frequently asked questions
What is a quantitative research survey?
A quantitative research survey is one in which all responses can be assigned a numerical value so that results can be easily analyzed. They are used to quantify thoughts, feelings, and behaviors in order to make generalizations about the target market.
What is a qualitative research survey?
A qualitative research survey is used to gain a deeper understanding of the ideas, opinions, or experiences of a group of people. This type of survey uses open-ended questions that allow respondents to discuss their opinions freely.
What is a market research panel?
A market research panel is a group of individuals who have been selected to participate in a series of surveys over a specific period of time.
What is a random sampling pool?
A random sampling pool is a group of individuals who have been selected at random to participate in a survey. In an online survey tool, a sample pool is derived via automation.
What is a longitudinal survey?
A longitudinal survey is one that studies a group of individuals over a period of time, which can range from weeks to decades.

Amassing Community Feedback with the Community Survey
Amassing Community Feedback with the Community Survey

The community survey. Although less known than the main types of market research surveys, this type of survey offers invaluable insights into your target market through a local lens.
Consequently, it is a location-based survey, meaning that it elicits responses from the local residents of a community, or a small geographic region.
A community survey does not represent a community in the more abstract or holistic way, in which it can denote a group of like-minded individuals. The term that grasps this idea is that of the target market, which is what most survey research is based on, at least to some degree.
On the contrary, a community survey is gripped to a geographical site. This article explains what this survey is and why it is crucial for certain types of marketers and business owners.
Identifying the Community Survey
Not to be confused with the American Community Survey program, which is sometimes simply referred to as a Community Survey, the general meaning behind a community survey is a survey that studies the behaviors, preferences, attitudes and opinions of people who live in a particular area — the community in question.
Since this kind of survey is anchored in a location, participants must be screened on this very demographic. That is to say that your survey should include screening questions and quotas on the demographic of location.
Since it is designed to measure a community, you should set your geographical preferences to the local level in your survey, instead of a macro level, such as state or territory.
That way, you can capture the feedback of a local community, instead of a wider area containing multiple zip codes.
The Importance of Collecting Community Feedback

This type of survey reveals the problems and needs of a community which your business can help address, thereby increasing (or establishing) a foothold in the area for your business. As such, conducting this kind of survey can help grow your revenue and business at large.
Collecting community feedback is especially necessary if you operate a brick-and-mortar business. This is because your business exists in a geographical context (at least in your physical store), and should thus take into consideration all the associated factors of that context.
After all, you won’t be able to properly market your local business to locals, if you know nothing about them.
Gathering community feedback is also crucial if you are considering to psychically branch out your business into a particular community. You may have come upon a particular neighborhood while conducting real estate market research and mulled over if it’s worth opening a brick and mortar there.
In this scenario, collecting community feedback also comes into play, as it will lay any of your doubts and curiosities to rest. That is, of course, if you conduct community feedback.
The most auspicious way to collect this information is by conducting a community survey.
The Benefits of Implementing a Community Survey
Whether you’re set to conduct a community research campaign for marketing, advertising or for the objectives covered in the previous section, a survey designated for this research is a must.
As aforesaid, a community survey helps you uncover the attitudes, needs and opinions of a particular community.
It is the chief primary research method for garnering community feedback, unless of course, you’re going to conduct interviews, which is a far more costly and time-consuming task.
Here are some more critical ways your business can benefit from a community survey:
- Allows you to understand the major needs of your local community’s target market
- Allows you to tweak your product or service in a way that’s best suited for the community
- Gives you the chance to fill any major gaps your niche has in the community you study
- Informs you on how to market and advertise your product to the community
- Enlightens on the ethnic makeup of the community, including local languages, cultures and even lifestyles (think surrounding institutions)
How to Create a Community Survey
Now that we’ve covered community research, feedback and the advantages of the community survey, let’s dive into creating one. When conducted the correct way, a community survey is no feat; it is simply an asset to your market research needs.
We’ve mapped out the 7 steps of creating an effective community survey.
1. Find the main purpose(s) of your survey.
Figure out the goals you intend on pursuing with your survey. To do so, ask yourself the following:
- What are some of the primary insights you want to glean from this survey?
- How will surveying this particular neighborhood help you help you find these?
- How can your business better assist the residents of a neighborhood?
- How do residents feel about the community and what would they change about it?
- How can your business provide a better experience for the entire community?
2. Draft a set of questions aimed at fulfilling the purpose of the survey.
Once you have a purpose or more for your community survey, tailor your questions to achieve that purpose.
Since it is a community survey, ask several questions that are most relevant to the community, whether it pertains to its physical setting, the language respondents prefer to speak, or the issues they face, especially as they relate to buying from your business.
Here are a few question examples:
- What is the best part about shopping in this area?
- What is your favorite type of [product you offer]? Would you go out to buy it?
When you’ve come up with a set of questions, consider adding advanced skip logic. This mechanism involves using a custom question path for respondents who give particular answers.
For example, if a respondent answers that they don’t know about a particular store in the area, the survey shouldn’t lead them to a question about the store. Instead, it should route them to relevant questions only, which is how skip logic maneuvers.
3. Put your survey on pilot mode.
It may be tempting to hit the ground running once you’ve come up with a set of key questions, especially if you’ve added skip logic to them.
However, as with any successful campaign, you should ascertain that your survey is ready to be sent out to the masses, even if it’s a rather small community.
To do so, test your survey by running it by your team members. Let them take a stab at it to discover what they think and whether there are any typos, irrelevant questions or other errors.
Then, once they give you the green light to launch the survey, send it to a small sampling pool. For example, let’s say there are 5,000 members in your community. Send it to 50 to see how your survey fares.
For example, perhaps respondents left negative feedback in the final question about the survey itself. This can help you revamp the survey for a better experience.
Or, perhaps the respondents gave nonsensical answers to the open-ended questions. Either way, you should test the survey out before you do any large-scale launches.
4. Deploy Your Survey to Your Community
After running your survey on pilot mode, distribute it to members of your community. Do so via Google Forms or through a survey platform.
This survey platform should help you add all the questions you need, apply advanced skip logic, use screening questions, add quotas, and most importantly, deploy the survey to your community of study only.
5. Streamline the Participation
To quicken the study, consider using incentives. If you use a survey platform, ensure that you can communicate this incentive to your respondents in the website or app your survey is distributed to.
Or, make sure that the participants can at least be informed of an incentive when they click on/open the survey in the publisher’s site/app.
The incentive can be a small discount on your product/ service, or entry in a giveaway. Feel free to get creative.
You can also streamline the survey completion time by opting for a survey platform that allows you to implement quotas on the demographics you qualify to take the survey. To stay ahead on the timing, it is apt to use a tool that forecasts the survey’s total completion time.
6. Conduct a survey analysis

When you’ve reached the total responses you preset the survey tool to receive, it’s time to do a survey analysis. To analyze your freshly accumulated data, organize it in the following ways:
- View your data in different formats for a high-level understanding, export it as an Excel sheet, or view it as charts, graphs and other visualizations that your survey platform permits.
- Apply market segmentation by breaking up answers’ based on respondents’ age, gender, income, etc., and studying their answers on a segmented basis.
- Organize market segmented data into spreadsheets and other data formats.
- Compare responses with cross-tabs to uncover relationships between variables
- Read your open-ended responses, categorize them if you find similar answers.
6. Summarize Your Findings and Prioritize Next Moves
After you’ve analyzed the results, you should summarize any patterns, relationships and other key findings in a document.
Afterward, share the document with your team members, particularly data analysts, market researchers and marketers. You should come up with a plan of action based on the summary.
Begin by prioritizing the most pressing needs of the community, especially if they appear doable. Then, plan out other outstanding needs and set timeframes, so that you’re running operations smoothly.
Keep in mind that some issues may seem scathing but only have affected a small fraction of respondents. Thus, they don’t pertain to the entire community. To that end, you may want to consider whether addressing those issues is worth doing at all.
Seizing Community Feedback to a Maximum
A community survey not only helps detect the issues and concerns a community may harbor. This type of survey informs you on how to best market to the community, including how to innovate your service and experience for them.
But remember, this survey is only one primary research method used in collecting community feedback and research. You should therefore conduct other methods of primary research, along with secondary research on a community before you begin setting up your survey.
After all, conducting secondary research may reveal a neighborhood you previously didn’t know about, one that you can possibly venture into in your next brick-and-mortar store.
Frequently asked questions
What is a community survey?
A community survey is a location-based survey that seeks to better understand the feelings, attitudes, or behaviors of the residents of a small geographical community, such as a neighborhood or zip code.
Who is the intended audience of a community survey?
A community survey is conducted to elicit responses from a small geographical location. The target audience should be a narrow region, such as a single zip code or neighborhood, rather than a larger area, such as a state.
What types of businesses can benefit from a community survey?
Brick and mortar businesses are most likely to benefit from a community survey since they tend to serve nearby communities. Grocery stores, clothing shops, health and beauty stores, and real estate agents are all examples of businesses that can benefit from a community survey.
How can a business benefit from a community survey?
Businesses can use a community survey to better understand the needs of the local market and thereby adapt the product/service to best serve that market. It can also be used to identify a niche for your product in the local community.
How is a community survey used to support marketing and advertising campaigns?
A community survey can help inform marketing and advertising campaigns by shedding light on the demographic and cultural makeup of the local community, including information about language, lifestyle, interests and needs.

Diving into the Employee Satisfaction Survey
Diving into the Employee Satisfaction Survey
 Whether you operate a small, mid-sized or enterprise business, a high level of employee satisfaction is a must, thus you’ll need to employ (pun intended) an employee satisfaction survey.
First, you should mull over the notion of employee satisfaction: the term itself doesn’t denote contentment among employees. Rather, it signifies the concept of whether employees are content with their needs and wishes in their job.
As such, it is treated as something to measure, as a healthy amount of employee satisfaction leads to better job performance and productivity. Conversely, poor satisfaction leads to low morale and high burnout, which inevitably lead to higher turnover rates and ultimately affecting a business’s bottom line.
But as a business, you can disentangle yourself from this predicament — or avoid it from occurring to begin with — with the employee satisfaction survey.
What is an Employee Satisfaction Survey?
This kind of survey gauges the level of satisfaction your employees have with their jobs: this includes culture, work environment, visibility and all employee relations. It is a tool best executed by the human resources department, as this team works chiefly to fulfill employee needs.
However, the intelligence derived from this kind of survey should be shared with upper management, so that higher-ups can see how employees are faring, make decisions on how to improve their satisfaction and devise plans with HR on how to better oversee the company.
Your business should periodically issue these surveys to your employees, as even the happiest of them can have a change of mood. Perhaps something in the company changed for the worse? Or perhaps, the new project management system is difficult to adapt to.
Whatever the case, your company will benefit from monitoring your employees’ satisfaction.
Why Does this Survey Matter to Your Business?
If the above explanation wasn’t reason enough to employ employee satisfaction surveys regularly, the following will. Your HR team cannot read minds, and neither can you. When your employees hit a sour note in any matter pertaining to work, it is best to correct it.
But you won’t be able to unless you know precisely what troubles your employees when it comes to their jobs.
Here are several reasons as to why you should implement these surveys, particularly in regards to unhappy employees.
- Employees’ discontent won’t be remedied if it’s not addressed and if no action is taken against it.
- If unhappy employees don’t like their jobs, they won’t bother to work as diligently as they should; they’ll start slacking and their performance will worsen.
- Discontented workers may get to the point of no return; they may decide to leave the organization. Others may follow suit, leading to high turnover.
- Unhappy colleagues can release their low spirits onto other employees and even customers.
- Dissatisfied workers may lower company morale and culture.
- Unhappy employees will feel like they get to voice their concerns with a satisfaction survey.
- The prospect of fulfillment and improving mental health may seem like a reality to unsatisfied employees when employers set up these surveys.
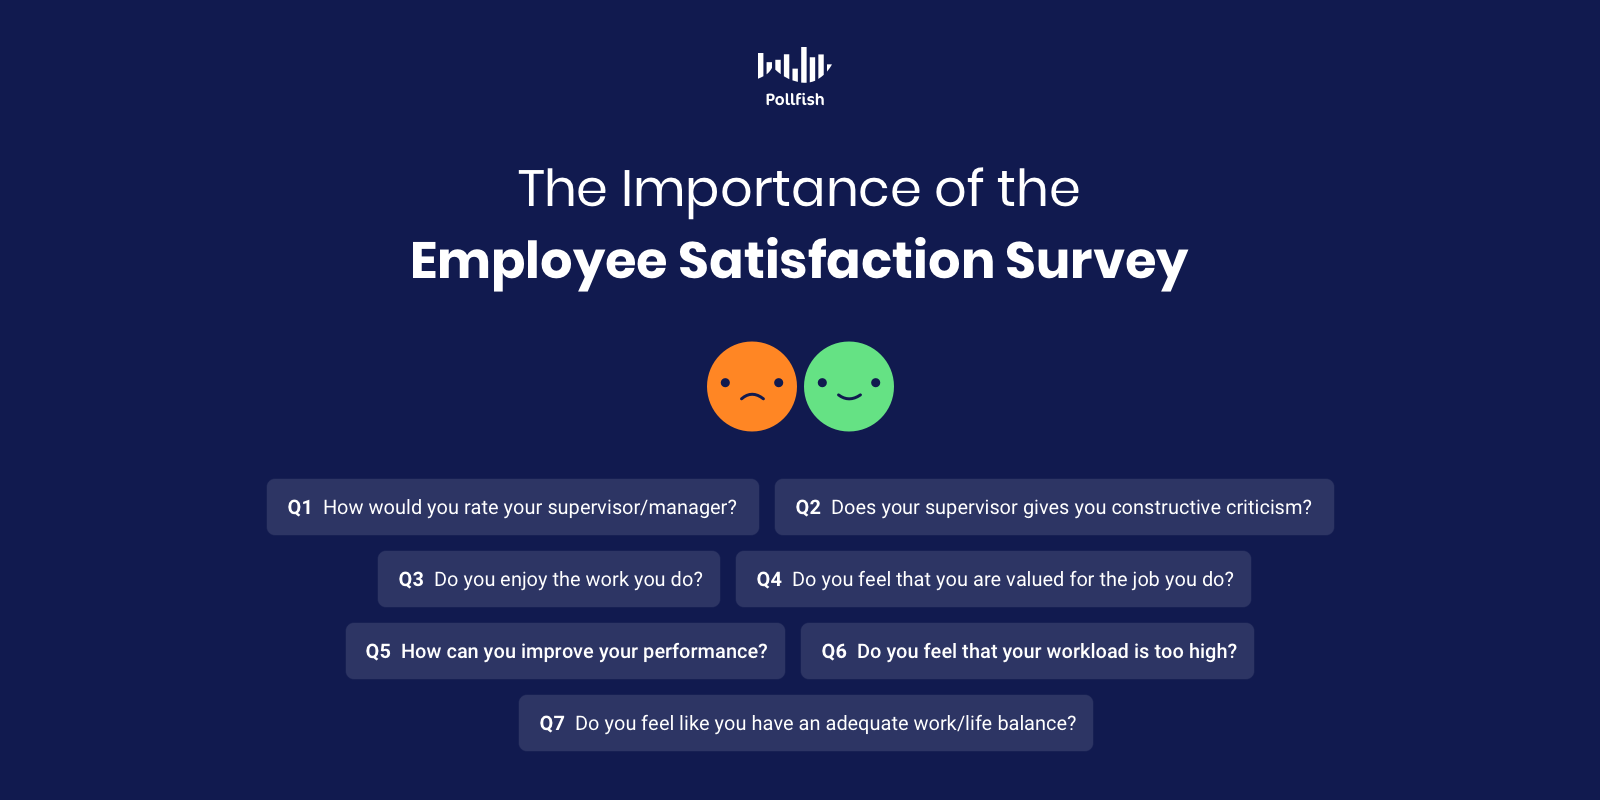
Questions to Ask in Your Questionnaire

An employment satisfaction survey often deals with many topics, as such, you can create multiple such surveys, or incorporate various topics into one survey. Here are a few types of employee satisfaction question types and question examples.
Questions on relationships with the supervisors and managers
- How would you rate your supervisor/manager?
- Does your supervisor give you constructive criticism?
- Does your supervisor provide your tasks in a timely and comprehensible manner?
- Do you feel that your supervisor understands your concerns?
- Do you feel like your supervisor appreciates your work?
Questions on job enjoyment and comfort
- Do you enjoy the work you do?
- Do you feel that you are valued for the job you do?
- Do you feel that you can pursue job growth in this company?
- Do you believe you’ve gotten sufficient training to solve customer issues?
- Do you feel that your job helps make a difference in the company, the niche, our customers, or the world at large?
Questions on self-evaluation
- Do you complete all your tasks before they are due?
- Do you feel that your workload is too high and that you may require some help?
- How can you improve your performance without inducing any stress?
- How can you improve your performance to help contribute to the company’s success?
- How can you improve your relationship with other colleagues?
Questions on company pipeline and goals
- Do the overall goals of the company make sense for this quarter?
- Do you have an understanding of your requirements and how they fit into the bigger picture of the company?
- Do the objectives for your team seem realistic and attainable?
- Are your own objectives clear and do they seem realistic?
- Do you have any worries about the direction the company is going in terms of goals or your responsibilities?
Questions on work/life balance
- Do you feel like you have an adequate work/life balance?
- If not, what can the company do to adapt to a better work/life balance?
- Do you think your managers take your personal family time into consideration?
- Do you feel stressed out due to long hours or hard to meet objectives?
- Do you feel that your coworkers respect your time off?
Using Employee Satisfaction Surveys to their Fullest Potential
Aside from the question types and topics above, there are many other topics that factor into employee satisfaction. You should consider all relevant topics, as this type of survey doesn’t merely reveal how your employees feel.
The value of these types of surveys is their ability to reveal your company’s own shortcomings and shortsightedness, along with ideas on how to improve managerial relationships and culture. Moreover, they can divulge how to achieve objections, set more reasonable expectations and offer better visibility.
This is to say that these surveys can give indispensable advice on how to run your business. As such, a robust survey platform is key.
Frequently asked questions
What is an employee satisfaction survey?
An employee satisfaction survey is a type of survey that is distributed to current employees of a company to understand how satisfied employees are with various aspects of their job.
Why is employee satisfaction important to a business?
Satisfied employees tend to perform better and have higher levels of productivity, which can in turn lead to increased profits and lower turnover for the company.
How can understanding employee satisfaction help a company?
When a company understands their employees’ pain points, they can make plans to address the issues. Employees who feel that their opinions are heard are more likely to be engaged in the company and perform better in their role.
Who should conduct an employee satisfaction survey?
Ideally, an employee satisfaction survey will be deployed by a company’s HR team, but the results should be shared with upper management and potentially with the company as a whole.
What aspects should an employee satisfaction survey cover?
An employee satisfaction survey can be used to understand how employees feel about a variety of topics, including overall job enjoyment, relationship with the management team, workload and performance, company goals and objectives and work-life balance.

How to Analyze Survey Data Like a Pro
How to Analyze Survey Data Like a Pro

Survey data analysis may feel like a daunting task if you have not conducted many surveys, but the process is easier than you might think. The first few attempts at analyzing your data may feel clunky and cumbersome, but in time you will become adept at viewing and processing survey data.
Whether it is your first or 20th time conducting a survey, knowing how to analyze survey data is crucial to extracting maximum value from your survey results. This guide will walk you through four of the most common types of surveys and provide you with an approach for analyzing data for each type.
Analyzing Survey Data - An Overview
Survey data analysis refers to the process of organizing and examining survey data so you can draw conclusions. The process can be short or long, rudimentary or precise - it all depends on the purpose of the survey, type of data analyzed, consequences of the results, and the skill of the person analyzing the data.
Survey data analysis follows this general process:
- Review the purpose of your survey and the most important questions. Before diving into the data, make sure your analysis stays focused on the survey’s purpose and answers your top questions.
- Review, filter, and cross-tabulate. Sift through the results and think about the best way to organize the data to draw conclusions. Export your data in crosstabs to gain deeper insights.
- Interrogate the data. In this step, you are looking for irregularities that may skew your interpretation of the data. You should consider the statistical significance of your results and identify any areas where sampling bias may lead to inaccurate interpretation.
- Draw conclusions. Once you have gained a deeper understanding of the data, you can draw conclusions and utilize your findings to improve your business.
We have provided just a brief overview of how data analysis is performed before we jump into the specifics on data analysis for various survey types. If you want to learn more, we encourage you to read about how survey data analysis can help grow your business.
Customer Satisfaction Survey
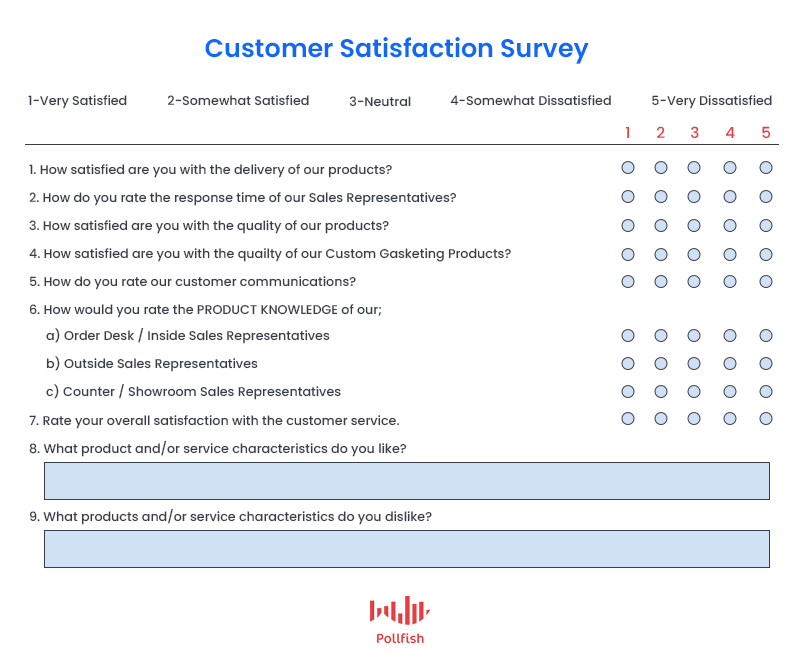
Customer satisfaction surveys provide invaluable insight into your business and help you identify changes to improve the customer experience. When it comes to analyzing the data from a customer satisfaction survey, be prepared to carefully examine both quantitative and qualitative responses.
- After segmenting and organizing your data into appropriate reports, such as crosstabs, the quantitative data from your survey will provide a rich view into the types of customers who were satisfied (or dissatisfied) with their experience.
- Once you have a broad view of the types of customers who either enjoyed or struggled through their experience with your company, qualitative data can give you clues into how to improve the experience to improve satisfaction levels.
- Review open-ended questions of the customers who reported a high satisfaction level. Look for specific examples of what they enjoyed. For example, respondents may mention an easy checkout experience or the helpfulness of your customer service agents.
- Customers who were not happy with the experience are likely to provide even deeper insights. Carefully review their statements and consider what changes you need to make to address these pain points.
Market Research Survey
A market research survey can help you apply educated decisions on how to cater to your target market. For example, your research may help you understand the competitive landscape of a survey platform, but it may not give enough detail into a specific feature you want to develop.
A market research survey could provide more detail, especially when paired with secondary research sources.
- Conduct secondary research, which involves reviewing published data such as consumer research reports, white papers, government statistics, etc.
- Identify where you need additional or more specific information to answer any curiosities you may have about your target market.
- Conduct primary research, which involves gathering self-conducted data, i.e., the data that has not already been obtained and made available.
- Plan your market research survey, deploy, and gather results.
- Analyze your results and draw conclusions. By combining data gathered in your survey with other aspects of your market research, you can leverage the survey data to make more confident decisions.
A survey alone will not suffice when it comes to market research, but when paired with secondary research and other forms of primary research, the data gathered in a survey can be illuminating.
Event Evaluation Survey
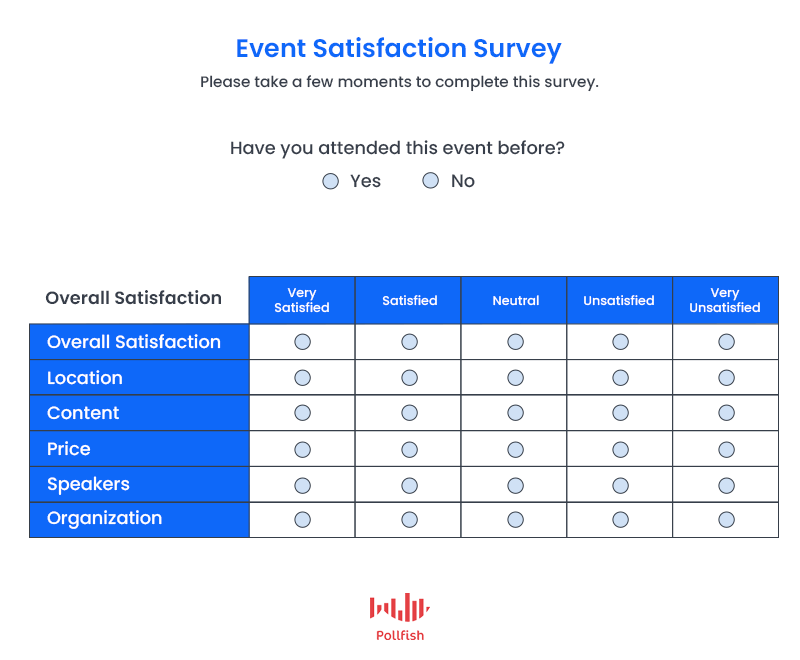
With the time and money dedicated to hosting an event, surveys are important tools for determining the success of the event, whether it was worth the investment and how to improve future events. If you host monthly or annual events, an event evaluation survey is absolutely critical for your success!
- When it comes to analyzing your survey data, again you will need to pay attention to both quantitative and qualitative responses.
- Quantitative data can give you a broad overview of the success of your event. Answers to the following types of questions can help you quickly understand the value of your event:
- Will you attend this event again?
- How likely are you to recommend this event to a friend?
- Was the length of the event too long or too short?
- Were the supplemental resources provided helpful?
- Once you have sorted your data based on response and/or demographics, you can review the qualitative data in the form of responses to your open-ended questions. These personalized responses can help you understand what changes need to be made in order to improve satisfaction with the event.
- If you will have more events in the future, the initial responses can provide you with a benchmark for future events. By deploying surveys after each event, you will be able to see how your changes influence overall satisfaction with the event.
Brand Awareness Survey
Brand awareness surveys are conducted to help a business understand how familiar the target audience is with their brand. Brand awareness has traditionally been very difficult to measure, but if you plan carefully, it will be easier to analyze your survey data.
- First, be sure that you have selected the right audience for your survey via the demographics and screener sections. You need to be specific about your target audience.
- Decide whether you want to do a random sampling to see how many people can recall your brand or whether you want to study brand awareness of existing customers.
- When reviewing the data, carefully examine the characteristics of each segment. This will help you understand the demographics of the people who know the most or the least about your brand. You may discover, for instance, that only those aged 40+ demonstrate brand awareness.
- Understanding the demographics of those who are and are not familiar with your brand can help guide your upcoming marketing decisions. You can decide if you want to strengthen marketing within a segment or try different marketing channels to expand your reach.
Better Analysis Starts with Better Planning
While data analysis is the last step in the survey process, you can make the experience more valuable by considering data analysis during the planning phase. Consider the type of survey you will conduct and think how different data sets will make it easier or more difficult to interpret results.
Data analysis is more fruitful when you have selected the appropriate target audience and have an adequate response rate for your survey. All of this is made easier when you use a professional survey platform to plan, deploy, and analyze the results of your survey.
Frequently asked questions
What is survey data analysis?
Survey data analysis the process of reviewing the data that was gathered during a survey and analyzing it in order to draw actionable conclusions.
What is a crosstab?
A crosstab, or crosstabulation, is a special type of table used in survey data analysis that shows the relationship between two or more variables.
What is statistical significance?
Statistical significance is a term that describes how likely or unlikely it is that a relationship between two or more variables is due to random chance.
When can sampling bias occur?
Sampling bias occurs when certain members of the sampled population are more likely to be selected than others, thus skewing the results. Sampling bias is more likely to happen when respondents are not chosen at random and/or the sample size is too small.
What is a quantitative survey response?
Quantitative responses are those that have a restricted number of options as the response. These responses can then be converted into numbers so they can be easily measured and charted.

The Customer Satisfaction Survey Question Guide
The Customer Satisfaction Survey Question Guide

Customer survey questions are the lifeblood of any survey pertaining to customer respondents.
They help your business carry out research on customer satisfaction, the measurement of happiness your customers harbor for your product, experiences and overall company.
To determine your business’s level of customer satisfaction, it is apt to use the customer satisfaction survey. This survey can be configured in four survey types. There are countless kinds of questions to use for measuring customer satisfaction.
There are 7 main types of questions to incorporate into your customer survey. There are also specialized questions your brand will benefit from inquiring. This article will cover both so you can deliver better services, experiences and products for your customers.
Customer Satisfaction Survey Formats
As you’ve learned from our previous article, customer satisfaction surveys are facilitated through 5 types of survey formats. Before we get into the weeds of the suitable questions to use in your customer survey, let’s recap these 5 crucial types of customer surveys.
- Net Promoter Score Surveys (NPS)
- Asks customers how likely they would recommend your company/product on a scale of 0-10. Then you compare the percentage of detractors (0-6 answers) to promoters (9-10 answers) to see where your company stands.
- Assesses your brand’s appeal and uniqueness.
- Customer Satisfaction Score (CSAT)
- Measures customer satisfaction with a particular situation, by asking how satisfied they were with a product or interaction? (Uses a scale of 1-5)
- Unearths valuable information about a customer’s overall happiness with your product or service.
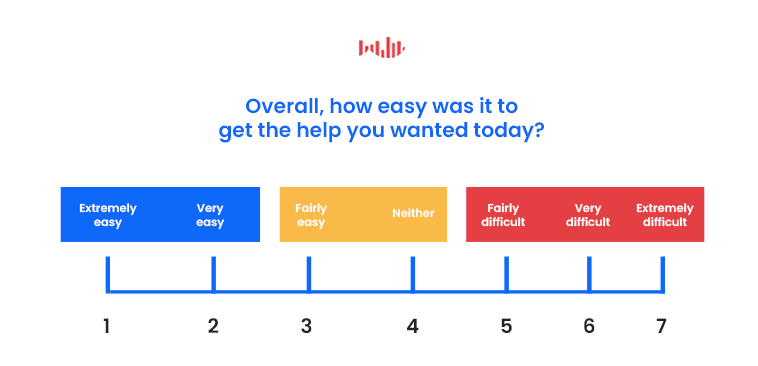
- Customer Effort Score (CES)
- Uses 5-point scale to gauge the ease of customers’ to complete an action. It commonly asks how easy was it to find this product on our site?”
- The options range from “very difficult,” to “somewhat difficult.” Divide the number of responses in the agree range (4 and 5) by the total number of respondents.
- Visual Rating Surveys
- A quick-to-conduct survey on a current experience.
- Uses emojis (smileys, hearts, stars, etc.) to gauge customer feedback.
- Custom Surveys
- Uses targeted questions, specific to your market, product, or service to find details about customer experience (CX).
- Ask follow-up questions to elaborate on what respondents answered prior.
All of these survey types play a major role in gauging different aspects of customer satisfaction. As such, you should understand their unique capabilities and how they each differ from one another.
Once you have a solid understanding of them, you can find various questions within this topic and filter the questions with their corresponding survey type.
Filtering the 7 Customer Survey Satisfaction Question Types
There are 7 main types of questions that are applicable to measuring customer satisfaction. You’ll find that some of these types of questions fit under more than one label of survey types, whereas others are only suitable for one type of survey.
Multiple-choice questions
Multiple-choice questions place limits on the number of answers responders can give per question. Unlike open-ended questions, which require respondents to type in answers, multiple-choice questions require less labor to answer and are easier to tabulate.
Additionally, unlike open-ended questions, which can give rise to long answers, multiple-choice questions typically have shorter answers.
These questions can encompass a wide range of question styles such as nominal questions, rating scale questions, binary scale questions, Likert scale questions, and semantic differential questions.
Rating scale (ordinal) questions
As their name implies, rating scale questions are multiple-choice questions that rely on a scale for rating an aspect of customer satisfaction.
These can exist in two of the survey types aforementioned: in a Net Promotion (NPS) Survey or a Customer Satisfaction Score (CSAT) survey.
An example of the former: Please rate the likelihood of you recommending our product to a friend or colleague on a scale of 0-10.
An example of the latter: Please rate how satisfied you were with your interaction with our customer support representative on a scale of 1-5.
Binary scale questions
Binary scale questions rely on a limit of two answers per question, hence the name “binary.” These can exist simple, yes or no questions, along with questions that can be answered with graphics such as thumbs up/ thumbs down, or with happy face/ sad face emojis.
As such, these questions are used with visual rating surveys. However, they can also function within custom surveys, should there be any obscurity to previous answers in them.
That is because these questions are used to clear any ambiguity surrounding some rating scale questions. For example, the 3-star experience of one responder can be the 5-star experience of another. But were they both satisfied with the experience overall?
An example of a binary scale question: Did you find the product you were looking for on our website? Yes / No
Nominal questions
Nominal questions are naming scales, which pinpoint different categories of questions. These answers cannot be assigned a numerical value. In addition, the answers are not created to be connected in any way, unless you add an option for “all of the above.”
The answers to nominal questions have no specific order; they are meant to carry significance for variable labels only.
An example of a nominal question: Which brand of laptops from our store do you prefer?
Answers: Apple, Microsoft, Dell, Acer, Samsung, Asos
As you can see, the order of these answers doesn’t matter, neither are they tied to any number. The significance lies in the label only; it shows researchers which brand its customers prefer.
These can be used in custom surveys or even in visual ratings surveys, if you use an emoji for each option. This can be done to test branding, with each emoji taking the form of a brand’s logo.
Likert scale questions
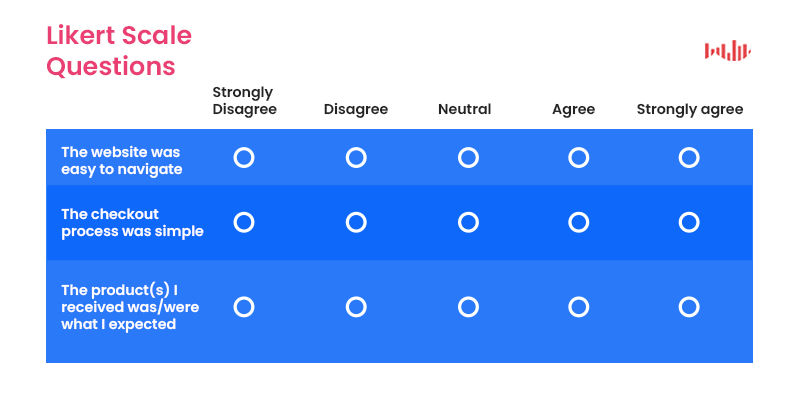
Likert scale questions are used in Likert scale surveys. The answers exist as a 5- or 7- point scale to determine how customers feel. The bottom number (always 1) represents the lowest extreme view, while the top number (either a 5 or 7) represents the highest extreme view.
The numbers 3 (on a 5-point scale) and 4 (on a 7-point scale), represent the middle, aka the moderate view.
An example of a Likert scale question:
On a scale of 1-5, how strongly do you agree with the following:
[Your product]’s had an easy to use and understand our instruction manual.
1 - Strongly disagree
2 - Somewhat disagree
3 - Neither agree nor disagree
4 - Somewhat agree
5 - Strongly agree
Semantic differential questions
Like Likert scale questions, Semantic differential questions also feature a 5- or 7-point scale. These questions, however, offer a differentiator, in that they ask for more descriptive answers.
Instead of asking responders to either agree or disagree to a statement, semantic differential questions ask the customer to select an option that most accurately represents their opinion on a product, service or experience.
An example of a semantic differential question:
How helpful was our interactive website experience?
1 - Not helpful at all
2 - Barely helpful
3 - Neither helpful nor unhelpful
4 - Somewhat helpful
5 - Very helpful
Open-ended questions
An open-ended question can be used to buttress virtually any of the mentioned survey types in this article. That is because these questions use an open field for customers to type out their answers.
Usually, these questions ask for clarity or elaboration on a previous multiple-choice or ratings question. These questions are best used to cut back on any ambiguity or to delve further into an issue without the need to ask multiple questions.
Since the answer is in a field that customers can type, they can express themselves more fully and add all the details present in a problem, concern or preference.
This type of question is more difficult to process since it is longer and unique to each respondent, however, it is excellent for finding new ideas and opportunities for betterment.
An example of an open-ended question:
Is there anything on our website we could improve for a better digital experience? If so, what is it?
More Examples of Specific Questions for Customer Satisfaction
The above was designed so that you can become fully acquainted with the main question types in customer satisfaction surveys.
But with so many questions out there in relation to customer satisfaction, it may be confusing to tie specific ones to a question type, let alone a survey type. Here are a few more examples of specific questions you may potentially use for your customer feedback survey.
- How would you rate the interaction you had with our salesman, on a scale of 1-5?
- Question type: Customer Satisfaction (CSAT)
- Can you rate how likely you are to recommend our brand to a friend or family member on a scale of 0-10?
- Question type: NPS survey question
- How easy was it to solve your issue with us? (Select from 1-5)
- Question type: Customer Effort Score (CES)
- Why did you feel you had an overwhelmingly positive experience? (multiple-choice)
- Question type: Custom question
- How can we improve this product? Please provide all the feedback you can.
- Question type: Open-ended
Excelling in the Customer Satisfaction Front
Customer satisfaction can be a tough nut to crack, even when you build a seemingly perfect customer survey. To put insult to injury, customer satisfaction surveys have low response rates, as they hover between 10-30%.
You should remember that these surveys should only be sent to customers, ie, the portion of your target market that has made purchases.
Also, keep in mind that in some cases, you may combine all survey questions and even all survey types into one survey, so long as it is relevant to your case.
Make sure each survey you create to study customer satisfaction is centered around topics relevant to your customers’ recent purchases and experiences. Apply best practices and you’ll improve the low response rate in no time.
Frequently asked questions
What is a customer survey?
A customer survey is any type of survey that is distributed to existing customers of a business.
What can a customer survey achieve?
Customer surveys help a company understand customer satisfaction and research changes that can be made to improve customer satisfaction.
What types of questions are included in customer surveys?
The types of questions used in customer surveys are multiple-choice questions, rating scale questions, binary scale questions, nominal questions, Likert scale questions, semantic differential questions, and open-ended questions.
What is a Likert scale?
A Likert scale is a type of question used in surveys. It provides a statement and asks respondents to rate their level of agreement or disagreement on a scale of 1 - 5.
How are semantic differential questions different from Likert scale questions?
Semantic differential questions offer more descriptive answers than Likert scale questions, which only allow respondents to agree or disagree with a statement.

How to Conduct Grocery Market Research Like a Pro
How to Conduct Grocery Market Research Like a Pro

Whether you own a grocery chain or a small supermarket, grocery market research is a powerful practice when it comes to understanding your target market, improving your offerings, and investigating this industry at large.
In recent years, the grocery industry has undergone unprecedented change due to the advent of online shopping and the emergence of mega-retailers, like Amazon and Target Business owners who wish to succeed must stay abreast of changes; market research is the most data-driven and accurate way to do so.
This article will teach you how to conduct grocery market research like a pro so you can stay competitive and meet your customers’ evolving needs.
The Purpose of Grocery Market Research
Market research describes the process of collecting, analyzing, and interpreting data in order to better understand a certain market. Grocery market research is a fundamental tool in:
- Identifying and catering to specific customer segments via market segmentation Consumer behaviors during their digital experiences
- Competitive analysis of your sector
- Current trends and growth opportunities
- The success of marketing campaigns and how they can be improved
- The demand for new products, services, and experiences
- Desired distribution methods
- Geographical demand for your services (allowing you to venture into other geographical regions if the demand is high enough)
A successful market research project will help you make better decisions about how to improve or grow your business. There is an inherent risk in starting or making changes to your grocery business, but market research can provide assurance about the changes you need to make.
The Makeup of Grocery Market Research
Market research involves two data types: primary and secondary research. Primary research is highly-specific information that has not yet been collected, and thus has to be collected and analyzed by the business owner. Some examples of primary research are:
- Survey research (online or by mail)
- Focus groups
- Interviews (phone or in-person)
- Observation studies
- User testing (more relevant for online grocers)
Secondary research involves the gathering and analysis of existing, publicly-available data. This includes free and paid-for resources. Secondary sources of information include:
- Market research reports
- Case studies and white papers
- Government statistic sites
- Industry reports
- Research companies
- Search trend sites (Google Trends) and SEO platforms
Once both information sets have been gathered, you will need to spend time organizing and analyzing the data in order to make conclusions that are relevant to your business.
How to Perform Grocery Market Research

Like other types of market research, there is a certain process you can expect to follow while undertaking grocery market research. However, there are some considerations that are unique to the grocery industry. By understanding these unique aspects, you will be better poised to collect the right type of primary and secondary research.
Your general approach to grocery market research should cover the following:
- Identify your target market. Understand who your potential customers are. If you have a brick-and-mortar store, you will need to consider the demographics, needs, preferences, and aversions of those in the surrounding area to understand spending patterns and their unique needs. Online stores will need to take a broader look at consumer behavior to identify their target market. Survey research, including quantitative and qualitative research, can help you identify and scrutinize your target market.
- Understand your target market’s behaviors. The goal is to understand the spending habits and preferences of your prospective customers. By understanding their behaviors and motivations, you can create more targeted and precise marketing campaigns that are relevant to your customers.
- Analyze consumption and saturation. Secondary research, such as the examination of spending statistics and employment statistics, can help you assess how much demand there is for your grocery store and current market saturation. The goal is to identify a niche where the demand is high, but the market is not yet saturated.
- Identify the competition. Understand what your competitors are doing so you can offer a better or varied experience. Consider how their marketing strategies and messaging are succeeding or failing. Use secondary research and visit your competitors’ digital and brick and mortar properties in order to better understand your competition.
- Outline your unique value proposition. Even in a saturated market, you may be able to differentiate yourself to offer a competitive grocery shopping experience. For example, you might offer certain product lines that your local competitors don’t. Or you may offer a free delivery service within a certain radius. If there is plenty of local competition, try to identify at least one way you are different and then plan your marketing strategy around those differentials.
Once you have finished this process, you should have a better idea if your business can meet the needs of your target market. If you have unanswered questions or need to dive deeper into the specifics of your niche market, consider deploying a survey to get clarification.
Secondary Research Sources

We have compiled some of the leading reports about the US grocery industry to help you get started on your grocery market research.
- MarketResearch.com’ Grocers Market Research Reports: This website is an excellent source of market research reports. Search for grocery market research reports at a broad level or for more specific subsectors. Also available are U.S. and worldwide outlook reports, along with country-specific reports.
- IBISWorld’s Supermarkets & Grocery Stores Industry Market Research Report: IBISWorld is a global company offering in-depth market analysis from trusted industry experts. Their supermarket industry report covers key topics including historical and projected growth, revenue forecasts, market size, industry trends, and profitability analysis.
- Online Grocery Market Outlook & Key Findings: This report focuses specifically on the online grocery industry and provides a global perspective on the industry growth. The report includes an analysis of how COVID-19 has shifted consumer behavior and the long-term outlook for this industry.
- U.S. Bureau of Labor Statistics, Food and Beverage Stores: The BLS is a treasure trove of free data about the food and beverage stores industry. Explore employment and earnings figures, workplace trends, prices, and more.
- Progressive Grocer: This grocery industry magazine has been publishing articles and reports for the retail food industry since 1922. It is a trusted source of both news and published research reports.
- Grocery Trade Shows: Trade shows are an excellent way to learn more about the latest trends and growth opportunities. Thanks to COVID, many of these can be accessed right from your living room indefinitely.
Using Survey Research for Grocery Market Research
The grocery market industry has undergone rapid change and growth during the unprecedented era of COVID-19, raising the demand for market research in this industry. Established retailers are scrambling to meet the needs of their customers, while entrepreneurs search for openings in a competitive landscape.
Grocery market research should be an indispensable part of your marketing and planning strategy for the coming year. From providing a clearer picture of how the market has changed to providing insight into your customers’ evolving needs, market research is an invaluable tool that you can use to intelligently guide your efforts.
From traditional to online, grocery store owners must ready themselves for more change. If you are trying to identify ways to remain relevant or seize an opportunity for yourself, now is the time to start your market research.
Frequently asked questions
What is grocery market research?
Grocery market research is the process of gathering and analyzing data in order to better understand the target market and customers of an existing or planned grocery store.
What are good sources of primary information for grocery market research?
When it comes to grocery market research, good sources of primary information include surveys, focus groups, observational studies, interviews, and user testing.
What are good sources of secondary information for grocery market research?
Market research reports, industry reports, case studies, statistics sites, and search trend sites are all good sources of secondary information for grocery market research.
What is a grocery store’s target market?
A target market is the group of customers that has the potential to purchase goods from a business. For grocery market research, this is typically limited to a geographical region around the supermarket, but it may extend further if the grocery has delivery services.
How can grocery market research help improve marketing campaigns?
By better understanding the target market and the demand for a grocery store’s products, a company can plan marketing campaigns that will reach the right audience and speak to their needs.

Diving Into the Customer Satisfaction Survey
Diving Into the Customer Satisfaction Survey

Customer satisfaction. This lofty achievement is often, if not always, the main objective for businesses small and large.
It goes without saying that this concept is attributed to revenue, continued purchases, customer loyalty and brand awareness (via reviews and mentions by happy customers).
So how can your business accomplish customer satisfaction? By putting the customer satisfaction survey into practice.
This survey is specifically tailored to gauge customer satisfaction within your niche, and most importantly, within your company. This article will explore this survey type and how you can optimize it for all your business needs, including market research, marketing and more.
Defining Customer Satisfaction
This term appears to be self-evident, but for business purposes, it is best to understand it precisely before you venture out on any efforts to perfect it — or if you’re a startup — to reach it.
Customer satisfaction denotes the measurement that ascertains the degree to which customers are satisfied with a company’s products, services and experiences. In short, it reveals whether your customers are happy with your offering and by how much.
Your business can determine its own levels of customer satisfaction with the customer satisfaction survey.
The Customer Satisfaction Survey & its Applications
As its name implies, a customer satisfaction survey is a survey developed for businesses to understand what their customers think about their products, services and company at large.
As such, this kind of survey can cover all the bases of customer satisfaction, such as user experience, mobile experience, customer support and all the other facets of doing business/ interacting with your company.
The customer satisfaction survey can take the form of a questionnaire, or a ratings-based survey (think numerical values, stars and other icons used to express good or poor satisfaction).
This kind of survey can be used in a number of different campaigns, based on their macro applications. These include:
These applications may seem too broad to be used for uncovering customer satisfaction alone — and they are. These macro applications serve as the starting points of survey research, which in turn can be used to buttress them. The same applies to a customer satisfaction survey, which can be used in relation to these campaigns.
For example, you can test how satisfied customers are with a product, as it relates to an advertising campaign around it.
Or, perhaps you need to test your customer support satisfaction for branding. You may conduct a survey that asks about specific wording your representatives may have used.
There are several ways to form a customer satisfaction survey.
5 Types of Customer Satisfaction Surveys
You can design these surveys in a number of ways, but there are five main types of formats that these surveys take. Each survey type provides a different kind of angle into customer satisfaction. As such, they should be used at different points in the customer journey.
Net Promoter Score Surveys (NPS)
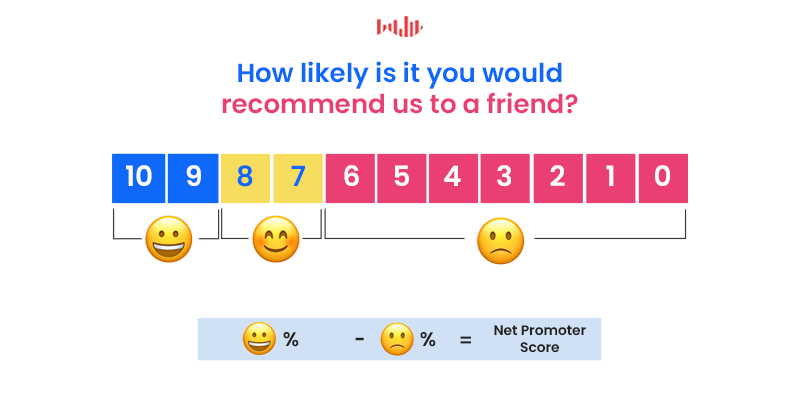
Conceived in 2003 by Fred Reichheld, of Bain & Company, the Net Promoter Score (NPS) survey has become prominent across industries. This score-based survey asks customers to rate the likelihood of their recommending your business, on a scale of 0-10.
The respondents who ranked their likelihood between 0-6 are known as the detractors, those who are generally unhappy with your product, service or experience.
Those who respond in the 7-8 range are called passives, as they are not impressed with your company, but aren’t dissatisfied either. They are situated in the middle of this score, despite their numbers going slightly past the mid-section.
Respondents in the 9-10 range are the most ideal, as they represent the promoters of your business; they are on the higher end of satisfaction.
To calculate your NPS, subtract the percent of detractors away from the percent of promoters. For example, if 60% of responses were Promoters and 15% were Detractors, your Net Promoter Score would be 45. (The NPS is expressed as a digit, not a percentage.
Pro tip: Always add a follow-up open-ended question, so that your customers can explain why they selected their rating.
Customer Satisfaction Score (CSAT)
The CSAT represents a customer’s fulfillment in a particular situation. This is where you can apply this survey to a wide range of applications. For example, you can assess customer happiness during an interaction with a salesperson or with a product feature.
The Customer Satisfaction Score is made up of two parts: a numerically-based question and an open-ended question. The numerically-based question is a scale representing satisfaction.
The CSAT can ask, for example, to rate satisfaction with an experience from a scale of 1 (very dissatisfied to 5 (very satisfied).
To calculate the CSAT, use the following formula: The total number of satisfied responses / total number of responses) x 100. Round the result to the nearest whole number.
Respondents who answer this with either 4 or 5 are considered to be satisfied customers.
Pro tip: Use the CSAT to understand your customer sentiment at a specific point in time. This includes after a product demo, after a technical support call, after visiting a service center or store.
Customer Effort Score (CES)
This type of survey measures the amount of effort that was required for a customer to take part in an action. This survey focuses solely on the process of achieving an end result. Also called the effort, measuring the process determines how easy or difficult the flow is in your product/service.
As such, even if the result may be enjoyable to the customer, the process itself may not be.
This service is important, as brands today must provide quality experiences; the product or service alone is not enough. To fully satisfy customers, brands must make it smooth and easy to complete any process, whether it’s signing up for a subscription or ordering a product.
To calculate the CES, use a 5-point scale to gauge the ease of the customers’ actions. For example, it is common to ask: “how easy was it to find this product on our site?” The options should range from “very difficult,” to “somewhat difficult,” to “somewhat easy” and so on.
The answers on the “disagree” side of the spectrum would be number 1 and 2. 3 would be neutral, while 4 and 5 would be on the “agree” side. The CES is centered around the “agree” answers.
As such, to find the CES add all the “agree” answers (either 4 or 5), then divide them by the total number of respondents.
For example, if 100 customers replied with a 4 or 5, but there are 200 of them who took the survey, 50% of them are in the “agree” range. That means your CES score is 50. Brands ought to aim for high CES scores, as it points to customers happy in achieving an intended outcome.
Visual Rating Surveys
Also called emoji surveys, visual rating surveys allow customers to respond with graphic, rather than with a number. All the choices they can select are composed of a graphic and there are various ones you can use.
Each answer shows a different amount of each graphic to express the level of satisfaction. For example, a question on how satisfied customers are with a service can range from 1 to 5 stars or other emojis.
Here are a few examples of the types of visual rating surveys:
- Star surveys
- Heart surveys
- Thumbs up/down surveys
- Smiley surveys
These kinds of surveys are visually appealing, easy to complete and take little to no time to finish.
Custom Surveys
Best used to understand how and why customer satisfaction was exceeded, met or failed to reach expectations, these surveys are often used as follow-ups to previous surveys.
Custom surveys include questions that delve further into customer satisfaction to discover specifics that other surveys could not make readily available.
To piggyback on previous surveys or previous responses, you can ask follow-up questions by way of advanced skip logic. This will automatically direct your respondents to different question paths, depending on the answers they provided.
You should organize your custom survey feedback into three segments: fix now, fix later and fine as is. This will allow you to see which issues and experiences are the most pressing and which can be amended later.
6 Types of Questions to Use in a Customer Satisfaction Survey
The types of questions you use will largely depend on the kind of survey type you implement into your customer satisfaction campaign.
However, since they all fall under the same research campaign and measure virtually the same thing, there is going to be a lot of overlap between the questions you use for each survey type.
The following lays out the 6 question types to use for measuring customer satisfaction.
- Multiple-choice questions: limit the number of answers a respondent can use. Little effort is required to answer (as opposed to open-ended questions).
- They can include rating scale questions, binary scale questions, nominal questions, Likert scale questions, and semantic differential questions.
- Rating scale questions: use multiple-choice questions that correspond to a scale, such as the CSAT, for customer support, or the probability of product recommendation (NPS)
- These are also called ordinal questions.
- Binary scale questions: Allow for only two answers, such as yes or no, or a thumbs up or down.
- These are used to cut back on obscure results.


An example of a binary scale question
- These are used to cut back on obscure results.
- Nominal questions: Use different categories of answers with no numbers attached.
- Likert scale questions: Questions on a 5-7-point scale to assess customer sentiment.
- 1 represents the lowest end of the view (strongly disagree) while 7 is at the highest end of the opinion (strongly agree)
- Semantic differential questions: Uses a 5-7-point scale, but goes beyond agreeing and disagreeing.
Using this Survey to Lure in New Customers
Unlike other surveys, which are used to scrutinize your target market, identify it or segment it further, the customer satisfaction survey deals solely with customers, ie, the segment that has already bought from you.
Not everyone in your target market is a customer, as this group denotes the people most likely to buy from you — not the people who already made a purchase.
Customers are every bit as important to study as prospects, as they help you discover what your company exceeds at and where there’s room for improvement. Measuring customer satisfaction will inform your business on how to better prepare your service, experiences and offerings for everyone in your target market.
As such, you’ll know how to better lure in new customers and upkeep their satisfaction. But most importantly, a customer satisfaction survey helps bridge the gap between one-time purchasers and loyal customers. Retaining your customers is key to keeping your business afloat, as they represent a continuous stream of revenue and revenue opportunities.
Frequently asked questions
What is a customer satisfaction survey?
A customer satisfaction survey is a type of survey that is designed to measure how happy or satisfied existing customers are with a product or service.
What is a Net Promoter Score survey?
A Net Promoter Score (NPS) survey is a short survey that is used to measure the likelihood that someone will recommend a product, service, or company to someone else. The survey is a good way of gauging overall customer satisfaction.
What is a CSAT?
A CSAT, or Customer Satisfaction Score, is a short survey that measures how satisfied a customer was with a specific situation. It consists of a numerical-based question and an open-ended response.
What is a Customer Effort Score?
A Customer Effort Score (CES) is a survey that measures the amount of effort required to complete a certain action. The survey consists of a single question with a 5-point scale response.
What is a binary scale question?
A binary scale question is a type of survey question that has only two possible responses (e.g. yes or no).