
How to test ad copy using Pollfish.
How to test ad copy using Pollfish
The objective of an advertising campaign is to bring a brand’s message to their target audience, but it can be challenging to know if the message is right. To help with this, brands and agencies can test ad-copy using Pollfish surveys to get data earlier in the process.

Why test ads before launch
When it comes to brands aligning themselves with ideologies, using humor, or moving into new markets where translation may be confusing, testing ad-copy and creative early can make or break a campaign’s success.
Many brands and agencies use Pollfish to help them understand consumer sentiment and behavior to develop ideas for a campaign’s overall message, but Pollfish can also be an asset later in the process. Ad testing early on helps validate the direction, ideation, and creative used. It can also prevent brands from making embarrassing mistakes by revealing confusing or misguided messages prior to launch.
It's especially important for brands exploring more risky, politically charged advertising to make sure they don’t inadvertently damage their image by launching campaigns that are perceived as “tone deaf” or don’t resonate with the target audience.
With Pollfish’s advanced targeting and variety of question types to choose from, you can test all parts of ad messaging with the right audience early on. Feedback from real consumers before launch gives you data to pivot the campaign as needed without costing a fortune in time, resources, or damaging credibility.
Building a copy test survey with Pollfish
Like all research projects, the best way to test ad-copy will vary depending upon your goals and needs, what type of creative you need to test, and what you need to learn as a result of your research.
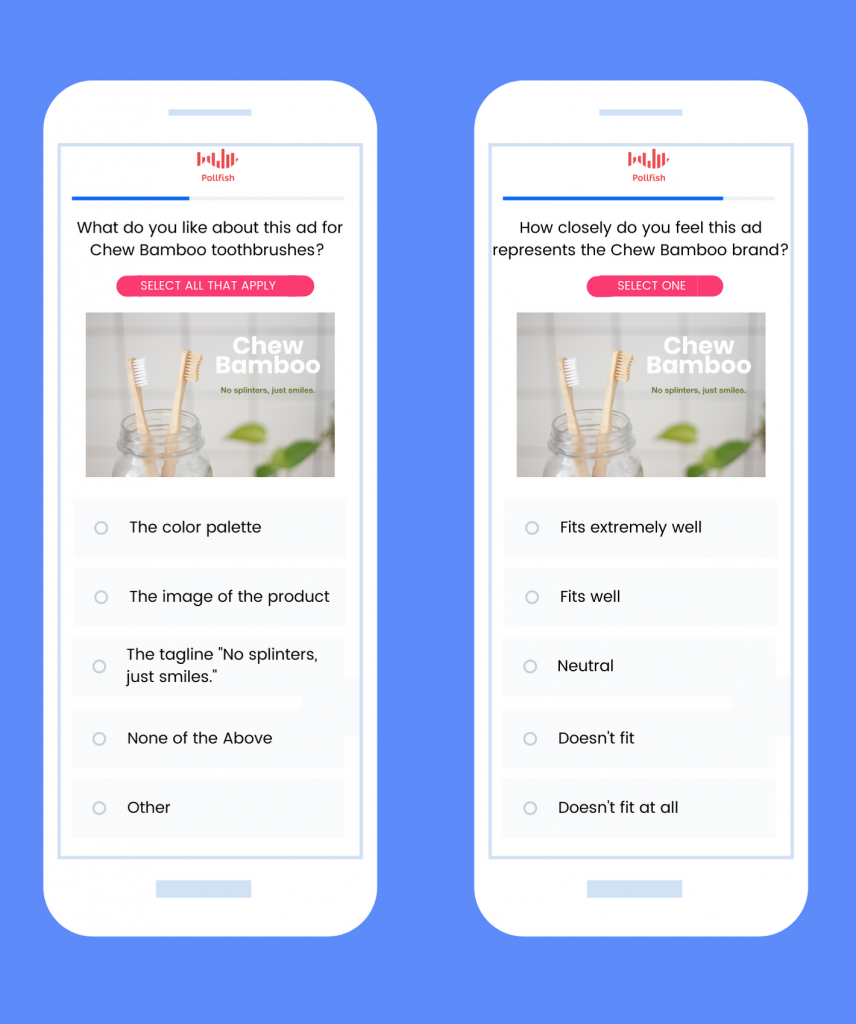
Many companies use Pollfish to gather consumer sentiment to determine the direction of their campaign, but they can also use Pollfish to validate it. By presenting the target audience with the ads and asking them to choose the message that best fits, campaign creators can determine that their ads are telling the right story and tapping into the emotions that they want to influence.
A/B Testing
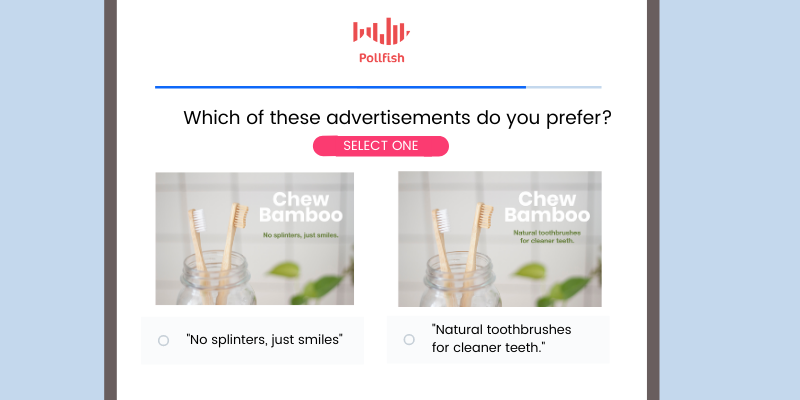
A/B testing involves showing a group of people one concept, followed by a similar group being shown another variation and comparing the results to determine which performed better. On Pollfish, this can be achieved by creating two separate surveys to show Creative A and Creative B to similar groups by selecting the same targeting.
You can only include one photo, video, or audio file in the question for now, however, you can upload a single image as a split-screen to offer an option to select between images. You can also add images to the answers, allowing you to structure the question differently if you prefer.
Because Pollfish is one of the only survey tools that allows additions of image, audio, and video media on questions and answers, you have a variety of ways to test other creative in addition to ad-copy.
Test CTAs
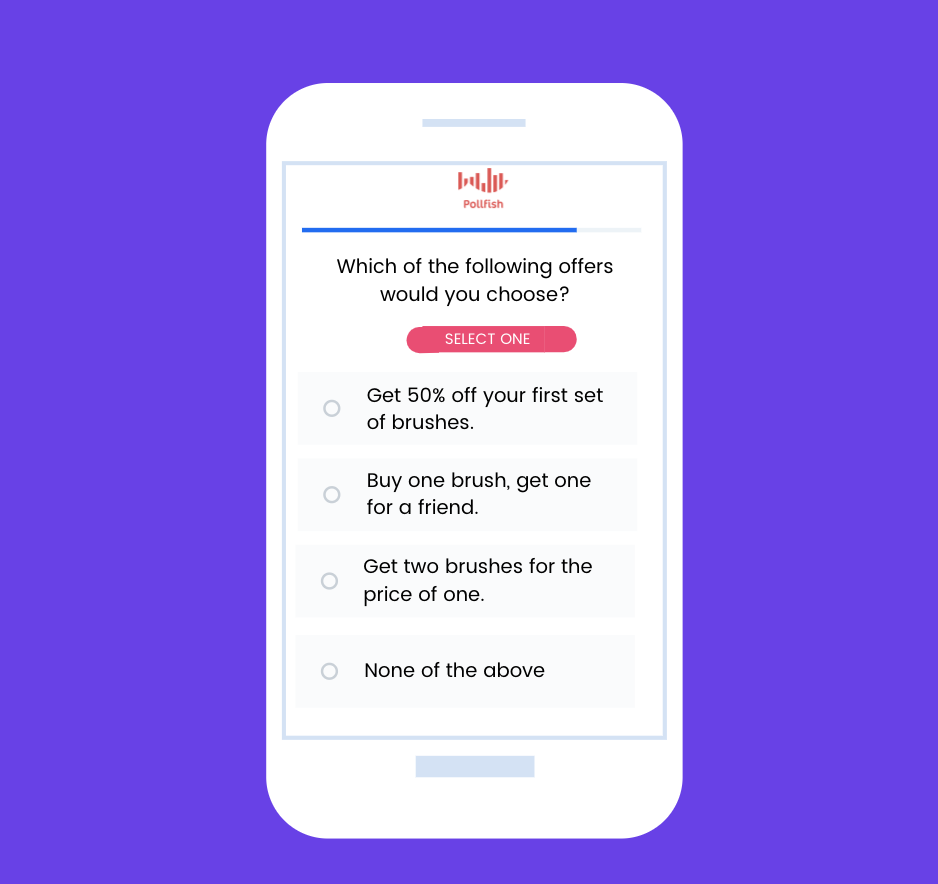
To test different CTAs, consider providing an overview of an ad or a short video to engage the audience. At the end, ask them to select, or rank, the CTAs they would be the most likely to click based on the information they were presented with.
Testing ad effectiveness
A similar form of testing completed after a campaign is live is useful when trying to better understand which messages most resonated with consumers. For example, if consumers are asked to recall where they saw an ad or the brand it was for, their results can help measure the effectiveness of the ad or creative in question.
To measure ad-effectiveness using Pollfish, we recommend running a pre-test prior to the campaign to collect metrics for awareness, favorability, and other objectives. Once the campaign is complete, duplicate the survey in the same area to compare changes in metrics and validate your campaign’s impact.
Ad-copy testing is a simple, effective way to validate concepts prior to launch or catch catastrophic mistakes before they’re made. With Pollfish, a simple survey can provide all the information you need to get your campaign on the right track. Reach out to support for additional assistance or to get our ad-copy testing template questions.


Pollfish Is More Fun With Friends (Video)
Pollfish Is More Fun With Friends
Did you know you can add up to 10 team members on a free (basic) plan? While it might not be the first thing that comes to mind after registering with us, adding team members can really enhance your experience trying out Pollfish market research tools.

While you are test driving Pollfish on your first survey, you can add your whole team and share the results with them, let them add questions or browse targeting.
Benefits of adding multiple team members
There are several other benefits to adding your team right from the get-go. Like...
- You can train your staff on all market research tools as they build surveys.
- You can share the platform with department heads so they can test it as well.
- You can share capabilities with your executive team.
- You can open it up to your team and monitor usage to see if Pollfish proves an exciting addition to your stack.
How to add multiple team members to Pollfish
To add team members, simply log into your Pollfish account and follow the steps below:
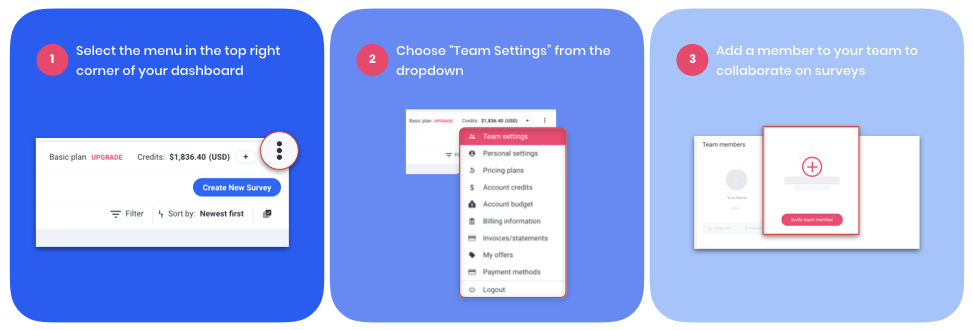
1. Find the settings menu by hovering over the three dots on the top control bar.
2. Select Team Settings from the menu.
3. Scroll down to add team information, add team members and even add a team logo.
You're ready to start sharing insights with the whole team!
Tips for setting up your first survey
Now that you have added your team, you will want to set up your first survey so you can check out the amazing results you can collect with Pollfish.
Here are just a few tips to set up your first survey.
1. Decide what you want to find out
It sounds simple, but knowing what you want your survey to achieve will help you write better questions and get more useful results. For example, if you want to capture broad opinions in your potential customer's own words, you'd use more open-ended questions. If you want a set of easily extensible data and a broad set of insights from predetermined answers, you'd use multiple-choice questions.
2. Set up your targeting before you set up your screening questions
On many traditional platforms, you may purchase your survey audience separately from the platform where you create the survey. This means that, if you plan to use screening questions, traditionally you'd set them up as your first step, to ensure only the audience members you want take your survey
With Pollfish, it works a little differently. Because Pollfish is an all-in-one solution, you get to choose your perfect target audience right inside our platform. You will have many advanced targeting options to choose from. But if you find you want to screen your audience further, you can always use a screening question.
Use screening questions to narrow your chosen audience down to just people who have heard of your product before or people who prefer cats to dogs. Whatever you can dream up is alright with us.
3. Remember to design with user experience in mind
Pollfish surveys are delivered inside mobile apps. All questions are fully optimized for mobile and designed with the mobile consumer in mind. This means you can expect higher than average response rates.
But you can do your part to ensure your survey questions are answered in full by following a few basic rules of respondent experience.
First, don't make your survey too long. Long surveys have higher abandonment rates and cause people to rush through important questions.
Make sure you keep things interesting. Try using video or audio instead of text for certain questions. This will make sure your audience remains engaged to the very end.
Once you have added your team members, check out the rest of the Pollfish Resources Center for more tips on how to get the most out of your Pollfish market research tools.

Creating an audio, video, or image survey with Pollfish (Video)
Creating an audio, video, or image survey with Pollfish
Surveys that support media files offer more ways to learn from respondents. They’re a great way to gather more qualitative feedback, such as emotional responses to an ad or concept.

Benefits of adding media to survey questions
Adding media to survey questions is a great way to let respondents get more context about what you’re asking. It can offer an element of accessibility for people who respond better to visual stimuli or those who have trouble reading. Not only that, media components like images and videos are engaging for respondents and add a nice look and feel to the survey.
Media is especially useful in measurement of more abstract concepts, like emotions and reactions. A picture is worth 1000 words, and you can let it speak for itself to convey stronger messaging to respondents that you might not be able to put into words in a single written survey question.
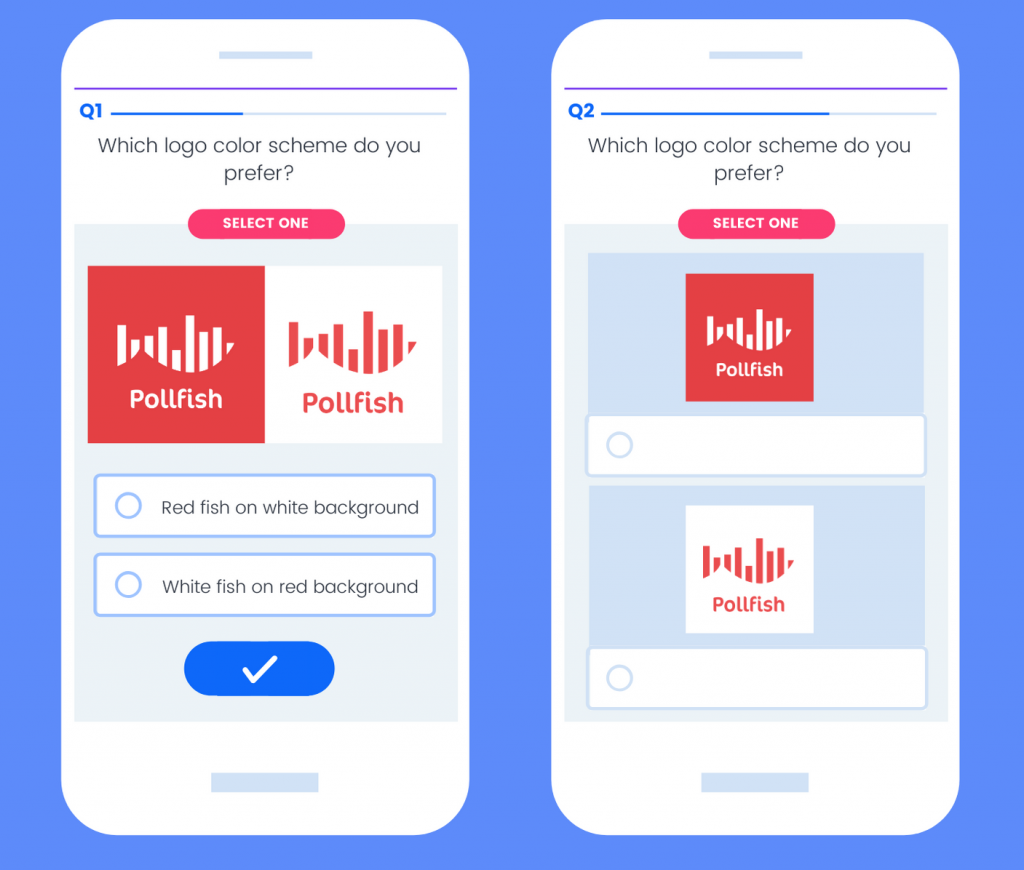
What media in survey questions are used for
Surveys using media questions are a great way to compare different concepts against one another or test and measure consumer reactions against their other, more emotional senses. Many brands use image-based surveys to test corporate logos and color schemes or measure brand recognition. Videos and gifs are excellent ways to test ad concepts before launch to see what consumers like or respond to. Audio additions to your survey may be the perfect way to choose the introductory theme song to your podcast or test for accessibility issues, ensuring that the tone, pitch, and accent being used is understandable and appealing for your target audience.
You can also allow your audience to respond to questions using an image, which is great for testing ad recall. Survey tools (like Pollfish) that offer these are a great help to people in all industries across a variety of different audio and visual testing needs, just make sure you have permission to use all media prior to testing.
Tips and FAQs for media survey questions
What kinds of media can you upload to Pollfish questions?
We support 3 different media types: Images, Video, and Audio files. You can add these into any of our question types, including screening questions. You can also include images in answer choices for the respondent to select a visual response. There is no limit to the number of images and videos you can include in your survey. There is also no limit to a video's duration.
Media, when used sparingly, can help the engagement of a survey, but when overdone can increase drop-offs. We don’t allow videos as answer choices, as these are typically too long for a mobile survey environment.
What sizes and file types are supported for media?
We allow one media file per question (image or video). The maximum size specs for each are as follows. These are NOT the recommended sizes. See below the image for recommended sizes.
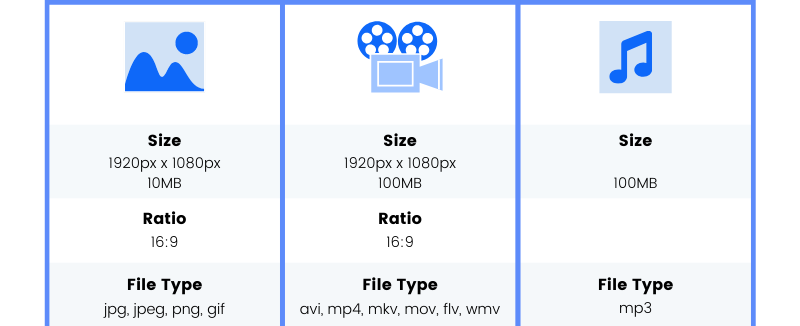
The recommended sizes of each media file are as follows:
Image:
- Max Size: 10MB
- Recommended: 1920px x 1080px, 2MB
- Ratio: 16:9
- File type: jpg, jpeg, png, gif
Video:
- Max Size: 100MB
- Recommended: 1920px x 1080px, 25MB
- Ratio: 16:9
- Duration: Unlimited
- File type: avi, mp4, mkv, mov, flv, wmv
Audio:
- Max Size: 100MB
- Duration: less than 120 seconds
- File type: mp3
What plans allow images, video, or audio?
Media additions come standard on all Pollfish plans. You may add as many images, audio files and videos to the questionnaire as you want on any of the question types. Video duration is unlimited while audio files have a maximum of 120 seconds.
Can you upload more than one image to a question in Pollfish?
You are only able to upload one image or video in the question type and one image per each answer selection. However, you can show two images side by side if uploaded as a single photo. Try to ensure a clear line of distinction to show a left and right image.
Can you use media in Pollfish screening questions?
You can add images to screening questions and their answers. Like all Pollfish questions that support media, you can add one image for the description and one image each for the answer choices.
Can you link to a video on a third party site?
We don’t allow any links to be added to our surveys, in text or in visual media. This is to protect surveys from re-routing respondents out of the experience. However, media can be uploaded into the questions so that they are embedded in the survey, keeping all respondents and data in one location.
How do you know if respondents have watched the full video?
Respondents cannot skip questions (unless they are in a skip-logic flow). That includes video— respondents aren’t able to move on to the next question until the video is complete. If the video is too long and the respondent opts out, it will be considered a drop-off and their responses will not be included in the final data. To encourage engagement and reduce drop-offs, we only support videos up to 2 minutes in length, although we suggest making them even shorter when you can.
How do you know what the image or video will look like?
In the Pollfish platform, it's recommended that you preview your questionnaire before launch. This shows you a mock-up mobile screen with an interactive version of your questionnaire. While this is helpful in viewing your media survey, you can also see how questions are formatted, catch any typos, and ensure your answers are shuffled prior to launch. Respondents are able to zoom in on images, but it's better if they don't need to take this action or rotate their device. We recommend uploading images in a vertical direction when possible to ensure they're upright and as large as possible to provide a better respondent experience.
If you have additional questions about our media capabilities or how to use Pollfish, please reach out to our 24/7 customer support team for assistance.

Setting age ranges in the Pollfish survey platform (Video)
Setting age ranges in the Pollfish survey platform
There are a number of reasons that age range can be an important, or even necessary, setting in a survey’s demographic targeting.

When should you set an age range in a survey?
If you are selling a product or service that is tailored to the needs or wants of a certain demographic, it is beneficial to be able to reach only those who fit your desired audience, rather than sending the survey broadly and having to throw away responses from people who aren’t a fit for your research audience.
This is true for any audience targeting criteria: if you are selling farming tools, it would make sense to avoid respondents living in urban areas. Similarly, responses from retirees will likely not give you valuable data if you are attempting to market a product to teens.
Targeting age groups in a survey can be used to include or exclude certain audiences by age range or quota. A common use is to ensure that respondents are of legal age to vote, drink, or smoke before asking questions that are related to those products.
Age range, and other demographics, are set at the beginning of the survey to hone in the right target audience.
How to identify and reach target audience age groups
Most survey tools include some demographic settings and others require a series of questions to hone in on these specifics. The best way to ask a question to learn the target audience’s age is to ask them to select an age range from a list of multiple-choice options.
A common sample question to define age group targeting for a survey is
What is the age group you belong to?
- 16-17
- 18-24
- 25-34
- 35-44
- 45-55
- >54
- Prefer not to say
In Pollfish, all demographic data is gathered from respondents when they join the Pollfish survey audience. Rolling profiling keeps this data up to date to ensure respondent details are accurate.
Because we already have this information, you don’t need to ask respondents about their age or birthday, you can simply set the targeting criteria you want and we will distribute the survey to people who meet the targeting requirements.
You can ask additional screening questions to target specific attitudes or behaviors that will further narrow the target audience.
How to set age range targeting in Pollfish
When you are creating a Pollfish survey, you begin with your audience targeting page. Here, you will find all age groups listed and selected already. If you want to only reach a segment of the population, for example, those age 18-34, you can deselect the other categories. Only those which you have chosen will receive the survey.
You can also apply quotas to these groups in order to weight the percentage of respondents from each cohort who receive the survey.
If you have a specific age group that you’re looking for, such as Gen Z audiences, you may need to input exact ages to reach the range that best fits for you. This can be done by selecting “Specific age range” and inputting a minimum and maximum range for your audience.
Because we are COPPA compliant, we don’t survey children age 15 or younger. The youngest members of the Pollfish audience are 16.
Mobile surveys help you reach target audience age groups
A unique benefit of Pollfish is the mobile distribution model. The world is becoming increasingly accessible by mobile device, with nearly everyone having a smartphone at their disposal. Additionally, mobile is the primary (or only) way that some people connect to the internet.
App-based surveys offer a massive reach to survey audiences of all ages, including harder to reach segments such as Gen Z, international audiences, and specific markets.
Using mobile ad IDs rather than a survey link, we can map demographics back to individual users of a device (as mobile phones are rarely used by more than one person).
This also means that we are able to maintain demographic profiling on respondents so you can target and tailor questions for them, rather than spending your time creating questions asking them their basic data.
This article updated April 2020 to reflect changes to COPPA regulations regarding minimum targeting age.
Frequently asked questions
Why should you set an age range in a survey?
You should set an age range in a survey if you are selling a product or service tailored to the needs of a certain demographic. It is beneficial to be able to reach only those who fit your desired audience, rather than sending the survey broadly and having to throw away responses from people who aren’t a fit for your research audience.
Do age ranges help with targeting an audience in market research?
Age range is one of several targeting criteria in market research. Targeting age groups in a survey can be used to include or exclude certain audiences by age range or quota. A common use is to ensure that respondents are of legal age to vote, drink, or smoke before asking questions that are related to those products.
When should you set an age range in an online survey?
Age range, and other demographics, are set at the beginning of the survey to hone in the right target audience.
How can researchers identify and reach target audience age groups in an online survey?
Most survey tools include some demographic settings and others require a series of questions to hone in on respondents' age. The best way to ask a question to learn the target audience’s age is to ask them to select an age range from a list of multiple-choice options.
A common sample question to define age group targeting for a survey is

Hire a research expert for your next project
Hire a research expert for your next project
TL;DR: Get the infographic!
Whether you want to do it yourself, or need a little assistance, there are different degrees of hands-on support available to design and launch your ideal Pollfish survey.

One of the ways that Pollfish stands out from other survey platforms is by offering our users real research expertise in building and designing the survey they need.
This is a powerful way to get the most out of the Pollfish platform.
Why trust your survey to a research expert?
Every role and industry has a need for data to learn, measure, and grow its success. However, not everyone who needs data has a background in research or analytics. This is why we offer Pollfish users the option to hire a research expert for their projects.
Bringing a research expert on board has been helpful for clients working on particularly complicated research projects, such as setting up a recurring study for brand tracking, as well as those who are newer to the platform and want more hands-on guidance with how the platform works. Even those who might like to run a Pollfish survey, but simply don’t have the time can rely on their researcher to set up, design, and launch a survey on their behalf giving them the power of a professional researcher on their team on a project-by-project basis.
The professional researchers at Pollfish are experts in market research best practices as well as the Pollfish platform, bridging the knowledge and experience gap typically left by market research tools that rely on a completely self-serving model.
How to hire a research expert
Adding a research expert to your project is an easy three-step process that sets your survey up for success.
Start by logging into your Pollfish dashboard. In the dashboard you'll see the option to "Hire an Expert," marked in green, on the upper right hand side, right beside your email address. This way, you can directly hire a research expert.
From there, you’ll be given an overview of what to expect during your process and invited to book a free consultation with a research expert.
During the free initial consultation, you’ll have the chance to chat with an expert who will work with you to understand your research goals and needs. Then, they will be able to build a quote based on how many questions, the number of completed responses, and the targeting parameters you will need to complete your research.
The quote from your expert will be based on the scope and targeting needed for your project, as well as the fee for their service. This amount ranges on the complexity of the project and is considered on a case-by-case basis, however, you will be quoted all associated costs of your project upfront to ensure you have all the information you need to make the right decision.
If you choose to hire a researcher to your team, your expert will be added to your team in the Pollfish platform, where they will ensure your survey project is properly designed and launched.
All researchers on the professional services team are experts in survey market research, as well as Pollfish’s tool and features, so you can feel confident that you have made an investment in your survey’s success.
What services do research experts provide?
Hiring a research expert in Pollfish offers a layer of customization beyond what the DIY platform offers. Some of the most common examples of work that our research experts have done for our clients include:
Building your survey on Pollfish.
If you have a survey created already and would like to deploy it on Pollfish but aren’t sure where to start, our research experts can offer a hands-on introduction. They will invite you to join them for a walkthrough of the platform as they design and set up your existing survey for you, giving you confidence that it’s done correctly and giving you the tools to launch it yourself next time.
Survey creation and design.
One of the most popular needs is having someone with professional experience and platform familiarity available to manage survey creation for you. For lean teams or those too busy or unsure about research to manage their own projects, Pollfish experts can take the burden of survey design and research off your plate entirely.
Data analysis
. Oftentimes when results come back they can be hard to interpret. Apart from knowing the ins and outs of our platform, our experts are professionals in distilling insights into usable information to make the most of your project.
Consulting on complex projects.
Oftentimes projects have bigger needs and harder-to-reach audiences that require the years of research experience that we offer. Our experts have been users of the platform since the beginning and have helped to shape many of the features, so they know exactly how to set up a Pollfish survey for even the most customized research needs.
Because project goals and needs can vary so significantly, it’s best to book a free consultation to align on expectations. Experts are committed to empowering you with what you need from DIY research, whether it's better platform education or lending a helping hand to your team. An initial conversation will help them guide you to the best solution for your project.
Other experts at Pollfish
If you’re not sure if your survey requires a professional researcher or would like to get started on your own, there are other professionals at Pollfish who are happy to help.
Pollfish Elite plan includes dedicated account managers to provide answers and guide you to resources to build your best survey. Account managers serve as a single point of contact for clients on this plan to contact for any Pollfish-related questions they have.
Our basic plan offers a pay-as-you-go model for those unable to commit to a larger plan, but still offers elite customer service. Our 24/7 CX team is made up of real people who can offer support throughout the survey creation process. They manually review every survey that is launched on the platform, giving them insight into common needs for all kinds of users and projects.
No matter your skill level or research goals, we are confident that we have the team that can help you get there.

How to weight your survey results in Pollfish (Video)
How to weight your survey results in Pollfish
Surveys aim to gather insights from certain populations of interest. Oftentimes, that population of interest is large and diverse, which can make it very difficult to gather enough data from sample that is representative of the whole. This is why some researchers use survey weighting.

How post-stratification works
Because research cannot always be conducted against a statistically representative sample, Pollfish created and launched the post-stratification feature. Post-stratification adds survey weighting to age and gender demographics to match what those populations should be according to the census data for that region, then adjusts the results to reflect the change.
For example, if a survey is conducted to the general population of the United States, the number of participants may skew male or female, older or younger, and not reflect the actual demographic makeup of the country. When post-stratification is applied, results are adjusted against the census data to develop a more accurate dataset with just one click.
Who should use post-stratification?
Post-stratification survey weighting is an especially powerful tool for researchers working with large, diverse populations, such as entire countries. In cases like these, it can be hard to reach a representative sample of the demographics that make up the population of interest. To ensure that the results are representative of the area, researchers can select “post-stratification” on their results page when a survey is complete and weighted data will be displayed below the raw data that reflects a more accurate representation of the audience, according to the census data for their region.
Benefits of the post-stratification feature
There are a number of ways that post-stratification survey weighting can help researchers.
- Statistically representative audience: Post-stratification offers more statistically representative age and gender data for 34 countries globally, and individually against the 50 US states and Puerto Rico.
- Rapid weighting: Researchers who need data stratification have often done manual weighting to adjust their results. Post-stratification offers a single click to view the weighted data.
- Exporting and Analysis: If you want to view or manage post-stratified data outside of Pollfish, weighted data is included as an extra column in Excel and SPSS exports.
- Income stratification: When possible, post-stratification will include weighted data for respondents’ income for audiences in the United States and Canada. It is not required for respondents to provide this information so if the field is missing, post-stratification cannot be completed.
Demographics weighted for Census data
When stratification is applied at the end of the survey, age and gender are weighted to reflect the census data of the region in which the survey was conducted. Age and gender are included in all 34 countries to which post-stratification is applicable. In the US, each state’s census data will be used automatically unless there is insufficient data for that state, in which case it will default to the general country’s population.
Income stratification is restricted to the US and Canada as the census data for income in the EU is unavailable. Income stratification is only available when a sufficient amount of data has been supplied by the respondents, as it is not a required field during profiling. If corresponding census data is unavailable for any field in the US, Canada, or the EU, stratification cannot be completed.
How post-stratification accounts for younger audiences (ages 0-14)
The Child Online Privacy Protection Act (COPPA) limits the collection and use of personal information about children (defined as those under age 13) by operators of online services. As a COPPA compliant company, Pollfish does not target audiences younger than 14 years of age, however, Census data includes information from children at any age. To account for this, we used a linear weighted model to distribute the participation of audiences under 14 years old across all the other age groups in the census.
Census data used in survey weighting
The United States Census data is available in every US state and is as recent as 2017. The information used comes directly from the American Community Survey (ACS), an ongoing survey conducted by the US Census Bureau. As the largest household survey administered by the Census Bureau, the data is continually collected and used by businesses in both the public and private sectors. It contains census data for all 50 US states, the District of Columbia, and Puerto Rico.
The census data for the EU comes from Eurostat’s 2011 population and housing census survey. The survey is conducted decennially among the 28 countries belonging to the EU, as well as Iceland, Liechtenstein, Norway, and Switzerland.
Geographic regions that support post-stratification
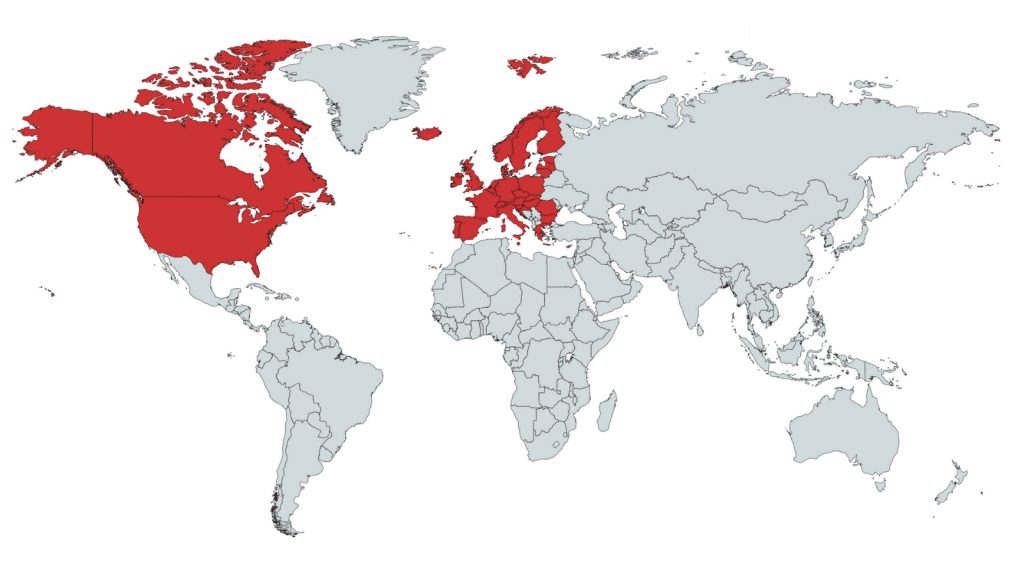
Pollfish post-stratification of age and gender is available in all of the following countries:
Austria
Belgium
Bulgaria
Canada
Croatia
Cyprus
Czechia
Denmark
Estonia
Finland
France
Germany
Greece
Hungary
Iceland
Ireland
Italy
Japan
Latvia
Liechtenstein
Lithuania
Luxembourg
Malta
Netherlands
Norway
Poland
Portugal
Romania
Slovakia
Slovenia
Spain
Sweden
Switzerland
United Kingdom
United States
Weighted data for North America
In the United States, post-stratification can be applied to all 50 US states, the District of Columbia (Washington DC) and Puerto Rico. Because the weighted data is based upon the ACS by the US Census Bureau, US territories (American Samoa, Guam, the Northern Mariana Islands, and the US Virgin Islands) are not able to be stratified.
Income post-stratification is only available in the United States and Canada, as the census data for the EU doesn’t include income. Because income is not a mandatory field in initial respondent profiling, it cannot be stratified if the information provided by respondents regarding it is insufficient. It will be automatically included in post-stratification results for the US and Canada if the data is available.
Post-stratification of multiple countries
Post-stratification can be applied to surveys that field to multiple countries, so long as all of the countries have corresponding census data. The responses are collected, age and gender stratified to the census data representative of the respondent’s country, and the data of all countries is merged and presented with appropriate weighting applied for a complete dataset on the results page.
Tips for using Pollfish post-stratification
Fortunately, applying post-stratification is as simple as selecting the button “post-stratification” on the results page, but there are still a couple of considerations to keep in mind when using this exciting feature.
When to use post-stratification vs quotas
Post-stratification is a powerful feature for researchers looking to ensure their raw data is representative of the general population. Using census data as a control, researchers are able to instantly weight their results by selecting “post-stratification” when the survey completes. Researchers might use this in a survey of a general population.
However, if a survey must meet a set percentage of participants from an age or gender group, setting quotas at the beginning of the survey is the way to go. Quotas may cause the survey to take a bit longer but will ensure that the distribution of respondents from each cohort is exact, rather than manipulating the data to match a percentage based on the results. Quotas would be a better fit for reaching a specific audience that isn’t representative of the general population, such as readers of a certain publication where the researcher knows the audience skews female.
Quotas and custom age ranges do not affect the stratification algorithm, so it is possible to apply survey weighting to your results even if these targeting parameters have been applied. There is no added benefit to using these together, as they both are designed to adjust data for different reasons.
Exporting post-stratified results
Weighted results can be exported in Excel and SPSS as another column added onto the regular export data. PDF export is currently unavailable.
When results can be stratified
Post-stratification is not viewable in real-time, it is only available once the survey is complete and all responses are collected. Once all results are in, they can be weighted instantly by selecting “post-stratification” on the left-hand side of the results dashboard. The stratified results will appear below the raw data.

Household Income Levels By Country
Household Income Mapping: Understanding Household Income Levels By Country

Demographic questions are translated and tailored to each country and culture through multilingual surveys and other question differentiators. One of the key differentiators in each country is the income ranges used. To address this properly, Pollfish created an outline based on the appropriate census to show household income levels by country.
USA
| Income Level | Range |
|---|---|
| Lower income I | Under $25,000 |
| Lower income II | Between $25,000 and $49,999 |
| Middle income I | Between $50,000 and $74,999 |
| Middle income II | Between $75,000 and $99,999 |
| High income I | Between $100,000 and $124,999 |
| High income II | Between $125,000 and $149,999 |
| High income III | $150,000 or more |
Argentina
| Income Level | Range |
|---|---|
| Lower income I | Menos de $15,000 |
| Lower income II | $15,000 a $29,999 |
| Middle income I | $30,000 a $44,999 |
| Middle income II | $45,000 a $74,999 |
| High income I | $75,000 a $124,999 |
| High income II | $125.000 a $199,999 |
| High income III | $200.000 o más |
Australia
| Income Level | Range |
|---|---|
| Lower income I | Under AU$15 000 |
| Lower income II | Between AU$15 000 and AU$29 999 |
| Middle income I | Between AU$30 000 and AU$44 999 |
| Middle income II | Between AU$45 000 and AU$74 999 |
| High income I | Between AU$75 000 and AU$124 999 |
| High income II | Between AU$125 000 and AU$199 999 |
| High income III | AU$200 000 or more |
Azerbaijan
| Income Level | Range |
|---|---|
| Lower income I | 25500₼-dan az |
| Lower income II | 25499₼ və 59499₼ arasında |
| Middle income I | 59500₼ və 118999₼ arasında |
| Middle income II | 119000₼ və 178499₼ arasında |
| High income I | 178500₼ və 237999₼ arasında |
| High income II | 238000₼ və 297499₼ arasında |
| High income III | 297500₼ və ya daha çox |
Bangladesh
| Income Level | Range |
|---|---|
| Lower income I | ৳1,275,000-এর কম |
| Lower income II | ৳1,275,000 এবং ৳15,999,999-এর মধ্যে |
| Middle income I | ৳16,000,000 এবং ৳32,999,999-এর মধ্যে |
| Middle income II | ৳33,000,000 এবং ৳49,999,999-এর মধ্যে |
| High income I | ৳50,000,000এবং ৳67,999,999-এর মধ্যে |
| High income II | ৳68,000,000 এবং ৳84,999,999-এর মধ্যে |
| High income III | ৳85,100,000 বা তার অধিক |
Belgium
| Income Level | Range |
|---|---|
| Lower income I | Moins de 22.000€ |
| Lower income II | Entre 22.000€ et 44.000€ |
| Middle income I | Entre 44.000€ et 65.999€ |
| Middle income II | Entre 66.000€ et 87.999€ |
| High income I | Entre 88.000€ et 109.999€ |
| High income II | Entre 110.000€ et 131.999€ |
| High income III | 200 000 € et plus |
Brazil
| Income Level | Range |
|---|---|
| Lower income I | Abaixo de R$5000 |
| Lower income II | R$5.001 a R$10.000 |
| Middle income I | R$10.001 a R$20.000 |
| Middle income II | R$20.001 a R$40.000 |
| High income I | R$40.001 a R$50.000 |
| High income II | R$50.001 a R$60.000 |
| High income III | R$60.001 ou mais |
Bulgaria
| Lower income I | Под 15.000 |
| Lower income II | Между 15.000 и 29.999лв |
| Middle income I | Между 30.000 и 44.999 лв |
| Middle income II | Между 45.000 и 74,999 лв |
| High income I | Между 75.000 и 124.999 лв |
| High income II | Между 125.000 и 199.999 лв |
| High income III | 200.000 лв или повече |
Canada
| Income Level | Range |
|---|---|
| Lower income I | Under C$25 000 |
| Lower income II | Between C$25 000 and C$49 999 |
| Middle income I | Between C$50 000 and C$74 999 |
| Middle income II | Between C$75 000 and C$99 999 |
| High income I | Between C$100 000 and C$159 999 |
| High income II | Between C$160 000 and C$199 999 |
| High income III | C$200 000 or more |
Chile
| Income Level | Range |
|---|---|
| Lower income I | <4.000.000 CLP$ |
| Lower income II | 4.000.000 - 12.000.000 CLP$ |
| Middle income I | 12.000.000 - 20.000.000 CLP$ |
| Middle income II | 20.000.000 - 30.000.000 CLP$ |
| High income I | 30.000.000 - 48.000.000 CLP$ |
| High income II | 48.000.000 - 80.000.000 CLP$ |
| High income III | >80.000.000 CLP$ |
China
| Income Level | Range |
|---|---|
| Lower income I | 10,000¥ 以下 |
| Lower income II | 介於 10,000 到 24,999¥ 元之間 |
| Middle income I | 介於 25,000 到 39,999¥ 元之間 |
| Middle income II | 介於 40,000 到 59,999¥ 元之間 |
| High income I | 介於 60,000 到 89,999¥ 元之間 |
| High income II | 介於 90,000 到 149,999¥ 元之間 |
| High income III | 150,000¥ 元以上 |
Columbia
| Income Level | Range |
|---|---|
| Lower income I | <11.500.000 COP$ |
| Lower income II | 11.500.000 - 35.000.000 COP$ |
| Middle income I | 35.000.000 - 70.000.000 COP$ |
| Middle income II | 70.000.000 - 95.000.000 COP$ |
| High income I | 95.000.000 - 135.000.000 COP$ |
| High income II | 135.000.000 - 230.000.000 COP$ |
| High income III | >230.000.000 COP$ |
Czech Republic
| Income Level | Range |
|---|---|
| Lower income I | Pod Kč 25,000 |
| Lower income II | Mezi Kč 25,000 a Kč 49,999 |
| Middle income I | Mezi Kč 50,000 a Kč 74,999 |
| Middle income II | Mezi Kč 75,000 a Kč 99,999 |
| High income I | Mezi Kč 100,000 a Kč 124,999 |
| High income II | Mezi Kč 125,000 a Kč 149,999 |
| High income III | Kč 150,000 nebo více |
Denmark
| Income Level | Range |
|---|---|
| Lower income I | Under 160.000 kr |
| Lower income II | Mellem 160.000 kr og 320.000 kr |
| Middle income I | Mellem 320.000 kr og 499.999 kr |
| Middle income II | Mellem 499.000 kr og 649.999 kr |
| High income I | Mellem 650.000 kr og 799.999 kr |
| High income II | Mellem 800.000 kr og 949.999 kr |
| High income III | 950.000 kr eller mere |
Ecuador
| Income Level | Range |
|---|---|
| Lower income I | $5,000 |
| Lower income II | $5,001-15,000 |
| Middle income I | $15,001-22,000 |
| Middle income II | $22,001-35,000 |
| High income I | $35,001-55,000 |
| High income II | $55,001-100,000 |
| High income III | >$100,000 |
Egypt
| Income Level | Range |
|---|---|
| Lower income I | أقل من 12.000 ج.م |
| Lower income II | من 12.000 الى 19.999 ج م |
| Middle income I | من 20.000 الى 29.999 ج م |
| Middle income II | من 30.000 الى 39.999 ج م |
| High income I | من 40.000 الى 54.999 ج م |
| High income II | من 55.000 الى 72.000 ج م |
| High income III | أكثر من 72.000 ج.م |
Estonia
| Income Level | Range |
|---|---|
| Lower income I | 840000 € või rohkemAlla 14.400 € |
| Lower income II | 14.400 - 19.999 € |
| Middle income I | 20.000 - 29.999 € |
| Middle income II | 30.000 - 49.999 € |
| High income I | 50.000 - 64.999 € |
| High income II | 65.000 - 84.000 € |
| High income III | 84.000 € või rohkem |
Finland
| Income Level | Range |
|---|---|
| Lower income I | 200 000 € or moreAlle €22 000 |
| Lower income II | €22 000 ja €44 000 välillä |
| Middle income I | €44 000 ja €66 000 välillä |
| Middle income II | €66 000 ja €88 000 välillä |
| High income I | €88 000 ja €110 000 välillä |
| High income II | €110 000 ja €132 000 välillä |
| High income III | yli €132 000 |
France
| Income Level | Range |
|---|---|
| Lower income I | Moins de 22.000€ |
| Lower income II | Entre 22.000€ et 44.000€ |
| Middle income I | Entre 44.000€ et 65.999€ |
| Middle income II | Entre 66.000€ et 87.999€ |
| High income I | Entre 88.000€ et 109.999€ |
| High income II | Entre 110.000€ et 132.000€ |
| High income III | 200.000 € et plus |
Germany
| Income Level | Range |
|---|---|
| Lower income I | Unter €22.000 |
| Lower income II | Zwischen €22.000 und €44.000 |
| Middle income I | Zwischen €44.000 und €65.999 |
| Middle income II | Zwischen €66.000 und €87.999 |
| High income I | Zwischen €88.000 und €109.999 |
| High income II | Zwischen €110.000 und €131.999 |
| High income III | mehr als €132.000 |
Georgia
| Income Level | Range |
|---|---|
| Lower income I | 47,500 ამერიკულ დოლარამდე |
| Lower income II | 47,500-დან 126,199 ამერიკულ დოლარამდე |
| Middle income I | 126,200-დან 252,399 ამერიკულ დოლარამდე |
| Middle income II | 252,400-დან 378,599 ამერიკულ დოლარამდე |
| High income I | 378,600-დან 504,799 ამერიკულ დოლარამდე |
| High income II | 504,800-დან 630,999 ამერიკულ დოლარამდე |
| High income III | 631,000 ამერიკულ დოლარზე მეტი |
Greece
| Income Level | Range |
|---|---|
| Lower income I | Λιγότερο από €15.000 |
| Lower income II | €15.000 έως €29.999 |
| Middle income I | €30.000 έως €44.999 |
| Middle income II | €45.000 έως €74.999 |
| High income I | €75.000 έως €124.999 |
| High income II | €125.000 έως €199.999 |
| High income III | €200.000 και περισσότερο |
Hungary
| Income Level | Range |
|---|---|
| Lower income I | 600 000 Ft vagy kevesebb |
| Lower income II | 600 000 – 1 439 999 Ft |
| Middle income I | 1 440 000 – 2 039 999 Ft |
| Middle income II | 2 040 000 – 2 999 999 Ft |
| High income I | 3 000 000 – 4 199 999 Ft |
| High income II | 4 200 000 – 5 999 999 Ft |
| High income III | 6 000 000 Ft felett |
India
| Income Level | Range |
|---|---|
| Lower income I | Under 50,000 Rupees |
| Lower income II | 50,000 Rupees to 149,999 Rupees |
| Middle income I | 150,000 Rupees to 199,999 Rupees |
| Middle income II | 200,000 Rupees to 349,999 Rupees |
| High income I | 350,000 Rupees to 499,999 Rupees |
| High income II | 500,000 Rupees to 699,999 Rupees |
| High income III | 700,000 Rupees or more |
Indonesia
| Income Level | Range |
|---|---|
| Lower income I | Kurang dari Rp 370.533.000 |
| Lower income II | Antara Rp 370.533.000 dan Rp 741.032.000 |
| Middle income I | Antara Rp 741.032.000 dan Rp 1,111,647,000 |
| Middle income II | Antara Rp 1,111,647,000 dan Rp 1,482,436,000 |
| High income I | Antara Rp 1,482,436,000 dan Rp 1,853,034,400 |
| High income II | Antara Rp 1,853,034,400 dan Rp 2,222,960,200 |
| High income III | Rp 2,222,960,200 ke atas |
Ireland
| Income Level | Range |
|---|---|
| Lower income I | Less than €15,000 |
| Lower income II | €15,000 to €29,999 |
| Middle income I | €30,000 to €44,999 |
| Middle income II | €45,000 to €74,999 |
| High income I | €75,000 to €124,999 |
| High income II | €125,000 to €199,999 |
| High income III | €200,000 and above |
Israel
| Income Level | Range |
|---|---|
| Lower income I | מתחת ל-54,999₪ |
| Lower income II | בין 55,000₪ ל- 499,999₪ |
| Middle income I | בין 500,000₪ ל- 999,999₪ |
| Middle income II | בין 1,000,000₪ ל- 1,999,999₪ |
| High income I | בין 2,000,000₪ ל- 2,499,999₪ |
| High income II | בין 2,500,000₪ ל- 2,999,999₪ |
| High income III | 3,000,000₪ או מעל |
Italy
| Income Level | Range |
|---|---|
| Lower income I | Meno di €22,000 |
| Lower income II | Fra €22,000 e €43,999 |
| Middle income I | Fra €44,000 e €65,999 |
| Middle income II | Fra €66,000 e €87,999 |
| High income I | Fra €88,000 e €109,999 |
| High income II | Fra €110,000 e €131,999 |
| High income III | €132,000 e oltre |
Japan
| Income Level | Range |
|---|---|
| Lower income I | 280万円未満 |
| Lower income II | 280万~558万円未満 |
| Middle income I | 558万円~836万円未満 |
| Middle income II | 836万円~1115万円未満 |
| High income I | 1115万円~1394万円未満 |
| High income II | 1394万円~1673万円未満 |
| High income III | 1673万円以上 |
Kenya
| Income Level | Range |
|---|---|
| Lower income I | Under 200000 KES |
| Lower income II | 200000 KES-500000 KES |
| Middle income I | 500001 KES-800000 KES |
| Middle income II | 800001 KES-2000000 KES |
| High income I | 20000001 KES-4000000 KES |
| High income II | 4000001 KES-6000000 KES |
| High income III | 6000001 KES or more |
Korea
| Income Level | Range |
|---|---|
| Lower income I | ₩190,000,000 미만 |
| Lower income II | ₩190,000,000 ~ ₩349,999,999 |
| Middle income I | ₩349,999,999 ~ ₩499,999,999 |
| Middle income II | ₩500,000,000 ~ ₩649,999,999 |
| High income I | ₩650,000,000 ~ ₩899,999,999 |
| High income II | ₩900,000,000 ~ ₩1,120,000,000 |
| High income III | ₩1,120,000,000 以上 |
Latvia
| Income Level | Range |
|---|---|
| Lower income I | Zem €12,000 |
| Lower income II | €12,000 - €16,999 |
| Middle income I | €17,000 - €24,999 |
| Middle income II | €25,000 - €44,999 |
| High income I | €45,000 - €69,999 |
| High income II | €70,000 - €99,999 |
| High income III | €100,000 vai vairāk |
Lithuania
| Income Level | Range |
|---|---|
| Lower income I | < 3 600 € |
| Lower income II | Tarp 3 600 € ir 4 999 € |
| Middle income I | Tarp 5 000 € ir 9 999 € |
| Middle income II | Tarp 10 000 € ir 14 999 € |
| High income I | Tarp 15 000 € ir 19 999 € |
| High income II | Tarp 20 000 € ir 23 999 € |
| High income III | 24 000 € ar daugiau |
Malaysia
| Income Level | Range |
|---|---|
| Lower income I | MYR 0 - 15,000 |
| Lower income II | MYR 15,000 - MYR 29,999 |
| Middle income I | MYR 30,000 - MYR 44,999 |
| Middle income II | MYR 45,000 - MYR 74,999 |
| High income I | MYR 75,000 - MYR 124,999 |
| High income II | MYR 125,000 - MYR 199,999 |
| High income III | MYR 200,000 + |
Mexico
| Income Level | Range |
|---|---|
| Lower income I | 0 -180,000 Pesos |
| Lower income II | 180,000 - 359,999 Pesos |
| Middle income I | 360,000 – 539,999 Pesos |
| Middle income II | 540,000 - 899,999 Pesos |
| High income I | 900,000 - 1,499,999 Pesos |
| High income II | 1,500,000 - 2,399,999 Pesos |
| High income III | 2,400,000+ Pesos |
Netherlands
| Income Level | Range |
|---|---|
| Lower income I | minder dan €12 499 |
| Lower income II | Tussen 22 000€ en 43 500€ |
| Middle income I | Tussen 43 500€ en 65 500€ |
| Middle income II | Tussen 65 500€ en 87 500€ |
| High income I | Tussen 87 500€ en 109 000€ |
| High income II | Tussen 109 000€ en 131 000€ |
| High income III | 131 000€ of meer |
Nigeria
| Income Level | Range |
|---|---|
| Lower income I | Under 500000 NGN |
| Lower income II | 500001 NGN-3000000 NGN |
| Middle income I | 3000001 NGN-12000000 NGN |
| Middle income II | 12000001 NGN-28000000 NGN |
| High income I | 28000001 NGN-40000000 NGN |
| High income II | 40000001 NGN-50000000 NGN |
| High income III | 50000001 or more |
Norway
| Income Level | Range |
|---|---|
| Lower income I | Mindre enn 200 000 NOK |
| Lower income II | 200 000 – 299 999 NOK |
| Middle income I | 300 000 - 549 999 NOK |
| Middle income II | 550 000 - 799 999 NOK |
| High income I | 800 000 - 999 999 NOK |
| High income II | 1 000 000 - 1 199 999 NOK |
| High income III | Mer enn 1 200 000 NOK |
Pakistan (Pashto)
| Income Level | Range |
|---|---|
| Lower income I | له Rs 144 0000 څخه لږ |
| Lower income II | د Rs 1 444 000 او Rs 4 499 999 ترمنځ |
| Middle income I | د Rs 5 500 000 او Rs 9 999 999 ترمنځ |
| Middle income II | د Rs 10 000 000 او Rs 14 999 999 ترمنځ |
| High income I | د Rs 15000000 او Rs 19999999 ترمنځ |
| High income II | د Rs 20 000 000 او Rs 23 999 999 ترمنځ |
| High income III | له Rs 24 000 000 څخه لوړ |
Pakistan (Punjabi)
| Income Level | Range |
|---|---|
| Lower income I | 1 440 000 Rs ਤੋਂ ਘੱਟ |
| Lower income II | 1 440 000 Rs ਤੋਂ 4 499 999 Rs ਵਿਚਕਾਰ |
| Middle income I | 5 500 000 Rs 9 999 999 Rs ਵਿਚਕਾਰ |
| Middle income II | 10 000 000 Rs ਤੋਂ 14 999 999 Rs ਵਿਚਕਾਰ |
| High income I | 15 000 000 Rs ਤੋਂ 19 999 999 Rs ਵਿਚਕਾਰ |
| High income II | 20 000 000 Rs ਤੋਂ 23 999 999 Rs ਵਿਚਕਾਰ |
| High income III | 24 000 000 Rs ਜਾਂ ਇਸ ਤੋਂ ਵੱਧ |
Persia
| Income Level | Range |
|---|---|
| Lower income I | کمتر از ₪55,000 |
| Lower income II | بین ₪55,000 و ₪999,999 |
| Middle income I | بین ₪1,000,000 و ₪1,499,999 |
| Middle income II | بین ₪1,500,000 و ₪1,999,999 |
| High income I | بین ₪2,000,000 و ₪2,499,999 |
| High income II | بین ₪2,500,000 و ₪2,999,999 |
| High income III | 3,000,00₪ یا بیشتر |
Peru
| Income Level | Range |
|---|---|
| Lower income I | <20.000 PEN |
| Lower income II | 20.000 - 60.000 PEN |
| Middle income I | 60.000 - 90.000 PEN |
| Middle income II | 90.000 - 145.000 PEN |
| High income I | 145.000 - 225.000 PEN |
| High income II | 225.000 - 400.000 |
| High income III | >400.000 PΕΝ |
Philippines
| Income Level | Range |
|---|---|
| Lower income I | Mababa sa PHP 150,000 |
| Lower income II | Sa pagitan ng PHP 150,000 at PHP 299,999 |
| Middle income I | Sa pagitan ng PHP 300,000 at PHP 449,999 |
| Middle income II | Sa pagitan ng PHP 450,000 at PHP 749,999 |
| High income I | Sa pagitan ng PHP 750,000 at 1,249,999 |
| High income II | Sa pagitan ng PHP 1,250,000 at PHP 1,999,999 |
| High income III | PHP 2,000,000 o higit pa |
Poland
| Income Level | Range |
|---|---|
| Lower income I | 0 - 12000 PLN |
| Lower income II | 12001 - 24000 PLN |
| Middle income I | 24001 - 48000 PLN |
| Middle income II | 48001 - 72000 PLN |
| High income I | 72001 - 96000 PLN |
| High income II | 96001 - 120000 PLN |
| High income III | 120001 +Portugal |
Portugal
| Income Level | Range |
|---|---|
| Lower income I | Inferior a 20.000 € |
| Lower income II | Entre 20.000 € 39.999 € |
| Middle income I | Entre 40.000 € 64.999 € |
| Middle income II | Entre 65.000 € 84.999 € |
| High income I | Entre 85.000 € 104.999 € |
| High income II | Entre 105.000 € 124.999 € |
| High income III | 125 000 € ou mais |
Romania
| Income Level | Range |
|---|---|
| Lower income I | Sub 101.995 RON |
| Lower income II | Între 101.995 RON și 203.986 RON |
| Middle income I | Între 203.990 RON și 305.981 RON |
| Middle income II | Între 305.985 RON și 407.976 RON |
| High income I | Între 407.980 RON și 509.971 RON |
| High income II | Între 509.975 RON și 611.966 RON |
| High income III | Peste 611.970 RON |
Russia
| Income Level | Range |
|---|---|
| Lower income I | До 1.700.000 рублей |
| Lower income II | Между 1.700.000 и 3.999.999 рублей |
| Middle income I | Между 4.000.000 и 5.099.999 рублей |
| Middle income II | Между 5.100.000 и 6.799.999 рублей |
| High income I | Между 6.800.000 и 8.499.999 рублей |
| High income II | Между 8.500.000 и 10.199.999 рублей |
| High income III | От 10.200.000 рублей и более |
Saudi Arabia
| Income Level | Range |
|---|---|
| Lower income I | أقل من 36،000 ريال سعودي |
| Lower income II | بين 36،000 ريال سعودي و 83،999 ريال سعودي |
| Middle income I | بين 84،000 ريال سعودي و 119،999 ريال سعودي |
| Middle income II | بين 120،000 ريال سعودي و 179،999 ريال سعودي |
| High income I | بين 180،000 ريال سعودي و 239،999 ريال سعودي |
| High income II | بين 240،000 ريال سعودي و 299،999 ريال سعودي |
| High income III | 300،000 ريال سعودي أو أكثر |
Serbia
| Income Level | Range |
|---|---|
| Lower income I | Испод 2.500.000 RSD |
| Lower income II | Између 2.500.000 RSD и 5.000.000 RSD |
| Middle income I | Између 5.000.000 RSD и 7.500.000 RSD |
| Middle income II | Између 7.500.000 RSD и 10.000.000 RSD |
| High income I | Између 10.000.000 RSD и 12.500.000 RSD |
| High income II | Између 12.500.000 RSD и 15.000.000 RSD |
| High income III | 15.000.000 RSD или више |
Singapore
| Income Level | Range |
|---|---|
| Lower income I | Less than S$15,000 |
| Lower income II | S$15,000 to S$29,999 |
| Middle income I | S$30,000 to S$44,999 |
| Middle income II | S$45,000 to S$74,999 |
| High income I | S$75,000 to S$124,999 |
| High income II | S$125,000 to S$199,999 |
| High income III | S$200,000 and above |
Slovakia
| Income Level | Range |
|---|---|
| Lower income I | Menej ako 12 000€ |
| Lower income II | Medzi 12 000€ a 21 999€ |
| Middle income I | Medzi 22 000€ a 51 999 € |
| Middle income II | Medzi 52 000€ a 71 999€ |
| High income I | Medzi 72 000€ a 91 999€ |
| High income II | Medzi 92 000€ a 120 000€ |
| High income III | 120 000€ alebo viac |
Spain
| Income Level | Range |
|---|---|
| Lower income I | Menos de 22.000€ |
| Lower income II | Entre 22.000 € y 44.000€ |
| Middle income I | Entre 44.000€ y 65.999€ |
| Middle income II | Entre 66.000€ y 87.999€ |
| High income I | Entre 88.000€ y 109.999€ |
| High income II | Entre 110.000€ y 131.999€ |
| High income III | 132.000€ o más |
South Africa
| Income Level | Range |
|---|---|
| Lower income I | Less than R150,000 |
| Lower income II | R150,000 to R299,999 |
| Middle income I | R300,000 to R449,999 |
| Middle income II | R450,000 to R749,999 |
| High income I | R750,000 to R1,249,999 |
| High income II | R1,250 000 to R1,999,999 |
| High income III | R2,000,000 and above |
Sweden
| Income Level | Range |
|---|---|
| Lower income I | Under 225.000 SEK |
| Lower income II | Mellan 225.000 och 450.000 SEK |
| Middle income I | Mellan 450.000 och 675.000 SEK |
| Middle income II | Mellan 675.000 och 900.400 SEK |
| High income I | Mellan 900.400 och 1,125.000 SEK |
| High income II | Mellan 1,125.000 och 1,350.000 SEK |
| High income III | 1,350.000 SEK eller mer |
Switzerland
| Income Level | Range |
|---|---|
| Lower income I | Moins de 40 000 CHF |
| Lower income II | Entre 40 000 et 49 999 CHF |
| Middle income I | Entre 50 000 et 69 999 CHF |
| Middle income II | Entre 70 000 et 99 999 CHF |
| High income I | Entre 100 000 et 129 999 CHF |
| High income II | Entre 130 000 et 249 999 CHF |
| High income III | 250 000 CHF ou plus |
Taiwan
| Income Level | Range |
| Lower income I | NT$ 500000 以下 |
| Lower income II | NT$500001 to NT$899999 |
| Middle income I | NT$900000 to NT$1299999 |
| Middle income II | NT$1300000 to NT$1649999 |
| High income I | NT$1650000 to NT$1999999 |
| High income II | NT$2000000 to NT$4999999 |
| High income III | NT$5000000 以上 |
Thailand
| Income Level | Range |
| Lower income I | 239,999 บาท หรือต่ำกว่า |
| Lower income II | ระหว่าง 240,000 ถึง 479,999 บาท |
| Middle income I | ระหว่าง 480,000 ถึง 719,999 บาท |
| Middle income II | ระหว่าง 720,000 ถึง 959,999 บาท |
| High income I | ระหว่าง 960,000 ถึง 1,199,999 บาท |
| High income II | ระหว่าง 1,200,000 ถึง 1,799,999 บาท |
| High income III | 1,800,000 บาท ขึ้นไป |
Turkey
| Income Level | Range |
|---|---|
| Lower income I | 25.000₺ altı |
| Lower income II | 25.000₺ ile 49.999₺ arası |
| Middle income I | 50.000₺ ile 74.999₺ arası |
| Middle income II | 75.000₺ ile 99,999₺ arası |
| High income I | 100.000₺ ile 124.999₺ arası |
| High income II | 125.000₺ ile 149.999₺ arası |
| High income III | 150.000₺ ve üstü |
Ukraine
| Income Level | Range |
|---|---|
| Lower income I | Нижче ніж ₴120 000 |
| Lower income II | Між ₴120 000 та ₴199 999 |
| Middle income I | Між ₴200 000 та ₴499 999 |
| Middle income II | Між ₴500 000 та ₴999 999 |
| High income I | Між ₴1 000 000 та ₴2 999 999 |
| High income II | Між ₴3 000 000 та ₴3 599 999 |
| High income III | ₴3600000 та більше |
United Kingdom
| Income Level | Range |
|---|---|
| Lower income I | Under £15 000 |
| Lower income II | Between £15 000 and £29 999 |
| Middle income I | Between £30 000 and £44 999 |
| Middle income II | Between £45 000 and £74 999 |
| High income I | Between £75 000 and £124 999 |
| High income II | Between £125 000 and £199 999 |
| High income III | £200 000 or more |
United Arab Emirates
| Income Level | Range |
|---|---|
| Lower income I | أقل من 25,000 دولار أمريكي |
| Lower income II | بين 25,000 و 49,999 دولار أمريكي |
| Middle income I | بين 50,000 و 74,999 دولار أمريكي |
| Middle income II | بين 75,000 و 99,999 دولار أمريكي |
| High income I | بين 100,000 و 124,999 دولار أمريكي |
| High income II | بين 125,000 و 149,999 دولار أمريكي |
| High income III | 150,000 دولار أمريكي أو أكثر |
Uzbekistan
| Income Level | Range |
|---|---|
| Lower income I | $25,000 dan kam |
| Lower income II | $50,000 va $74,999 oʻrtasida |
| Middle income I | $50,000 va $74,999 oʻrtasida |
| Middle income II | $75,000 va $99,999 oʻrtasida |
| High income I | $100,000 oʻrtasida va $124,999 |
| High income II | $125,000 va $149,999 oʻrtasida |
| High income III | $150,000 yoki undan koʻproq |
Vietnam
| Income Level | Range |
|---|---|
| Lower income I | ít hơn 26 triệu đồng |
| Lower income II | từ 26 triệu đồng đến ít hơn 34 triệu đồng |
| Middle income I | từ 34 triệu đồng đến ít hơn 52 triệu đồng |
| Middle income II | từ 52 triệu đồng đến ít hơn 104 triệu đồng |
| High income I | từ 104 triệu đồng đến ít hơn 207 triệu đồng |
| High income II | ừ 207 triệu đồng đến ít hơn 462 triệu đồng |
| High income III | 462 triệu đồng/năm hoặc nhiều hơn |
Zambia
| Income Level | Range |
|---|---|
| Lower income I | Under ZMW 100,000 |
| Lower income II | Between ZMW 100,000 and ZMW 199,999 |
| Middle income I | Between ZMW 200,000 and ZMW 349,999 |
| Middle income II | Between ZMW 350,000 and ZMW 499,999 |
| High income I | Between ZMW 500,000 and ZMW 749,999 |
| High income II | Between ZMW 750,000 and ZMW 999,999 |
| High income III | ZMW 1,000,000 or more |
For more information about Pollfish, or to get more detailed info about your next survey, contact the Pollfish customer experience team today!

How to use BigQuery with Pollfish data
How to use BigQuery with Pollfish data
Pollfish’s massive audience means a potentially massive amount of data to be analyzed. For clients running higher-volume surveys, our Elite plan often works best, and now it includes the ability to integrate Pollfish data directly with Google’s BigQuery database for easier, faster data analysis.

What is BigQuery?
Bigquery is Google’s answer to cloud-based data storage. It’s especially beneficial to those looking to segment and analyze large quantities of data rapidly.
The “serverless” model saves on set-up costs associated with complete server systems as well as offers high-speed updates and more opportunities to integrate with existing BI tools. BigQuery also uses a columnar storage design that makes it easy to run SQL queries with their AI optimizing the datasets in nearly real-time.
There’s no question that this is a massive aid to researchers working with high volume datasets who can’t risk their information becoming outdated in the time that it takes to process it properly.
Benefits of integrating BigQuery with Pollfish
BigQuery is where researchers can store, segment, and analyze their data from anywhere, but where they pull that information from is a different story. The tool makes this easy by offering the ability to integrate with data collection and analytics tools like Tableau, Looker, Data Studio, and most recently— Pollfish!
The Pollfish <> BigQuery integration allows us to push all existing and future survey data from your Pollfish account to your Google BigQuery database in real-time, including the survey demographics, questionnaire content, respondent profiles, and actual responses.
The implementation includes a ready-to-use query view that can be instantly applied to easily view and segment your Pollfish data.
What this means is that our Elite clients who use BigQuery can connect their Pollfish data directly to their database.
How to connect BigQuery and Pollfish
Please note that you must have a billing account with BigQuery and be on an Elite plan with Pollfish in order to integrate. Click here to visit BigQuery pricing.
- Begin by logging into your Google Cloud Platform account, or creating one if you do not have one yet.
- Go to “Console” and create or select the project that you want to use.


- From the left navigation pane, select APIs & Services—> Credential
- Once the Credentials page is displayed, select the Create credentials tab and choose Service Account Key from the listed options.


- Add a name for the service account. In our example, the account is “pollfish-bigdata-exporter.”
- Assign the role BigQuery—>BigQuery Data Owner to the account.
- Click “Create” and the service account file will be created and downloaded to your computer.


- For the last step, log into Pollfish in order to set up the integration.
- Go to MyAccount-> Integrations
- Upload the service account file (JSON) that you downloaded from your account in Google Cloud Platform in step 7.
- Enter a Dataset Name (allowed characters are letters, numbers, and underscores.)
- Select if you want to export all historical data from all your surveys or the data from new surveys only.

Keep in mind that once you configure the integration you cannot edit it. However, you are able to delete it and create a new one from scratch if you need to make changes.
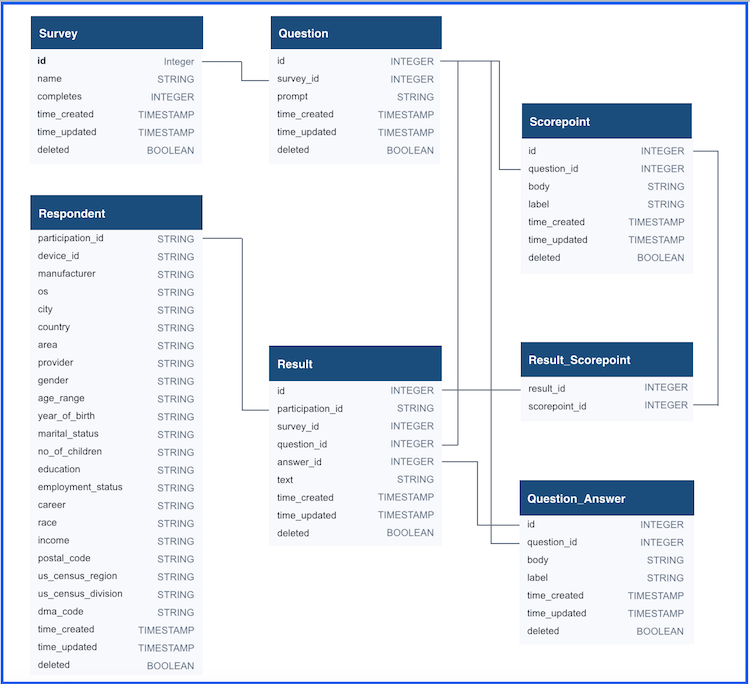
How to use Pollfish data in BigQuery
When your Pollfish surveys are exported, they will appear in seven BigQuery views: question, question_answer, respondent, result, result_scorepoint, scorepoint, and survey. Each view describes an element of the survey and the collected responses.
Note that these are de-duplicated views of the original tables that hold the data. They are shown with the same table names but start with an underscore. Do not use the tables as the tables may contain duplicates. Only use the views for your queries.
In addition, the data is generated in a single view (survey_view) showing a flat representation of the complete dataset. You may see the query that creates this view using the BigQuery UI, which may help you create your own queries in the tool of your preference, such as Tableau, Metabase, or others.
Below is a diagram showing the relationship between the entities of the exported database.
Pollfish<>BigQuery Integration FAQs
Some of the most frequently asked questions about setting up, troubleshooting, and integrating BigQuery with your Pollfish account can be found here. If you have additional questions or need assistance, feel free to reach out to support for more guidance.
- What will happen when I activate the BigQuery Sync?
- Can I get all my past surveys in BigQuery?
- Can I export a specific survey?
- What will happen if a survey is exported more than once?
- Can I see partial results of a survey currently in progress?
- I can't see the results of my survey in BigQuery.
- How are surveys stored in BigQuery?
- Where can I find all my surveys in BigQuery?
- What if I want to change my BigQuery service ID?
- Do I need to enable billing in BigQuery?
How do I get BigQuery on my Pollfish plan?
Pollfish only offers the BigQuery integration on Elite plan. Elite clients enjoy this feature at no additional cost, as well as a variety of other benefits tailored to high-volume client needs, such as additional seats for team members, lower CPIs, and dedicated account management.
To learn more about Pollfish service plans, visit our pricing page to compare options and choose the right fit for you. To upgrade your account to an Elite plan, contact sales@pollfish.com.

How to apply advanced skip logic with Pollfish (Video)
How to apply advanced skip logic with Pollfish
Advanced skip logic is a powerful feature that allows researchers to add layers to their questionnaire and go more in-depth with respondents who are the best fit for those questions.

New updates to advanced skip logic mean that instead of skipping a question or two, respondents can be directed towards a completely different sequence of questions within the same survey.
Standard questionnaire sequence
Before starting on skip logic, it's important to understand how it differs from a standard questionnaire. In a standard questionnaire, the respondent will complete all the questions asked in the order in which they are presented. If skip logic isn’t enabled, respondents will go through the regular sequence.
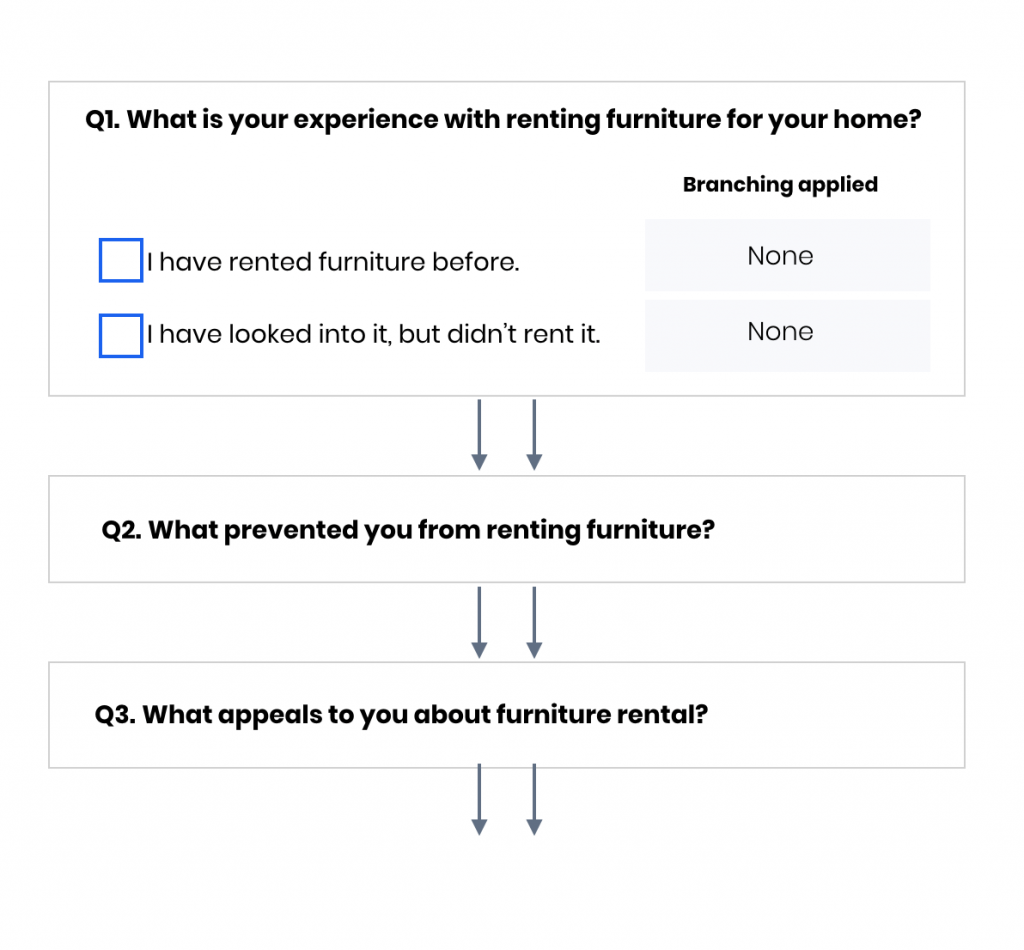
Skip Logic Sequence
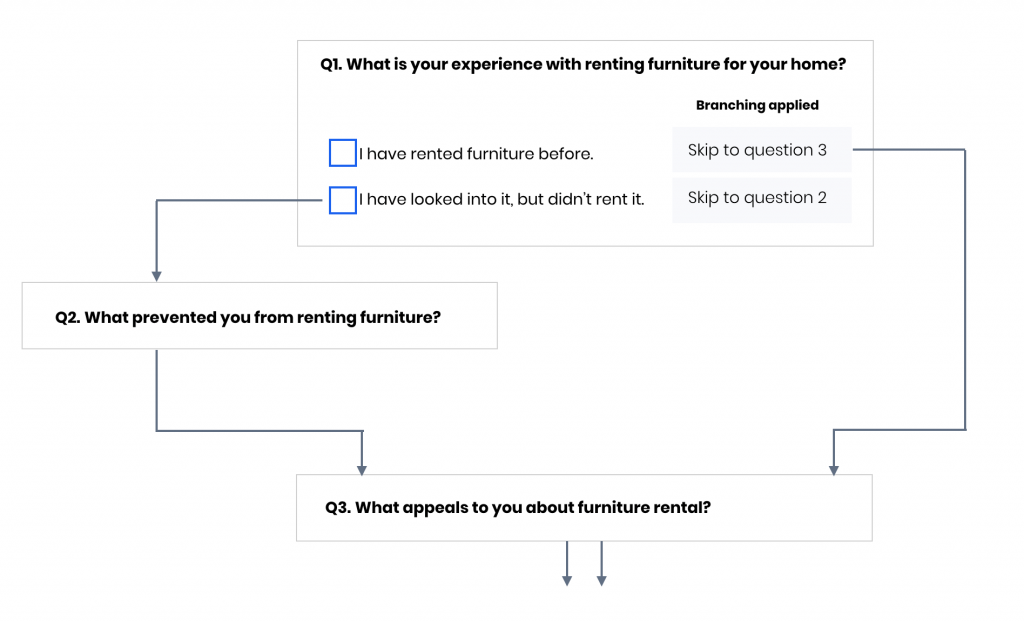
Skip logic sequencing involves “branching”, which allows you to channel respondents towards different questions based on the responses they have already given. For example, if a respondent says that they have completed an action, you can allow them to skip a question that asks them to explain why they didn’t complete it.
We’ve recently augmented our skip logic, so it now features more advanced capabilities.
Advanced Skip Logic Sequence
Much like a standard skip logic sequence, advanced skip logic channels respondents into different questionnaire sequences based upon the answers they have already given. However, advanced skip logic offers multiple layers of branching to create a series of question paths that offer more in-depth data for researchers.
That is to say that with advanced skip logic, the system will automate respondents to jump onto a specific question based on their answer or answers (if it’s multiple-selection). The advanced skip logic iteration can be used on any question type.
As such, respondents will only be presented with questions according to what they’ve already selected, so as to not receive every question in the questionnaire or necessarily be aware of the complexities of the survey. Instead, they will only see the questions most relevant to them.
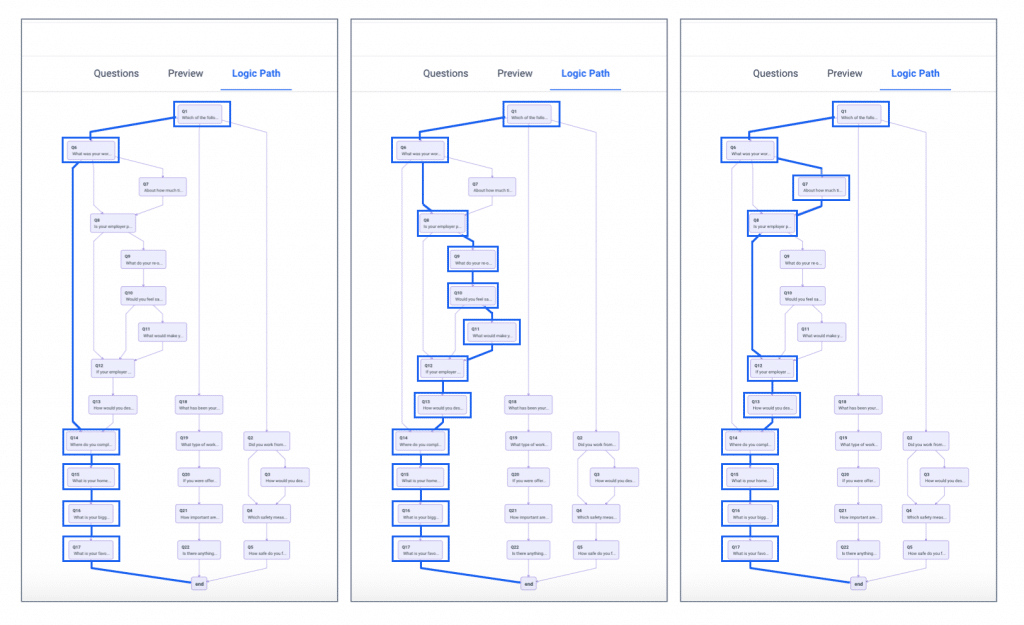 A question path is the sequence of questions a single respondent will take in a survey.
Advanced skip logic might look a bit intimidating, but is one of the most specialized and valuable features on the Pollfish platform.
Applying advanced skip logic on Pollfish
Applied logic involves the previous questions and answers used in the survey. You can also put combined logic into action, using any answer the respondent had already answered.
On the Pollfish platform, you can create this sequence yourself in your questionnaire builder. Log into your account and create or select the survey you wish to apply logic to.
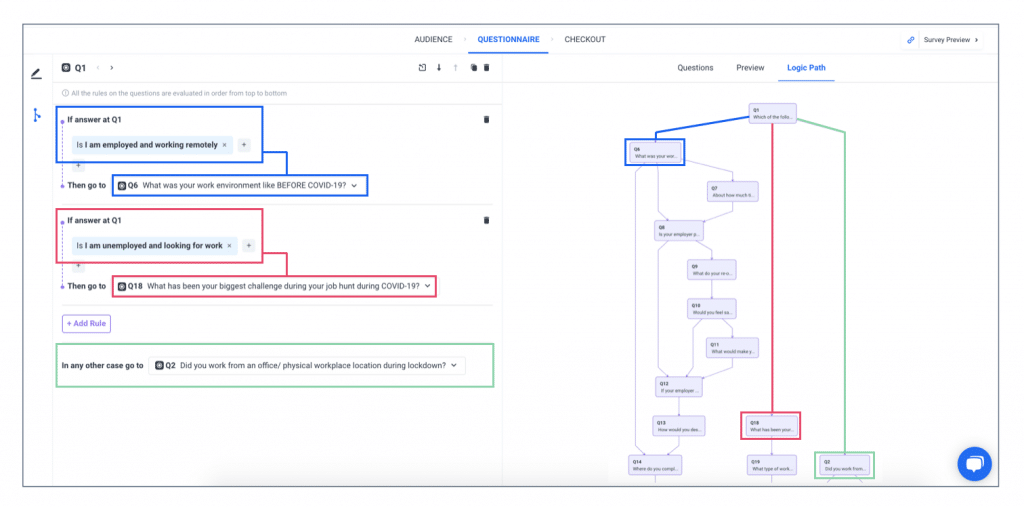
When you’re ready to add your questions, you’ll see the ‘branching’ icon on the left that lets you toggle between your standard questionnaire and skip logic views. From there you can select which question the respondent will skip to based on their responses.
In skip logic view, you can add “rules” to questions on the left and preview the logic path on the right. Rules follow if/then logic, meaning that if one thing is chosen, another thing will occur. For example, IF a respondent chooses that they are “employed and working remotely”, THEN they will be fast-tracked to Question 6.
Like all surveys, it’s best to keep your research goals in mind when creating your questionnaire and to start in a document where you can easily edit your questions. Although you can always edit and reorder them in Pollfish, particularly large or complicated surveys (such as those using multi-layered skip logic) can be easier to visualize on paper first.
Max Questionnaire Path
With advanced skip logic applied, surveys can become quite long on the backend, but respondents won’t be presented with every question. In mobile surveys, long questionnaires are at risk of low completion rates due to boredom and frustration, so we limit the number of questions a single respondent can be presented with.
The Max Questionnaire path is the maximum number of questions a respondent could possibly be presented with if they were to choose all of the possible variants in a series of questions. As a mobile-first survey tool, we uphold the respondent experience by allowing no more than 50 questions in the Max Questionnaire path.
Advanced skip logic is now available on all question types, including for ranking and matrix questions. It cannot be applied when grouping and randomization is enabled.
If you still have questions, check out our video to get a walkthrough of this great feature, or if you have additional questions about using or implementing advanced skip logic, our 24/7 support team is always here to help out.