More Than DIY – New Services on Our Platform!
New Services on Our Platform! 🎉
Get ready for some exciting news! Pollfish, your go-to DIY market research platform, has just leveled up! Thanks to our partnership with Prodege, we now offer additional services directly through our platform. This means that Pollfish clients can now access the whole suite of Prodege market research services in a snap!
🤝 Pollfish & Prodege: A Dynamic Duo
While some of you are familiar with our relationship with Prodege, many of you may not be aware of the valuable services they offer. To make life easier, we've integrated a section in our platform for users to select Prodege services directly. Let's take a closer look at what's new!
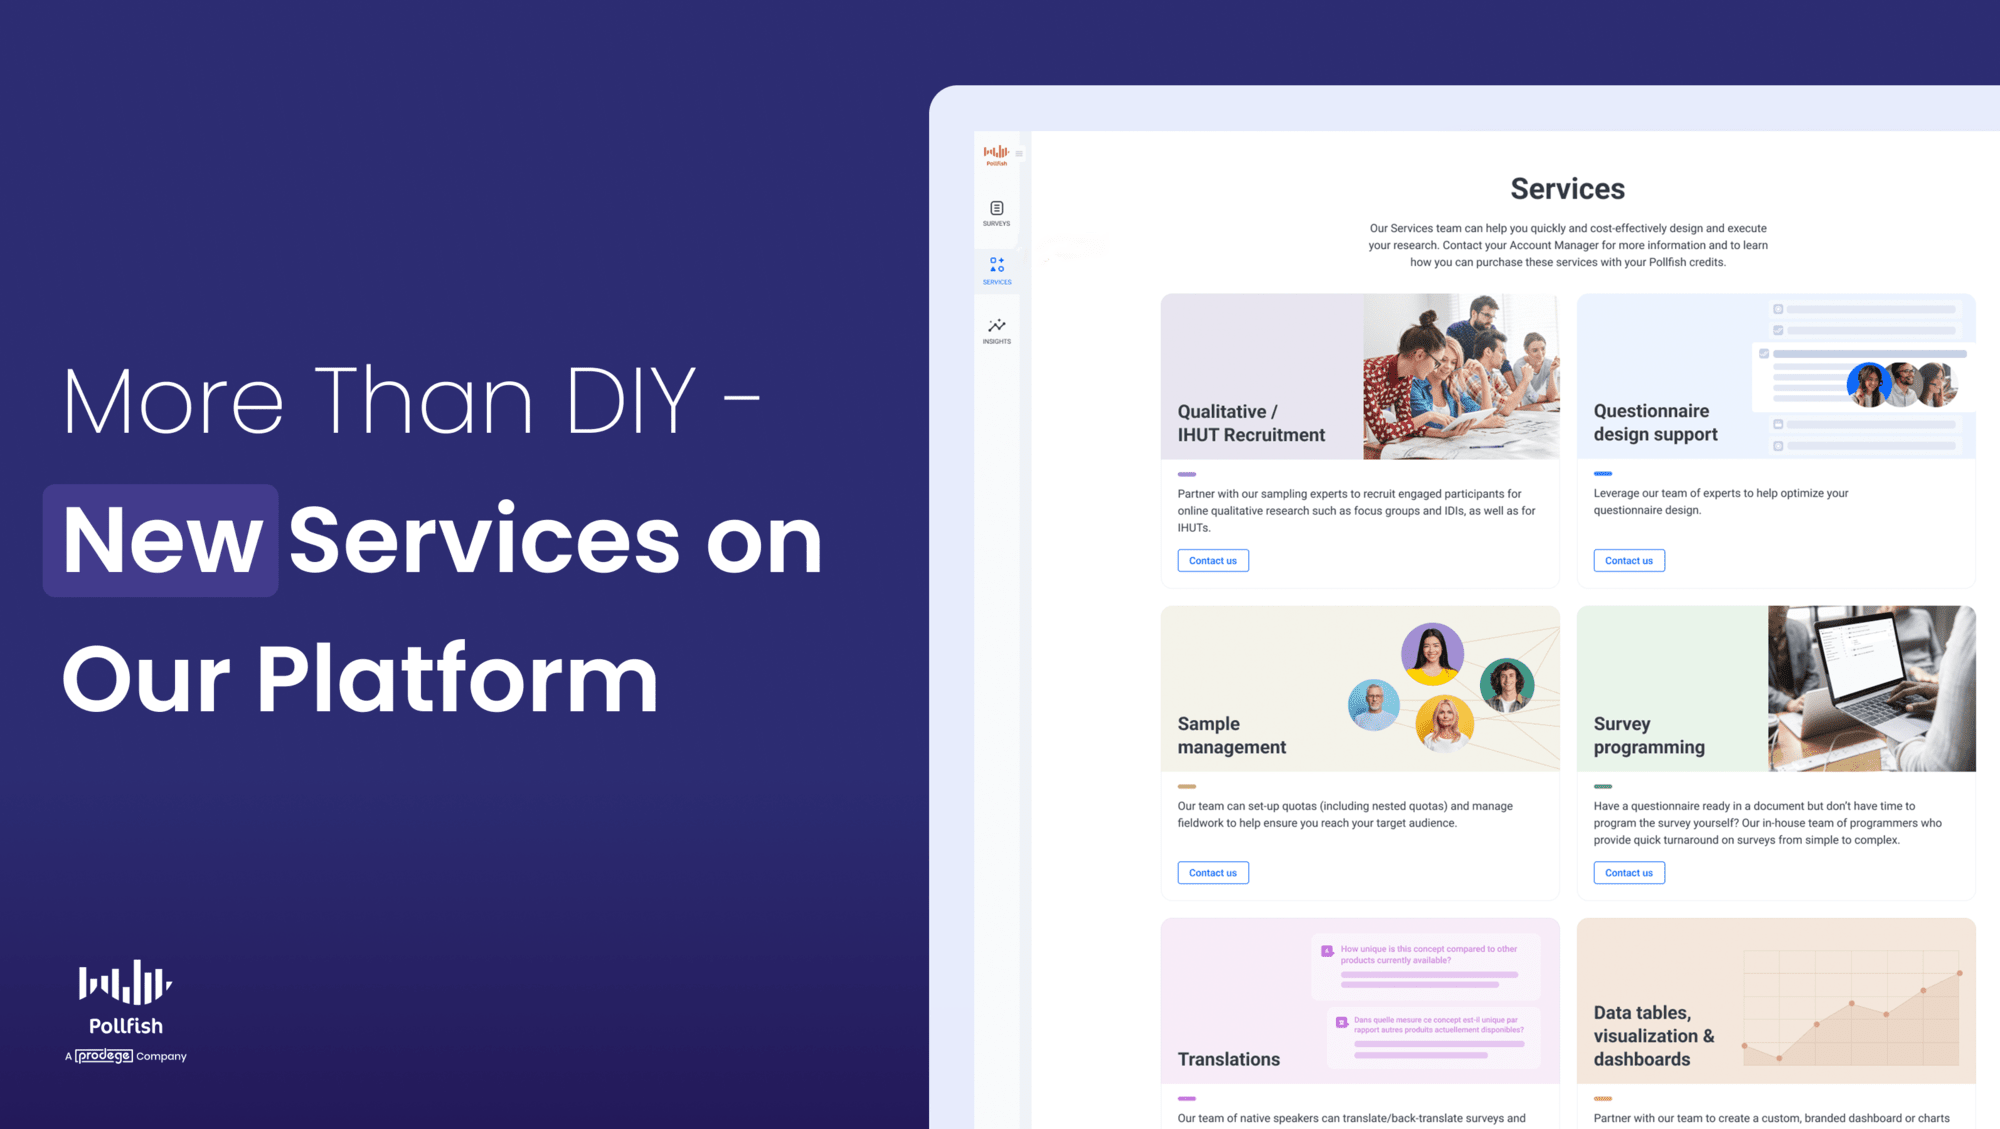
📢 Announcing 7 New Services at Your Fingertips!
🎤 Qualitative / IHUT Recruitment - Need engaged participants for online qualitative research, focus groups, IDIs, or IHUTs? Our sampling experts have your back! Ensure the right audience is recruited for valuable insights, improving research reliability.
📚 Questionnaire Design Support - Optimize your questionnaire design with the help of our team of experts! Achieve better data quality and reduce potential biases through a well-designed questionnaire.
🎩 Sample Management - Let our team set up quotas (including nested quotas) and manage fieldwork to ensure you reach your target audience. Streamline fieldwork and reduce sampling errors for more accurate and representative data.
💻 Survey Programming - Need to program a survey from a document? Our in-house team provides quick turnaround on surveys from simple to complex. Save time and effort while ensuring your survey is programmed accurately and efficiently.
🌐 Translations - Have your surveys and open-ended responses translated/back-translated into 50+ languages by our team of native speakers. Reach a global audience and enhance cross-cultural understanding with accurate translations.
📊 Data Tables, Visualization & Dashboards - Create custom, branded dashboards or PowerPoint charts and graphs using our innovative Insights Builder tool. Make your data more understandable and visually appealing for impactful presentations.
📈 Topline Insights Report - Collaborate with our insights experts to generate topline reports with key findings from your survey data. Quickly identify essential trends and findings, simplifying data-driven decision making.
DIY to DI-WHY-Not: Expanding Your Capabilities
We know that Pollfish users are used to doing things themselves. However, we also understand that you may be pressed for time, need help, or require market research services beyond our capabilities. With our new Prodege-powered services, you no longer have to choose between DIY and expert assistance. You can have it all! By teaming up with Prodege, we're providing you with a seamless, end-to-end market research experience that saves you time 🕒, money 💰, and resources 🌳.
How It Works
As you’ll see in the screenshot below, all you need to do is select services tab on the left when you're logged into the Pollfish platform, and you'll be able to select from these 7 services, in which you'll be connected with the appropriate expert:

A Celebration of Collaboration
Ready to try our new services? They're available right now on our platform. Simply select the Prodege services you need, and let us do the rest! Whether you're a seasoned Pollfish user or new to our platform, our team of experts is here to help you take your market research to the next level.
Let's make market research more accessible, efficient, and enjoyable together! Don't miss out on this amazing opportunity to enhance your research capabilities and achieve even greater success with Pollfish and Prodege! 🥳
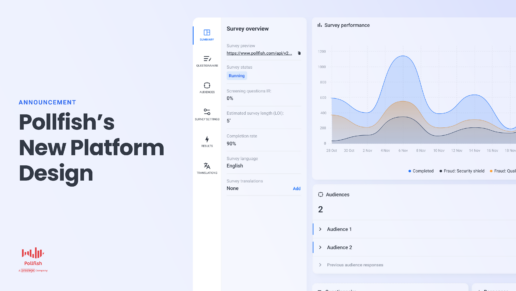
Pollfish's New Platform Design
Pollfish's New Platform Design

Pollfish has revamped its user interface to enhance the experience for survey creators and to pave the way for numerous exciting features this year.
There are two main changes.
Update #1: New survey summary page.
Section 1: Survey Overview.
Need a quick overview of your survey? This section provides information on survey status. Depending on your survey type, this may include statuses such as draft, pending, paused, active, completed. You will also find other relevant information such as incidence rate (IR), estimated length of interview (LOI), completion rate, languages, translations, a brief preview, and easy access to downloads.
Section 2: Survey Performance.
Looking for insight into completion time? This section helps you visualize your survey's completion rate with a straightforward time series chart, and additional details on completion.
Section 3: Audience Snapshot.
Want to verify your target audience quickly? Obtain a concise snapshot of the selected audience(s), including all preselected demographic targeting criteria.
Section 4: Status Funnel.
Curious about drop-offs in your survey? This section enables you to see the number of people reaching each stage of the survey. Depending on your survey this may include stages such as accepted, passed profiling, passed screening, started survey, and finished survey.
Update #2: New menu navigation.
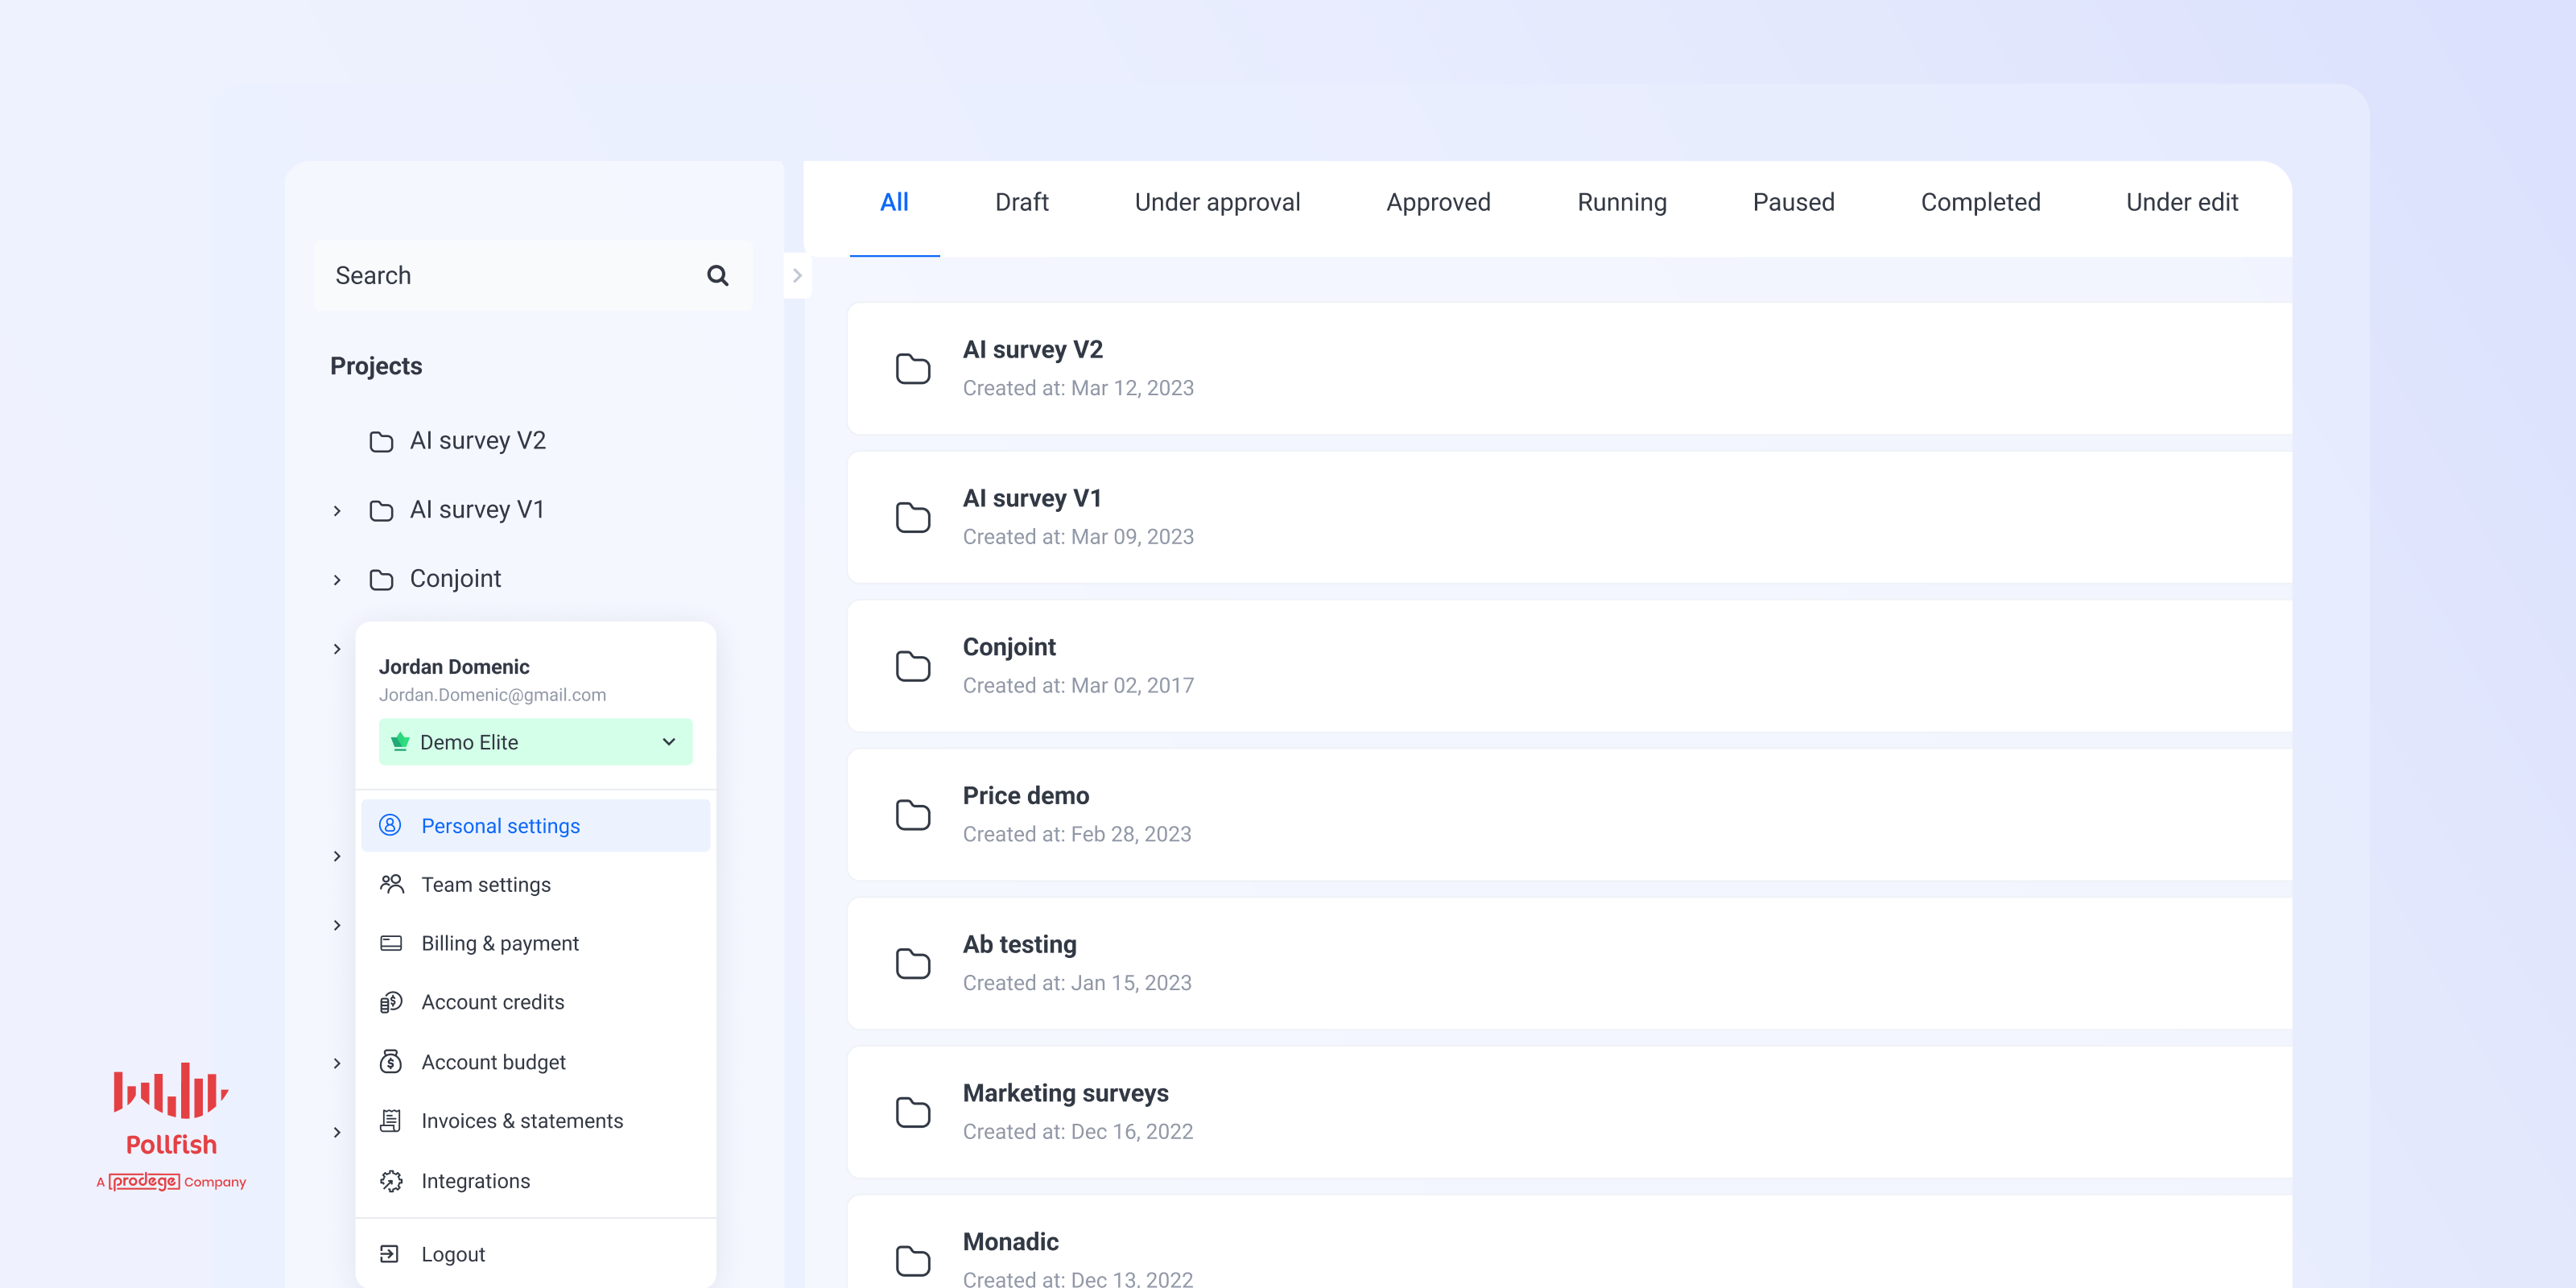
You might notice a subtle change in Pollfish's layout. Folders and surveys now appear in a panel on the left, while account details have moved from the top-right corner to the bottom-left corner.
This update allows direct access to surveys nested in folders from the side panel and, more importantly, prepares the interface for advantageous features arriving this year.
A New Data Visualization Tool for Surveys
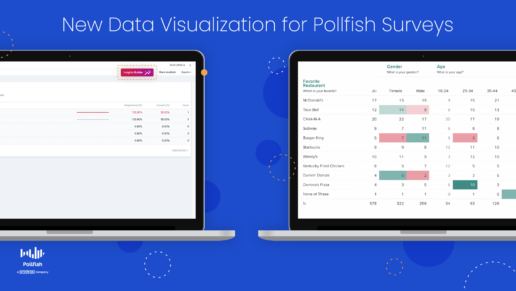
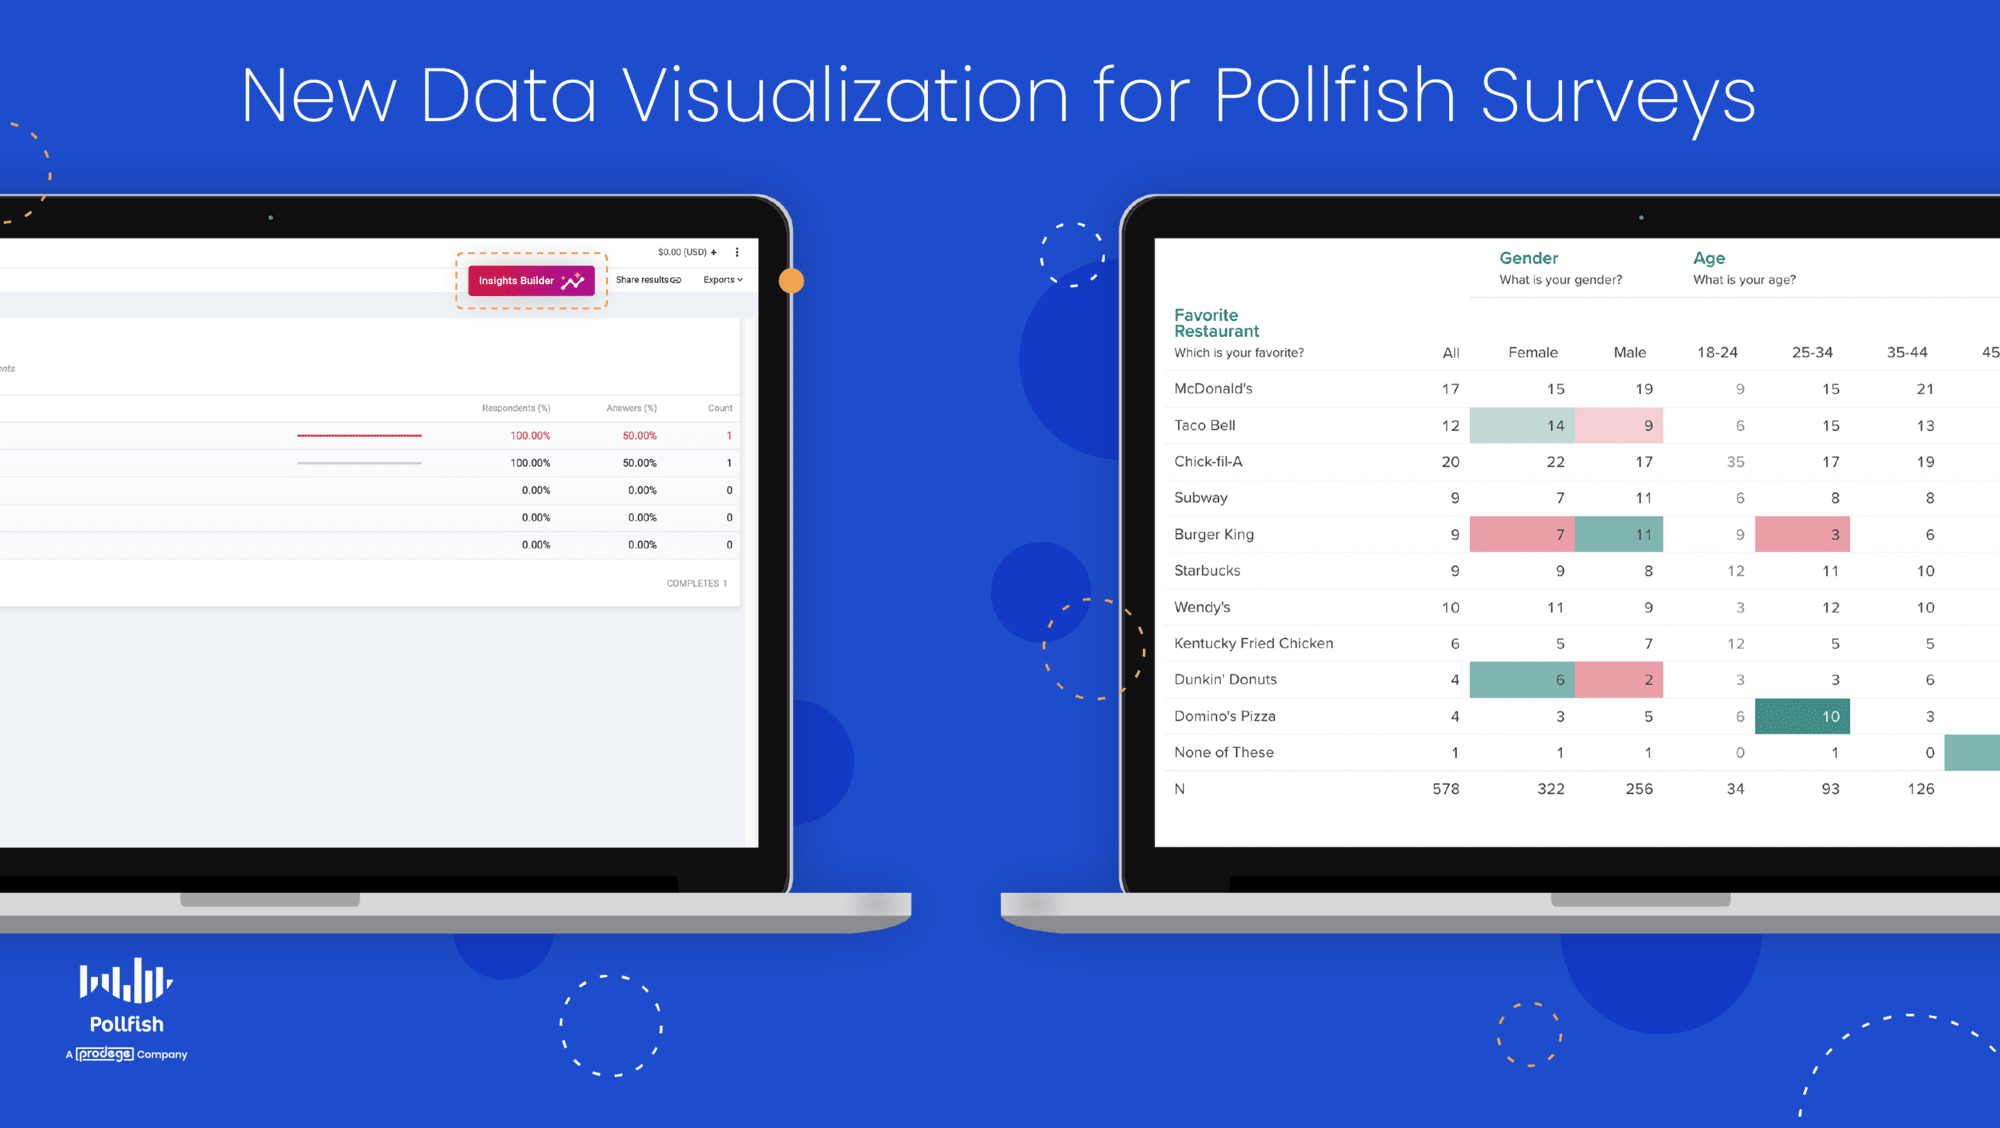
Meet Insights Builder, the New Data Visualization Tool for Pollfish Surveys
Want an easier, more colorful way to analyze and present your Pollfish survey data?
Look no further! With our new integration to the Prodege Insights Builder, you can enhance your survey analysis by adding valuable data visualization to your survey data.
Add Data Visualization with a Single Click.
Easily add data visualization to your next survey.
- Open a survey in your Pollfish dashboard.
- Click the “Insights Builder” button.
It really is that simple.
Analyze, Visualize, & Share Results.
With this new data visualization tool, you can:
- Analyze:
- Use a custom interactive online database to display key insights.
- Cross-tabulate, add filter logic, create new variables, apply stat testing.
- Visualize:
- Illustrate your business objectives clearly with visualization techniques.
- Craft rich and easily edited slide visuals in your organization's branding.
- Share:
- Collaborate with your team internally through Pollfish by sharing directly.
- Control access and broadly share with internal and external stakeholders.
How "Insights Builder" Works
Only researchers in the Elite plan can access the Insights Builder tool via the Pollfish interface.
The export to Insights Builder can be initiated per survey by the researchers, but not all surveys are automatically synced. Once initiated, all survey updates (new responses received, new revisions added, survey renames, etc.) are synced in real-time.
First-time survey export
For a survey that has not been synced to the data viz tool, the researcher can view the “Insights Builder” option on the survey menu and the results page. A new window will ask you to continue, which will then redirect you to a new tab, once you click it.
This action will:
- Place the survey data into the data visualization tool.
- Open a new tab in your browser; this will contain the data visualization folder created for a specific survey.
- This means you can return to Pollfish whenever you wish.
- It will authenticate you to the data visualization tool via your Pollfish account, seamlessly.
- You won’t be asked to log in with your credentials to Data Viz.
- The “Insights Builder” is an option available throughout the lifecycle of the survey (from the status of running to paused/ completed/ finished).
Viewing an exported survey:
- When a survey has been synced to the tool, you can view the “Insights Builder” option in the survey menu and on the results page.
- A loader screen will appear to redirect you to a new tab.
Get Started With Data Visualization Now
Ready to get started?
Log into your account and try it out!
Your support doesn't stop here. Prodege can provide additional support around leveraging data visualization with your Pollfish surveys and for all sorts of additional insights needs.
Major upgrade to Pollfish AI survey builder
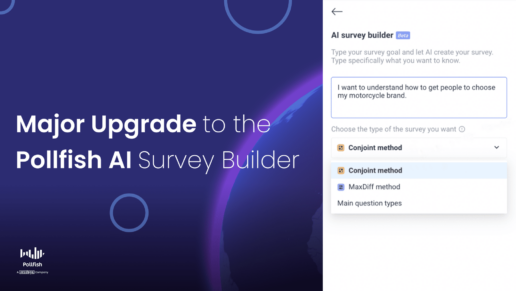
Major upgrade to Pollfish AI survey builder

Attention all researchers, marketers, and data enthusiasts! Pollfish's AI Survey Builder just got even better! We're proud to introduce our latest upgrade, which includes Maxdiff and Conjoint Analysis questions in addition to our existing arsenal of question types. The days of laboriously creating surveys are over – the Pollfish AI Survey Builder has got you covered!
The More, The Merrier: New Question Types Galore 🌟
Our upgraded AI Survey Builder now offers an impressive array of question types:
- Single Selection
- Multiple Selection
- Numeric Open-ended
- Text Open-ended
- Rating
- Ranking
- Sliders
- Maxdiff (Maximum Difference Scaling) 🆕
- Conjoint Analysis 🆕
With this major upgrade, your surveys can be more comprehensive and engaging than ever, allowing you to capture a wide range of insights from your target audience.
How It Works 🛠
As you'll see in this example below, all you need to do is select the type of survey you'd like to create.
On the left, you'll find a dropdown below where you'd normally enter your prompt, with options for:
- Main question types
- Conjoint method
- Maxdiff method
Simply pick the type of survey to auto create, and let the magic happen!

Pretty cool, right?
A Whopping 42,978 Survey Prompts Entered & Counting! 🚀
In just three months, we've had a jaw-dropping 42,978 survey prompts entered into the Pollfish AI Survey Builder! This outstanding number speaks volumes about the trust and value users place in our AI-powered tool. And now, we're taking it up a notch with the introduction of Maxdiff and Conjoint Analysis questions in our latest upgrade. Say goodbye to tedious survey creation – the Pollfish AI Survey Builder has your back!
In Conclusion: Join the AI Revolution Today!
It's time to embrace the future of survey creation! With the latest upgrade to our Pollfish AI Survey Builder, you'll be able to enjoy more the in-depth research capabilities you're already used to... But it will be:
- Way faster to create - thanks to Pollfish AI 2.0.
- Way faster to run - thanks to the massive global reach of the Pollfish audience.
- And soon, way faster to interpret your results - thanks to planned future feature releases.
So, what are you waiting for? Join the AI revolution and try out the upgraded Pollfish AI Survey Builder today!
How to Leverage Data from Conjoint Analysis Exports
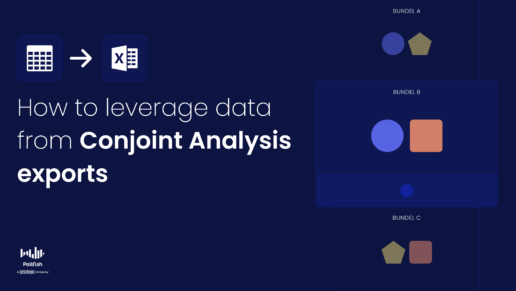
How to Leverage Data from Conjoint Analysis Exports

Let’s take another critical dive into conjoint analysis, a super informative market research feature that we released last year.
As you know, a Conjoint Analysis is a kind of tool and research technique that enables you to measure the value that consumers place on the individual features of a product or service.
This kind of analysis is particularly beneficial for product and pricing research, as it unveils a plethora of consumer preferences. You can then use this information to optimize your products and services.
In this article, we specifically focus on Conjoint Analysis exports on the Pollfish platform.
The Polfish market research platform generates optimized Excel, CSV and SPSS files that contain raw data, which you can use to form your own analyses and import the data from the tool to other software.
If you want to run your own Conjoint Analysis to compute and understand part-worth importance, you’ll need to use its export, as it contains raw data from your Conjoint Analysis.
This article teaches you how to do so.
1. How does Pollfish generate the Conjoint Analysis design?
The conceptual model of a conjoint analysis is pretty straightforward; it suggests that the utility of a multi-attributed product can be broken down into specific contributions of each attribute and their interactions.
The approach is easy to implement if the number of attributes is small. However, problems arise because of the large number of possible hypothetical alternatives for a given product.
For practical reasons, only a subset of possible alternatives is chosen for the study. To that end, experimental design methods exist for selecting good subsets of product configurations for performing the analysis.
Respondents will see a subset of possible options to choose from, which depends on the number of attributes and levels defined.
In order to do this, the Pollfish Conjoint algorithm first creates an orthogonal design of the alternatives (product bundles) that are formed by combining the levels of the attributes.
In the case that all possible combinations are more than 20, the total number of alternatives gets reduced using d and g optimality criteria.
Then choice sets are created, containing an upper limit of 5 alternatives each. The algorithms that we are using ensure the d-optimality of the choice-set design.
Finally, choice sets are assigned to blocks. One block cannot contain more than 30 choice sets.
The goal for our Pollfish Conjoint algorithm is to ensure that each level in each attribute appears the same number of times and that each alternative appears the same number of times in the design, so that the results have 0 bias and variance.
Each respondent gets assigned to only one block randomly. Blocks are distributed evenly to the audience, so that every choice set in the design is seen by the same number of respondents.
2. How is the Conjoint Analysis design distributed? Via the Pollfish algorithm based on Block Designs
A problem that usually arises when the choice-set design is ready to be administered to a target population is that the number of choice sets in the design may be too large for an individual to assess.
In these cases, a common technique is to partition the choice sets into blocks of equal size, in principle much smaller than the size of the original design, and then administer the blocks to the population.
That way, each individual would have to assess only the choice sets of one block, while collectively the population would assess all the choice sets of interest. However, in order for this partitioning to make sense, some constraints must be satisfied.
Each choice set should be evaluated by the same number of users. That means that each choice set should appear the same number of times into the blocks. Note that it is not necessary for a choice set to appear in all blocks. To that end, we may need to replicate the choice sets in order to always be able to divide them into blocks.
Formally speaking, the following equation should be satisfied: vr=bk
where v is the number of choice sets, and r is the replication factor of each choice set, is the number of blocks and is the size of each block, that is, how many choice sets each individual should see. Thus, given a choice-set design of size, we have to find the three smallest numbers () satisfying the above equality. Given these numbers, we can safely partition choice sets into blocks.
3. Understanding the Excel structure
The Excel (CSV and SPSS) file is a complementary feature of the visualized results at the Pollfish dashboard. It contains all responses given by each respondent of the survey. Graphs on the results page are based on these individuals' responses.
To take advantage of the Excel for a Conjoint Analysis or MaxDiff Analysis survey, visit the results page of a completed one, select “Export results” and choose “Excel” as your export option. You will be sent an email that notifies you when your export is complete. Open the document in Excel or Google Sheets to get started.
The Excel sheet will include the following two (among the other tabs):
- Experimental design tab: This tab contains the Conjoint or MaxDiff’s design, as generated by the Pollfish Conjoint algorithm.
- Individuals tab: This tab contains the selections given to the questions of the survey by each respondent.
For the case of the CSV and the SPSS, the experimental design comes in a separate file.

A. The Εxperimental Design Tab
Let’s assume that we have a Conjoint Analysis survey with the following attributes and levels, describing alternatives of detergents:

In the Excel tab, each component is listed in a column and has a unique ID. Blocks, their containing choice sets and alternatives(or “Concepts”) have their own IDs, as the following screen depicts.

For the specific example, the Pollfish algorithm will generate a design of 4 blocks of 5 choice sets each.


Each choice set contains 5 alternatives (or “Concepts”). Each row represents a generated alternative (or “Concept”), whose containing attribute levels’ columns are located after the “Concept” column (in our example of detergents Conjoint test, the attributes were 4: Type, Perfume, Quantity and Price).

The settings for the number of choice sets and the number of alternatives, are also displayed in the questionnaire while preparing the Conjoint survey:

B. Conjoint selections at the Individuals tab
Each respondent gets only one of the generated blocks. The blocks are evenly distributed across the sample, hence, a block may be received from many respondents.
In our example, from the 120 total sample, each group of 30 respondents will get one of the 4 blocks:
- 30 respondents receive the block with ID 257
- 30 respondents receive the block with ID 258
- 30 respondents receive the block with ID 259
- And 30 respondents receive the block with ID 260
At the Individuals tab, each row represents the responses given to the questions by a single respondent. Data related to the Conjoint Analysis are placed among the other questions contained in the survey and start with the column named “Block” which holds the block ID the respondent received.
Then the choice-set ID columns follow along with the selected alternative (or Concept) ID columns. The choice-set columns are ordered according to the order the respondent received them.
So, ChoiceSet0 ID holds the first choice-set ID the respondent got. Selected Concept 0 ID holds the respondent’s selected alternative ID(or Concept) in the first choice set and so forth until selections for all choice sets are provided in the tab.

C. Correlate the data at both tabs for further analysis
You do so by combining the following:
- the data from the Experimental design tab, which holds the content for each block and their included choice-sets
- the data from the Individuals tab, which hold the selections per respondent
You can then proceed by then analyzing the data in a different system.

How Pollfish Provides Quality Data and Prevents Survey Fraud (2023 Update)
How Pollfish Provides Quality Data and Prevents Survey Fraud (2023 Update)

Pollfish implements a variety of procedures to ensure the highest quality of data. Using a combination of proprietary techniques and machine learning technology, our platform, along with our team of technical experts prevent survey fraud at every turn.
When combined with our rigorous quality checks, our participant pool of over 800M+ enables us to discard responses that don’t meet our quality standards — without sacrificing the sample size. As such, no question is subject to survey fraud, as the Pollfish platform stamps out inaccurate or poor quality responses.
As a result, we deliver higher quality data than our less-selective, panel-based counterparts.
What is Survey Fraud?
Survey fraud, or market research fraud is the adverse phenomenon that occurs when survey respondents submit fraudulent or bogus responses. This can occur accidentally, such as when responders undergo survey fatigue, or purposefully.
What would prompt a responder to partake in the latter? They can be your competitors (especially if the survey mentions your brand or makes it apparent that it is conducted by your brand), bots, click farms, or respondents eager to finish the survey to receive an incentive.
Thus, there are a number of ways respondents can contribute to survey fraud, such:
- Providing nonsensical, i.e., gibberish answers
- Breaking rules
- Answering suspiciously quickly
- Hiding their IP address via the use of a VPN
- Leaving one-word responses in open-ended questions that ask for an in-depth answer
- Flatlining
In regards to the latter, remember the old advice to “just choose B” all the way through if you didn’t study for a test? That would result in an “F” from us. Participants that choose the same answer repeatedly, try to take the same survey again, or attempt to submit multiple surveys in quick succession don’t pass our test.
Natural Language Processing for Open-Ended Answers (New Feature 2023)
Respondent Verification
We further verify by checking ahead for duplicated IDs via IP or MAC addresses, Google Advertising and mobile device identifiers, and we work with our manually vetted publishers to send unique IDs as an added layer of protection. In-survey questions are designed to add another layer of security against survey fraud, such as requesting an answer to a simple math equation or including identical questions within a survey with the response options re-ordered to verify answer consistency.
Zero Tolerance For Bots
In addition, we have zero tolerance for bot-friendly VPNs, incomplete surveys, or other suspicious activities. We reject responses from any behavior we deem questionable—anything from answering open-ended questions with nonsense to attempting to sign in from multiple countries at once. We’re even alerted if respondents are spending an inappropriate amount of time across questions within the survey.
Rigid Adherence to Targeting
Our data quality is second to none. As such, we’re skeptical of just about everyone, and that’s what makes us the best at what we do. Accuracy is our top priority, which is why we are so critical of our sources and their behavior. In fact, we only include respondents that match 100% of the targeting criteria, even if there was nothing fraudulent about their responses. This includes surveys with multiple audiences, as well as those with stringent respondent qualifications, such as specific answers to screening questions. Our combination of technology and expertise ensures the delivery of the highest quality data to our customers—every survey, every time.
Multiple Layers of Quality Checks
Pollfish supports multiple other layers of quality checks. This is an ongoing process since both the platform and our technical experts continuously work to avoid survey fraud while fetching the preset amount of required survey completions with the correct targeting. There are several layers that we use to improve the data quality. These include:
The Technical layer:
- Includes various checks to ensure first-rate data. Hasty answers check: catches respondents who answer faster than the average time required to read the actual questions.
- Reset ID Check: Occurs when the responder answered the same survey previously, but with a different device to avoid the same respondent from partaking more than once.
- Gibberish Check: When the given answers contain text that is considered gibberish, ex: “dsfjkn dfnksj ifjodf”.
- Same IP Participation: Checks if a survey has been completed before within a certain time from the same IP address of the respondent’s device.
- Carrier Consistency: Assures that the carrier of the respondent is contained in the targeting market.
- VPN: VPN users are automatically disqualified from survey participation.
Quality Questions & Responses
Our platform is designed so that your questionnaire is bound to receive quality responses. In order for it to do so, aside from post-answer quality checks, we provide quality answer triggers. Our quality questions include: trap, red herring and attention questions.
- Trap questions: Checks that respondents are paying attention to a command, usually one that asks to select a negative response. Responders with acquiescence bias, or those who choose positive responses will be caught.
- Ex: Please select "Somewhat Disagree" below
- Strongly Agree
- Somewhat Agree
- Somewhat Disagree
- Strongly Disagree
- Ex: Please select "Somewhat Disagree" below
- Red Herring Questions: These check if the respondent is engaged with the survey, tracking how logically they answer oddball questions.
- Which of the following is not a sport?
- Soccer
- Basketball
- Cookies
- Baseball
- Which of the following is not a sport?
- Quality Questions: Checks if respondents are reading and comprehending the question, much like red herring questions.
- Ex: Which of the following does not have wheels?
- Bike
- Car
- Skateboard
- Elephant
- Cart
- Ex: Which of the following does not have wheels?
These are injected within various components in the survey flow depending on each survey’s type to check if the respondents pay attention. Those quality questions are also used in Demographic surveys. If the respondent fails to answer a quality question, a reverse counter is displayed.
Finally, we also check for response quality by banning respondents who provide insufficient quality data from the network. Additionally, our system uses an audit to validate open-ended data to ensure that respondents do not provide inadequate responses. We also have installed a function that wards off copy-pasted answers in open-ended questions and others.
The Guide to Using Crosstabs in Pollfish (Late 2022 UPDATE)
The Guide to Using Crosstabs in Pollfish (Late 2022 UPDATE)
Crosstabs are a matrix-style format for data visualization and are one of the most useful and common ways that market researchers analyze data. Pollfish offers cross tabs as an excel export for easy synthesis outside of the platform.

Analyze Pollfish data using crosstabs
Crosstabs are an easy way for researchers to synthesize data and analyze the relationships between two (or more) variables. The variables represent categorical data from the survey, and are displayed in rows and columns in a matrix for researchers to quickly find data in corresponding cells.
Many traditional tools and services offer crosstab reports, although the process is extremely manual. Researchers may only have access to the raw data from their studies initially and need to request that a crosstab report be generated for them. Because these reports are often an additional service, this can add significant expense to a research project.
Pollfish has always been at the forefront of market research technology, so we tackle crosstabs a bit differently. Our process is automated to generate crosstab reports from the survey data that we collect, which is a better fit for convenience, cost, and accuracy for teams of all sizes.
As of May 2021, Pollfish has launched a new edition of crosstabs known as Volume 2 and there will be another iteration coming soon.
Get started with crosstabs in Pollfish
To take advantage of the crosstabs feature in Pollfish, visit the results page of a completed survey, select “Export results” and choose “Crosstab” as your export option. You will be sent an email that notifies you when your export is complete. Open the document in Excel or Google Sheets to get started.
The crosstab sheet will include four “tabs” across the bottom.
- Count: This sheet shows the number of responses that fit a row and column.
- Percentage: This sheet shows the percentage of all responses from the survey that fit a row and column.
- Row Percentage: This sheet shows the percentage of the row that falls into a specific column.
- Column Percentage: This sheet shows the percentage of the column that falls into a specific row.
Example results using Pollfish crosstabs
Say you’re interested in Android users, specifically those who might switch to using an iPhone. You could run a survey, similar to the one below to ask men and women of all ages their opinions about the two devices.
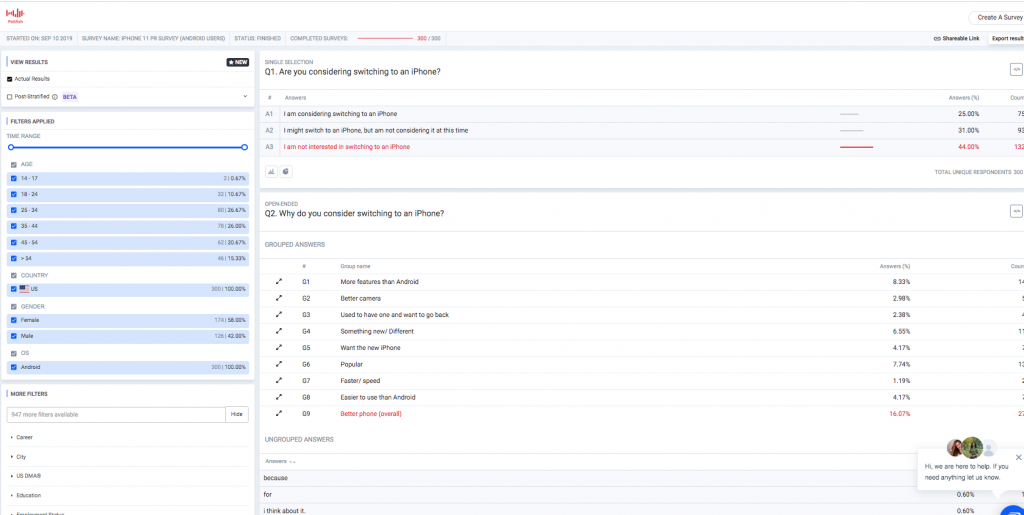
However, you could achieve a deeper level of insight by exporting these results to crosstabs, and seeing what data correlations come from it. For example, how many women are considering switching to the iPhone?
Using the “Count” tab, you can see that 39 women from the survey said that they were considering switching to an iPhone. Using the “Percentage” tab, you can see that the 39 women represent 13% of the sample population that was surveyed.
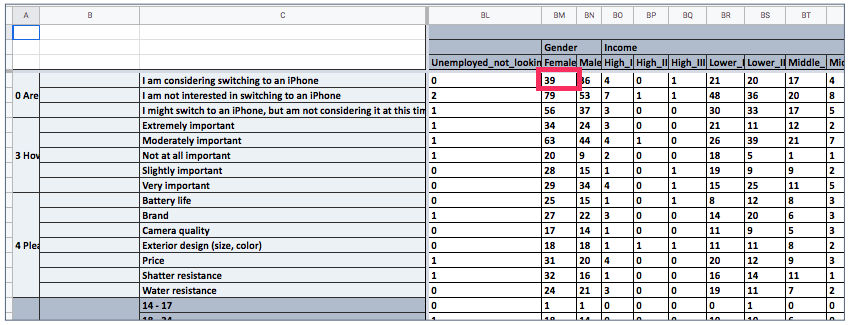
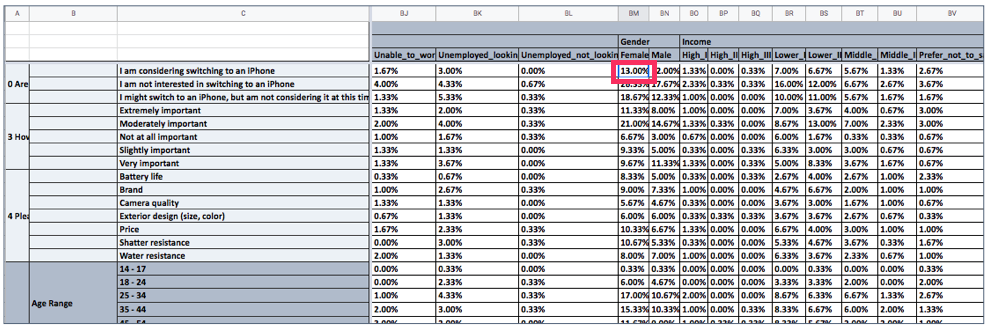
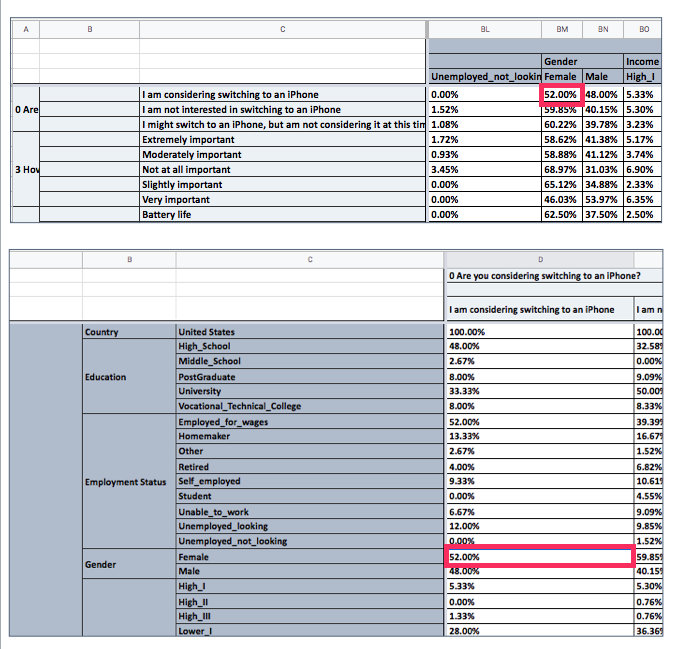
The “Row-Percentage” and “Column-Percentage” tabs are inverse tables of data that show the percentage of the rows that belong to a single column, and vice-versa. You can toggle between these tabs to choose the view you prefer.
In our example, we can see that 52% of the respondents who were considering switching to an iPhone were women, where the rows and columns are displayed differently depending on the tab selected.
To gain familiarity with crosstabs, you can view the iPhone survey here and check out the crosstab export to see how the data looks. Or, you can export your own finished Pollfish survey to explore your results with a new tool.
Understanding the Updated Crosstab Features
In the Pollfish Crosstabs export file, all questions can appear in both the columns and the rows. In the Crosstab Designer, specifically, researchers can drag and drop to add whatever they see fit for their analysis. The answers can be based on different demographics, along with the percentage of those demographics that have answered in a particular way.
In our advanced version, the cells include more than just percentages of responses. Rather, the data is featured in boxes, with each box containing various information. This includes the count and percentage. In addition, the new Crosstabs version includes more columns per question, with each column representing a different answer.
The data on each answer is then displayed in each box. This version gives researchers a far more organized and granular view of their survey results.
What’s best is that researchers can generate these on their own. Moreover, they can easily drag and drop the questions into the report themselves, so that the report features only the relevant data.
The Two Types of Crosstab Solutions
The Pollfish online survey platform offers two types of crosstab solutions. Each offers a different way to layout your resulting data. The second type has been updated and has several new features to power your survey analysis needs.
- The first solution includes the results from the results page. It can appear as:
- All data or Current view
- It bridges the gap between the excel individuals file and the results page.
- The second solution is called Crosstab Designer.
- This is available for clients with an Elite plan.
- This type of crosstab has new upgrades.
- The Crosstab Designer 2.0 allows researchers to preview their crosstabs and instantly download their crosstabs.
- This allows researchers to design, preview, and download their custom tabular results view.
- It also allows researchers to choose what to crosstab without any limitations. Therefore, it is entirely custom.
- Afterward, they can preview it and download it instantly in seconds on any device
- The new Crosstab Designer supports:
- Crosstab Previews
- Instant downloads
- This will soon support A/B tests.
These first two Crosstab solutions offer translations and both of them also can generate .XLS files.
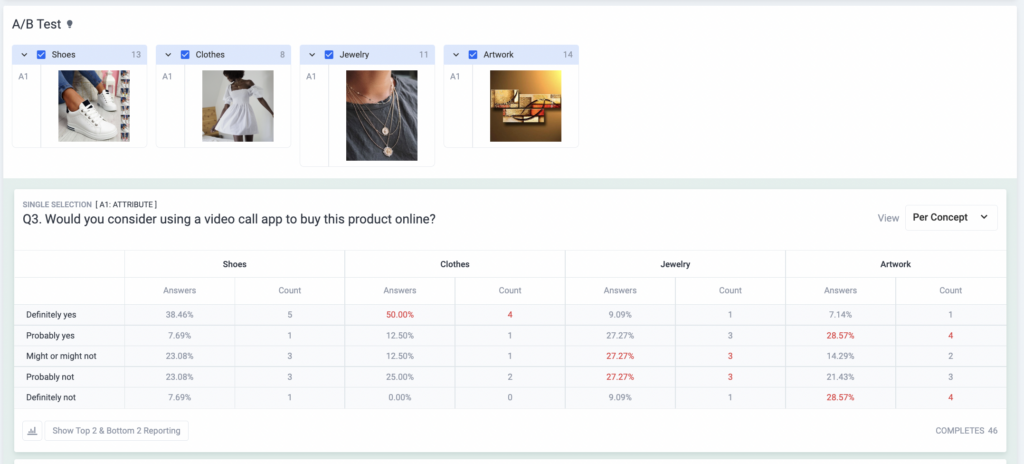
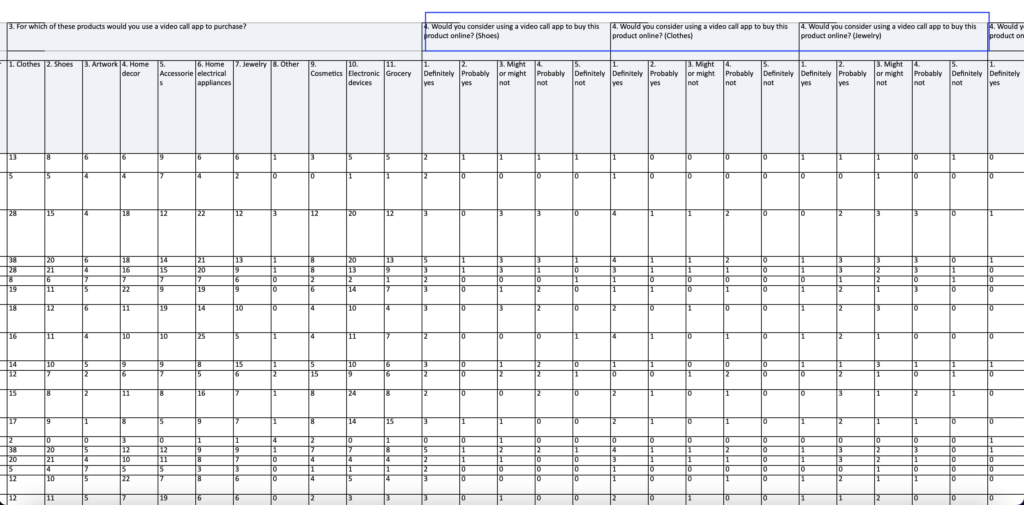
Crosstab Support for A/B Tests (Monadic and Sequential)
Crosstabs have been updated to include questions and answers per concept.
Specifically, if your survey included an A/B test with three concepts and one single selection question, you will get a crosstab with the question repeated three times. This makes it the same amount as the concepts, with both the columns and the rows.
This change is applicable to both types of A/B tests. These are the:
You can filter the responses by concepts, demographics, along with answers and use the current view export, which will generate a Crosstab based on the filtered responses.
Our team is excited to help you learn more about this newly updated feature, so don't hesitate to reach out to our 24/7 Customer Experience team if you need assistance.
Creating a Branded Survey with a Customizable Logo and Theme
Creating a Branded Survey with a Customizable Logo and Theme
![]()
![]()
A branded survey is a unique way to present your business to your respondents by featuring the likeness of your brand.
It enables you to create a custom survey experience, which is not merely critical for branding market research, but for all your branding efforts.
In the ultra-competitive landscape of brands today, many of which are jockeying for your attention on the internet, brand awareness is essential. In fact, 45% of marketers rank increasing brand awareness as a top priority for their business.
As such, branding your surveys is a less conventional, albeit innovative way to increase and maintain brand awareness among your target market.
This article delves into the branded survey, its importance, examples and how to create one with a customizable logo you can place in your questionnaire and elsewhere.
Understanding the Branded Survey
A branded survey is a survey that outwardly features your brand, whether in name, logo, related image or another type of likeness.
Such a survey directly points out that the survey is not used for an anonymous source or company. Rather, it is the product of a specific brand that asks internet users to partake in it.
You can create a branded survey on Pollfish by adding your logo to your survey’s questionnaire and customizing its header, text and more.
This kind of survey is one of the many market research techniques, as it can be used to collect key consumer insights for virtually any campaign, whether it’s for advertising, customer segmentation, brand reputation or any other market research purpose.
However, unlike its non-branded counterparts, this kind of survey is unique in that it features your brand front and center. Thus, the respondents will never have to wonder which company or entity they are taking the survey for.
You can brand your survey in the following ways:
- Adding your brand to the title of the survey
- Placing your brand name in the introduction of the survey
- Putting your brand name in one of the survey questions
- Inserting your brand in the thank you or closing page of the survey
- Adding your logo to the survey (as opposed to the Pollfish logo or having no logo at all)
Why Branded Surveys are Important
When you brand your surveys, first and foremost, you are giving your brand a competitive edge.
That’s because they can provide yet another placement for branded content on the web.
Branded content is incredibly important, as it is more effective than pre-roll ads, which are the promotional videos customers see before their chosen content. 86% of viewers could recall a brand after viewing branded content than regular pre-roll ads.
Luckily, these surveys aren’t ads, they’re surveys that exist on a massive network on website and app publishers.
Thus, a branded survey is another means to keep your brand top of mind for your customers.
This means, in a branded survey, your survey won’t merely be used for typical market research purposes. It will also provide you with brand awareness as it’ll make your customers recall your brand, while those who haven’t heard of you will be prompted to learn.
![]()
![]()
Branded surveys also enable you to engage in white-label market research. As such, when people come across your survey online, it’ll be recognized as yours only. That’s because there are no indicators of a third party, i.e., a market research survey platform.
Thus, your survey will appear as proprietary to your brand, thus giving you the full white-label experience.
For those who support your brand, seeing your logo in your survey will capture their attention better than a survey without a logo or likeness to your brand. As a matter of fact, a branded survey encourages your online customers to check out the survey and most importantly, complete it.
Thus, a branded survey hooks your target customers’ attention better and leads to a higher survey completion rate, allowing you to get timely results and complete your market research campaign.
If you are hesitant about revealing your brand in your survey, you may want to consider another crucial reason to do so. This involves collecting feedback after a sale to learn about the entire customer buying journey, along with the customer experience whilst making a purchase.
This involves getting insights into your customers’ e-commerce experience, and post-sales support, along with getting feedback from your own employees. As such, this feature is great to pair with the customer experience survey.
All in all, branding your surveys provides an excellent opportunity for the following:
- Creating branded content
- Fostering brand awareness
- Producing brand recall
- Capturing attention
- Forging interest in your survey
- Promoting your values and mission
- Standing apart from your competitors who don’t use branded surveys
- Understanding your CX during their purchase and post-sales
Get started on yours!
Create a Branded Survey on Pollfish
Creating a white-label branded survey on Pollfish is easy. This is made possible by the examples in the numbered list in the Understanding section. However, what’s special about branding in a Pollfish survey is that you can add a logo to your questionnaire.
Let’s learn how to do this. Like many other features on the Pollfish online survey platform, it’s easy to add a customizable brand logo. In Pollfish, this would live in the Questionnaire portion of the survey.
- Create a new project and choose the deployment method. There are two options: random device engagement (RDE) or sending your survey through your own chosen platforms and specific people.
- Go to the Questionnaire section.
- On the left-hand panel, go to the bottom and select Themes.
- Select the New Theme button.
- You can also select Default survey style and click on Duplicate. (This will create a Default survey style copy field to appear above the Default survey style field).
- Next, customize your theme.
- Themes are available to apply to your surveys. There is no need to recreate them from scratch.
- All themes are available to all team members.
- You’ll have various options that pop up. These include options to customize the following:
- Title of theme
- Header Options:
- Questionnaire logo (add your brand logo)
- Progress bar colors
- Questions’ colors
- Prompt box color
- Header background color
- Answer Options:
- Answers and labels text color
- Answers control color
- Answers background color
- Submit button color
- Background color
- Once done, hit Save.
- This will save the particular branded survey.
- Return to the Themes left-hand panel.
- Here you can edit, duplicate or delete the surveys by clicking on the triple dots next to each one.
- Add questions to the Questionnaire and voila! — you’ve got yourself a branded survey.
Examples of a Branded Survey on Pollfish
Now that you know how to create this kind of survey on the Pollfish market research platform, let’s take a gander at what it actually looks like.
The following provides examples of branded surveys on our platform:
![]()
![]()
Use an advanced editing solution:
Branding Yourself in Market Research Campaigns
Creating a branded survey is a unique and effective way to not only conduct market research, but to engage in a branding technique.
As such, this kind of survey goes beyond the primary purpose of a market research survey. It serves as a tool for creating brand awareness and other key needs for your branding efforts.
You can therefore use it to not simply ask questions, but embed the key things you’re proud of about your brand in the questions.
To do so efficiently, you’ll need a strong online survey platform to host it. This means it is even more important to decide on the proper survey platform before you begin on branded survey creation.
A potent survey provider will allow you to fulfill all of your online market research activities at speed and with ease.
Pollfish survey software allows you to create a comprehensive survey data collection, one you can customize to your liking, view however you see fit and organize to the max.
We offer an advanced method to deploy your survey to millions of random users online via the organic sampling method RDE method.
Additionally, researchers can reap a wide breadth of information on their respondents and access a wide pool of insights in their survey results dashboard.
With such a powerful online survey platform, your branded surveys will always be easy to create and deploy. Thus, you’re in good hands.

How to Create a Survey with Sensitive Questions and Avoid Being Flagged on Pollfish
How to Create a Survey with Sensitive Questions and Avoid Being Flagged on Pollfish

Setting up a survey that deals with sensitive topics is never an easy feat for any party involved. To avoid trouble in your market research endeavors, we’ve updated our Review Policy for sensitive questions/topics. (See the Pollfish Review Policy section in this article)
Although the Pollfish platform offers a vast pool of question types and makes it easy to incorporate any question type, getting respondents to complete surveys with sensitive questions is not guaranteed.
Our review team may flag your survey and even block it from being launched if we deem it inappropriate.
In fact, if you ask sensitive questions in a reckless manner, it is bound to turn respondents away from completing the survey, or beginning one in the first place. Thus, these kinds of questions mar the survey experience for respondents and can lead to survey attrition.
But that does not mean you ought to omit surveys and their larger campaigns due to the inconvenience of the questions being sensitive in nature.
You can still create effective surveys by asking the sensitive yet necessary questions as long as you do so with certain best practices to make it a better experience for your respondents. This article explains how.
What are Sensitive Questions?
The notion of a sensitive question is not as subjective as it may appear. These questions make respondents feel embarrassed or uneasy due to the nature of the question, its tone, context or setup.
Here are some of the question types that can cause respondents to feel uncomfortable:
- Questions that invade privacy:
- Religion, political stance, sexual behaviors
- Questions that ask about illegal behaviors:
- Drug use, theft, perjury, other illegal acts
- Questions that pose a risk or paint the respondent in an unfavorable light:
- Cheating on partners, tests, taxes, thoughts on their colleagues or job
- Questions on identification (especially if detailed):
- Income, age, race, job title
- Questions with socially desirable responses:
- Voting history, exercising, wearing a seatbelt)
- Questions that deal with unpopular ideas:
- Racism, ageism, etc.
While you cannot change the nature of a question, you can still set it up so that it is poised to be better received — and answered.
Other Factors Causing a Distressful Survey Experience
Aside from the questions themselves, there are other factors in your survey relating to the questions that can render an uncomfortable survey experience. As such, you should be aware of these to understand the respondents’ perspective.
Additionally, understanding them will help you avoid running into these pitfalls and optimizing your surveys for effective survey campaigns. The following discusses the major causes of distress and survey attrition in regards to sensitive questions.
- The privacy (or lack thereof): Privacy is of the utmost importance when it comes to filling out any survey. When it comes to surveys that deal with sensitive topics, it is especially important, as no responder will want to associate their identity with their answers.
- Although your survey is private, perception is key, as respondents may perceive that their participation may still be traced back to them
- The mode of the survey: This involves the means of administering the survey; some may send it via email, while others rely on a survey platform.
- This is an issue of presentation, which may influence respondents’ perception of privacy.
- Ex: Emails sent to respondents remove the air of confidentiality, since it was sent to a particular address, which often is the respondents’ names.
- This is an issue of presentation, which may influence respondents’ perception of privacy.
- Brand Reputation: When dealing with sensitive topics, respondents are particularly aware of the organization to which they will provide answers on sensitive topics.
- Some surveys do not mention the brand or organization which they represent, while others may.
- In relation to sensitive questions, respondents may feel unnerved to share answers with certain companies.
How Sensitive Questions Harm Your Survey When Used Incorrectly
As mentioned in the introduction, using sensitive survey questions without heeding critical best practices have grave consequences for your survey campaign. They tarnish the accuracy of the responses, an issue no survey platform can fully evade.
They also lead to respondents unwilling to take your survey, that is, they won’t even open it to give it a chance. This makes fulfilling your survey quotas and number of completes a more difficult and lengthy process.
Survey attrition is another issue spawned when sensitive questions are used improperly. Market researchers can avoid poor quality data and survey attrition by setting up surveys with sensitive questions in a thoughtful manner, one that fully takes best practices into consideration.
How to Ask Sensitive Questions the Correct Way
Market researchers can still extract responses on sensitive subjects by doing so with best practices.
As such, you need to devise your survey strategically so that you don’t repel much-needed respondents. In order to keep responders in the survey, having them answer honestly and answering all the questions, apply the following methods.
These methods will avoid summoning feelings of distrust and general unease. They will also help you build your survey in a way that is conducive to a good user experience.
- Be upfront about privacy: Relay a confidentiality guarantee.
- Either in the survey callout, invitation or introduction, assure your respondents that their participation is completely confidential.
- Let them know the precautionary methods you’re taking to ensure their answers remain hidden from general view and are not associated with their names.
- Be transparent with the purpose of the survey. Tell the respondents upfront what the topic of study is along with its purpose.
- Doing so will avoid surprises and when respondents know what they’ll be dealing with upfront, they’ll be less disinclined to complete their surveys.
- Be honest with anonymity. Don’t relay that a survey is anonymous unless it actually is.
- On the Pollfish platform, all responses are anonymous based on our terms, so you can state that the survey is anonymous.
- Additionally, the survey must contain one initial screening question that states the study’s content and asks for respondents' age and consent. For example:
- “The following survey contains questions regarding [sensitive content input]. Are you willing to take part in the following survey? 1. Yes, I am 18 years old and above and I give my consent 2. No’'
- Build up to sensitive questions, don’t ask them right away.
- Don’t ever present sensitive questions first; instead, lead up to them by asking more neural questions that become more specific with each incoming question.
- This way, you can avoid shocking your respondents and turning them away from answering or providing honest questions.
- Use ranges instead of specific values.
- Respondents may not feel comfortable with revealing the exact amount, especially if it deals with a negative behavior or societal disapproval.
- For example: instead of providing precise numbers as answers to, “how many times have you fought with your spouse?” or “how many times have you smoked cigarettes last week?” use ranges, such as “under 3 times last week,” “3-5 times,” etc.
- Use “question loading” to elicit honest answers.
- Not to be confused with loaded questions, question loading involves blanketing a question with context, so as to make the subject in question appear more normal and acceptable.
- This will make respondents feel less guilty of partaking in a certain behavior, act or inertia.
- Ex: Instead of asking “did you exercise last week?” question load the question to normalize the less acceptable answer (of not exercising).
- Question-Loaded: “Given that the average American worker works 9 hours a day and has several responsibilities, exercising is not always a priority. With that in mind, how many hours of exercise did you do last week?”
- Use frequency questions instead of yes or no questions, if the topic deals with partaking in a bad behavior.
- Instead of asking “have you ever run a red light when driving?” ask “how many times have you run a red light when driving?”
- The latter assumes the respondent has already done so, so their response cannot be a lie.
- If you used a yes or no question, on the other hand, the respondent would be less inclined to answer honestly, given that negative behaviors are not socially acceptable.
- Instead of asking “have you ever run a red light when driving?” ask “how many times have you run a red light when driving?”
- Provide an “I prefer not to answer” option.
- Try as one might to frame a question tactfully, sometimes respondents simply do not want to answer a sensitive question.
- Instead of losing a respondent due to one such a question, provide a multiple-choice option of opting out.
- This is best suited for surveys that include questions other than sensitive ones. If your survey applies questions on sensitive topics only, you should not include this option — unless it’s on one or two particularly sensitive questions.
- Be upfront about privacy: Relay a confidentiality guarantee.
The Pollfish Review Policy for Sensitive Questions
Starting in December 2022, Pollfish is introducing a more stringent review policy for all surveys dealing with sensitive topics.
We don’t take sensitive topics lightly, especially surveys that cross the line and become inappropriate. This includes surveys that feature the following content:
- Rude language (swearing, insults, crude topics)
- Leading questions (those that contain answers that lead to certain opinions that respondents don’t necessarily hold but have no choice but to select)
- Offensive content or language
- Disturbing content (language, imagery or audio files)
- Insinuations
- Hate speech
This means, if your survey is deemed inappropriate, it will not only be flagged, but will have the possibility of being shut down completely.
Essentially, you won’t be able to run said inappropriate survey.
That’s why we ask you to please be aware of the content of your survey. Pay attention to all of the elements of your survey, such as:
- The overall theme and topic
- The subtopics
- The demographics
- The period of time (proximity to a scandal or controversial event)
- The language and tone
- The narrative the questions (and their answers) form
- The images and other multimedia files you include
- How you address certain sensitive issues (disability, illness, sexuality, race, religion, gender, gender identity, etc., political leanings)
- The positioning of the questions (some will need advanced skip logic so that only the most relevant respondents will be routed to a particular question).
- The quotas you set on the demographics and psychographics of your survey audience
Now, let’s get into more basics of our policy. The original policy is composed of three criteria and they are as follows:
- Respondents must be at least 18 years old to take the survey. You can review your age targeting in the Audience tab.
- The survey must contain one initial Screening Question that states the study’s content, for example: “The following survey contains questions regarding [sensitive content input]. Are you willing to take part in the following survey?”
- Your responses are anonymous.
- There must be one question that explains the survey content briefly, along with the purpose of using such information and how you’ll use it.
The Pollfish team needs time to review your survey before pushing it live. If your survey is deemed inappropriate, it’ll be flagged as such in our survey process of approvals. We’ll ask you to edit it by either rephrasing your questions or removing them altogether.
Remember to be respectful in your surveys as you would be in real life. There is no need to shock or offend, or ask leading questions to push a narrative. Doing so will only tarnish the validity of your survey.
Extracting the Best Respondent Data
Obtaining quality data relies on several things, such as the questions themselves, the setup of the survey, how it’s introduced and the digital platforms it is deployed in. Additionally, it relies on the aid of a quality check function.
Thus, it’s important to invest in an online survey platform that facilitates the entire survey process — from creation, to deployment, to survey quality checks and post-completion quality checks. The Pollfish platform performs such checks with an AI-powered system. It voids incomplete surveys, those with gibberish answers, users of VPNs and more.
Ensuring the use of a competent online survey tool will maximize the success of your survey, allowing you to avoid the survey bias present in surveys with sensitive questions.

Pricing Your Products the Right Way with the Van Westendorp Price Sensitivity Meter
Pricing Your Products the Right Way with the Van Westendorp Price Sensitivity Meter (Updated)
 The Van Westendorp Price Sensitivity Meter is an essential market research tool for determining the price of a new product or tweaking that of an existing product.
It allows businesses of varying sizes and industries to set the proper price of their offerings, one that is in line with customer expectations. After all, pricing is a key aspect of a product’s success.
When it comes to the success of a product or service, everything comes second to price. While this may appear to be an exaggeration, it rings true, especially during the pandemic. Consumers are now more price-conscious than ever before.
In fact, 45% of consumers switched brands to save money in the past year. Consumers are well aware of any signs of inflation, as 77% of consumers have noticed higher prices and over half of consumers are shopping at multiple businesses to find the best price — 53% of customers research multiple stores in search of the best price, specifically.
Fortunately, although it is only February, we’ve got another feature making the rounds on the Pollfish online survey platform. The Van Westendorp Price Sensitivity Meter enables researchers to research customers’ willingness to pay for products and services.
This article explains what the Van Westendorp Price Sensitivity Meter is, its importance, what it is like on Polllfish and more.
Understanding the Van Westendorp Price Sensitivity Meter
Also called the Van Westendorp Price Sensitivity Analysis (PSA) in addition to the Price Sensitivity Meter (PSM), this is a pricing model that provides data for decision-making in regard to consumer price preferences. As such, it is used to determine customers’ willingness to pay a range of prices.
In doing so, it helps conclude the prices that your target market deems acceptable, too high, too low and optimal.
The PSA entered the market research sphere in 1976 by the Dutch economist Peter Van Westendorp. This approach is still in use throughout the market research industry, particularly for product development and to aid pricing strategies.
The meter itself is a visualization in the form of a graph, which presents ratings on price and value from customers. This data is presented by way of responses to survey questions that focus on the prices of different products and services.
This way, researchers and business owners can understand whether their pricing is too high or too low.
The Importance of the Van Westendorp Price Sensitivity Meter
The Price Sensitivity Meter is important on a number of accounts.
First off, it clearly lays out a wide range of price points in relation to how customers feel about them. As the introduction proves with several statistics and editorial sources, pricing is one of the most of not the most important factors when it comes to product success.
Consumers are more conscious than ever due to inflation and other economic downturns brought about by the Covid-19 pandemic. What makes sense to business owners or product marketers does not always align with the expectations and customer buying behavior of customers.
Therefore, businesses should always stay in the know of their customers and this applies to their thoughts, hopes and aversions to different price ranges and points. The PSM is an easy way to access this necessary consumer sentiment.
When it comes to going to market, it is crucial to have a deep understanding of how customers value a product and they view its accompanying price. If you don’t, you will certainly disappoint many current and prospective customers, as there will be less of a demand for your product.
In this way, satisfying your customers with good pricing helps you both maintain and increase your customer retention rate along with helping you avoid raising your customer acquisition cost.
While conducting secondary research is a good starting point, it does not provide you with concrete information on your own customers and products, no matter how similar other products in your niche are to yours. Thus, the PSM is a useful tool, as it provides you firsthand information on your own customers and their thoughts about specific prices and products.
The PSA technique is also important, as it is often used during the new product phase, such as in the customer development process to assist you in setting the right price. In this case, the van Westendorp PSM uncovers a potent entry price strategy.
When it comes to established brands and existing products, the PSM will guide your pricing strategy for repositioning a product, or advertising it with new features. In any case, the PSM is a useful tool in gauging price sentiment from your customers and setting the right prices for all your offerings.
How the Van Westendorp Price Sensitivity Meter Works
The PSA begins with researchers’ using an input, which is respondent data based on questions revolving around products and their accompanying price.
The researcher will first present respondents with a product or service, which can be just about anything. They will attempt to get the respondents to become familiar with the product or service and then ask them four questions on it. These serve as the basis of the Price Sensitivity Meter, which the research will then input into the PSM chart.
This method involves using a description of the product or service at hand, which can exist as a video, image or audio file, or text. After respondents view this information, they are then asked the four Van Westendorp questions.
Following this, the results of the questions are entered on the Van Westendorp chart. Let’s learn how they appear on the Pollfish platform.
The Van Westendorp Price Sensitivity Meter in Pollfish
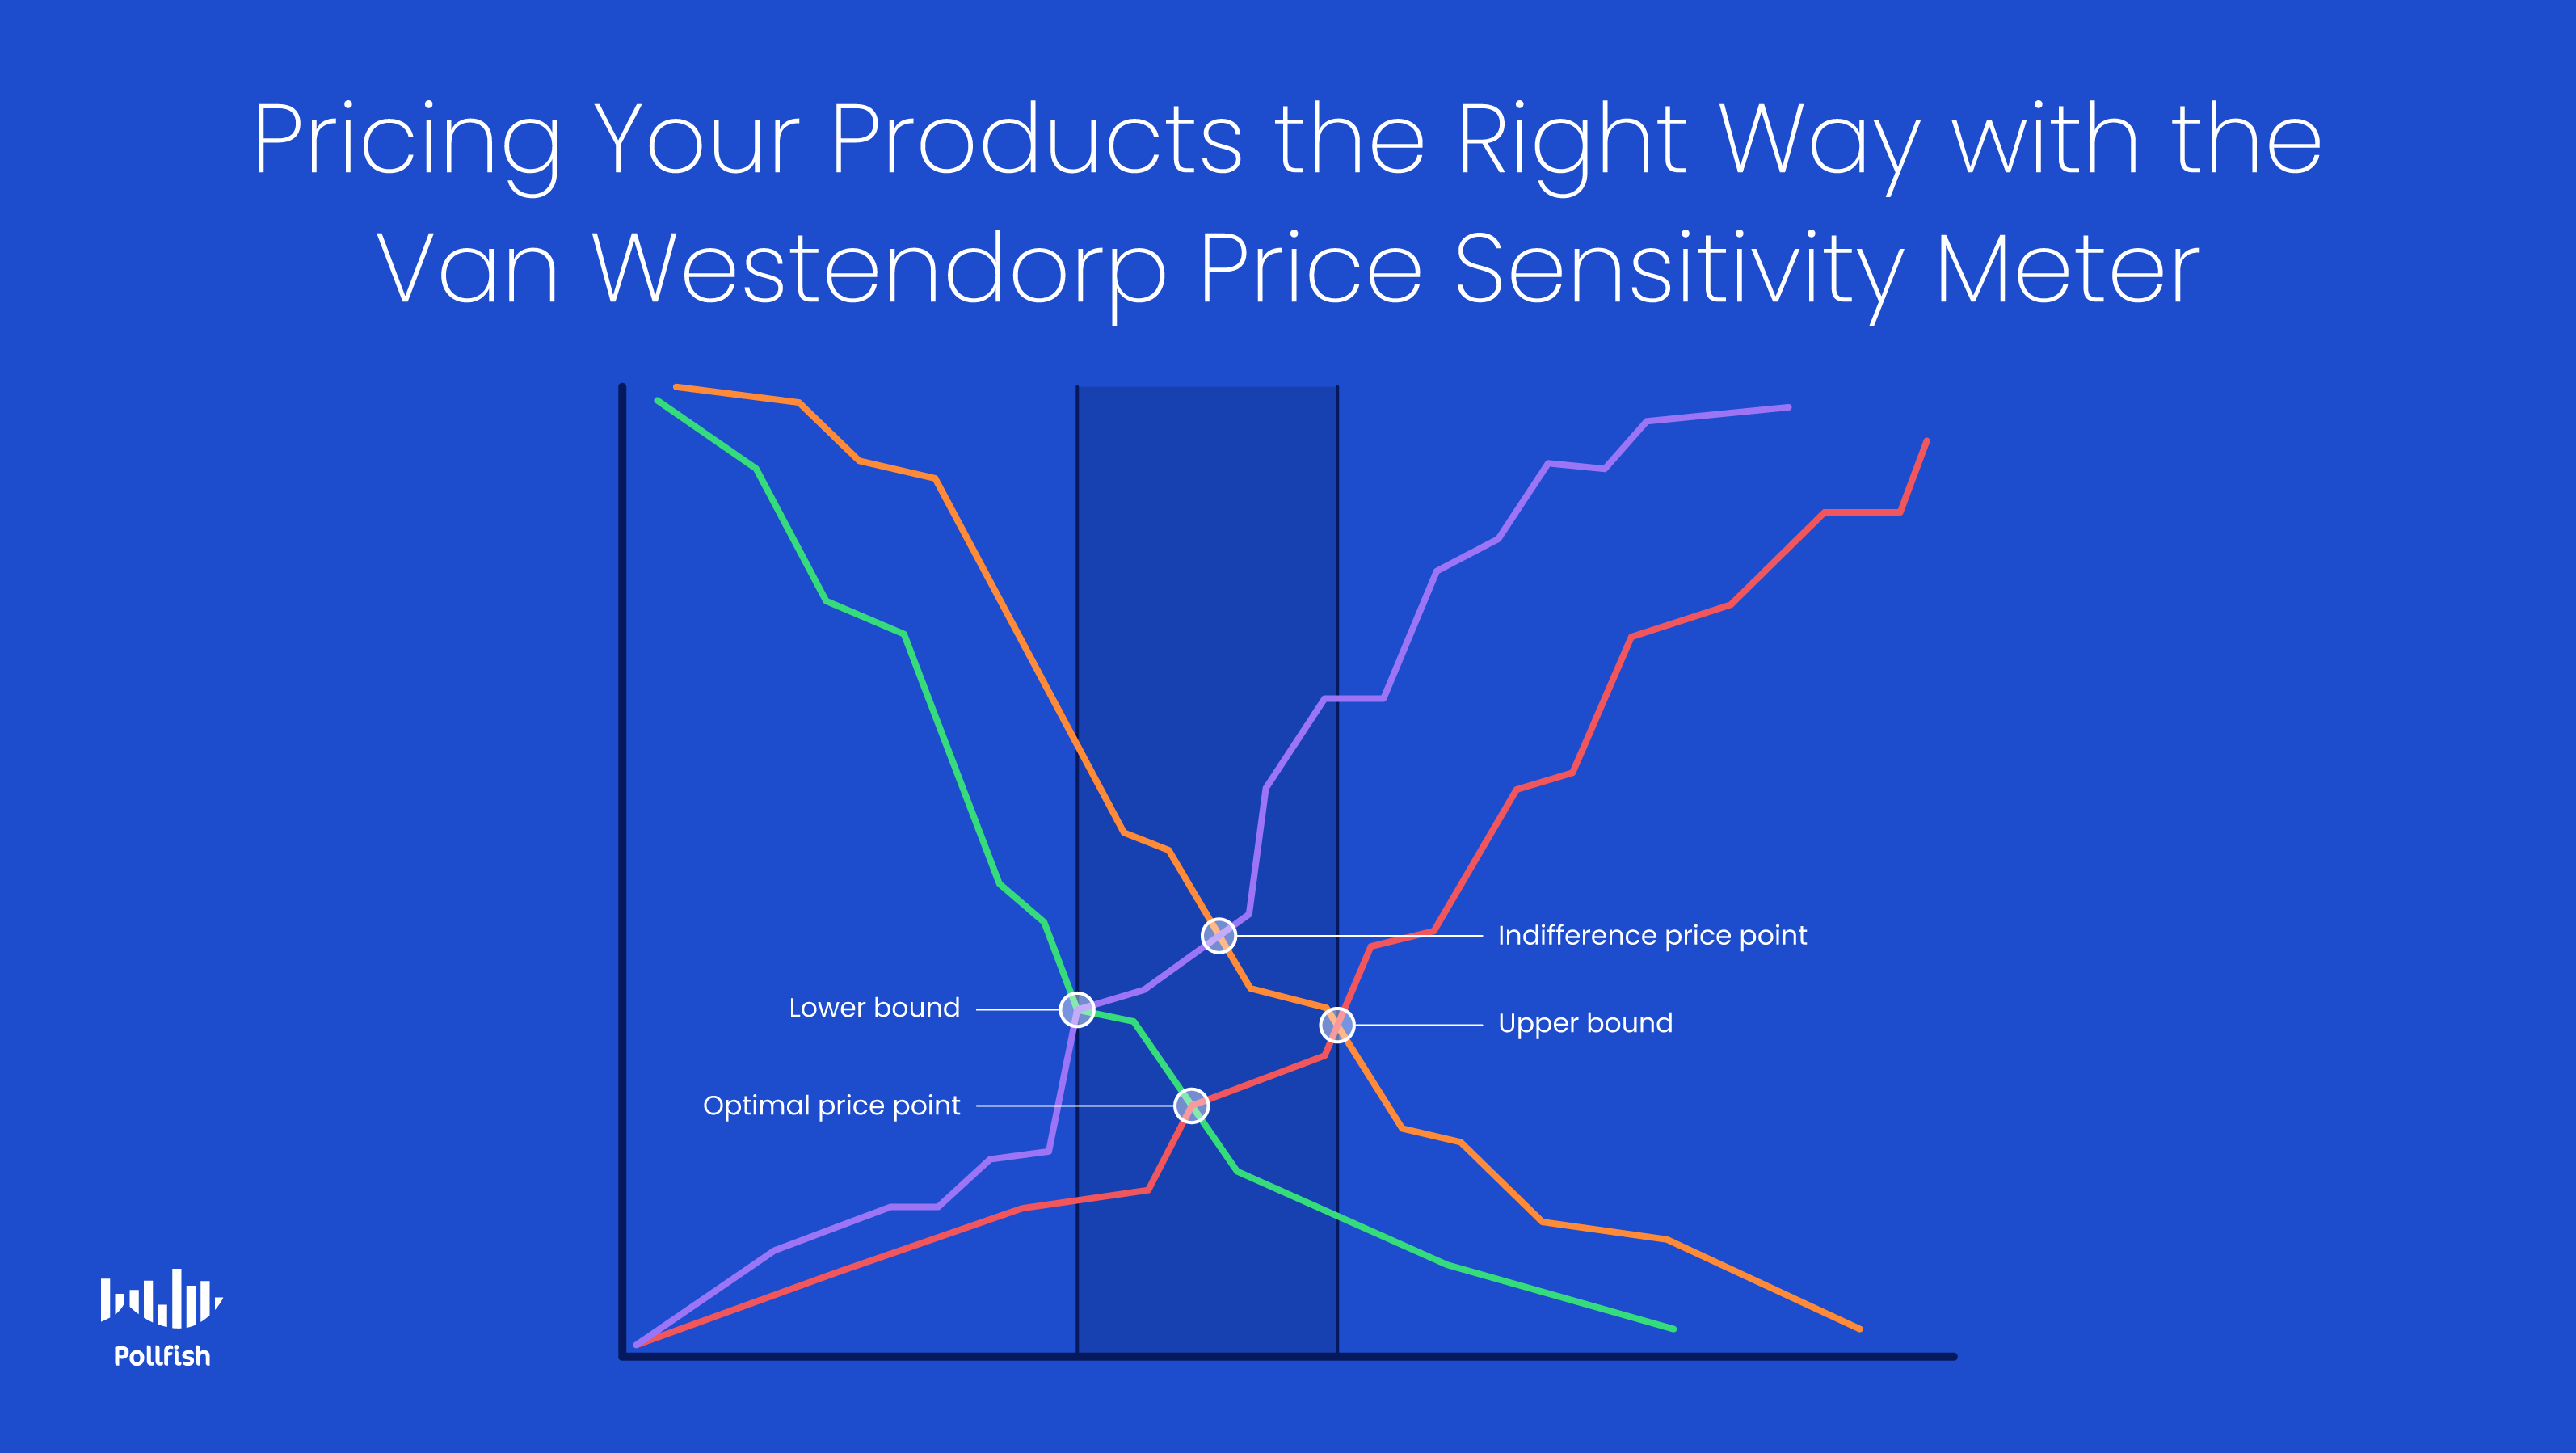
The Pollfish online platform presents the results of the PSA method in the aforementioned chart. The chart is a representation of the cumulative percentage of respondents/price.
The Price Sensitivity Meter appears as the following on the platform:
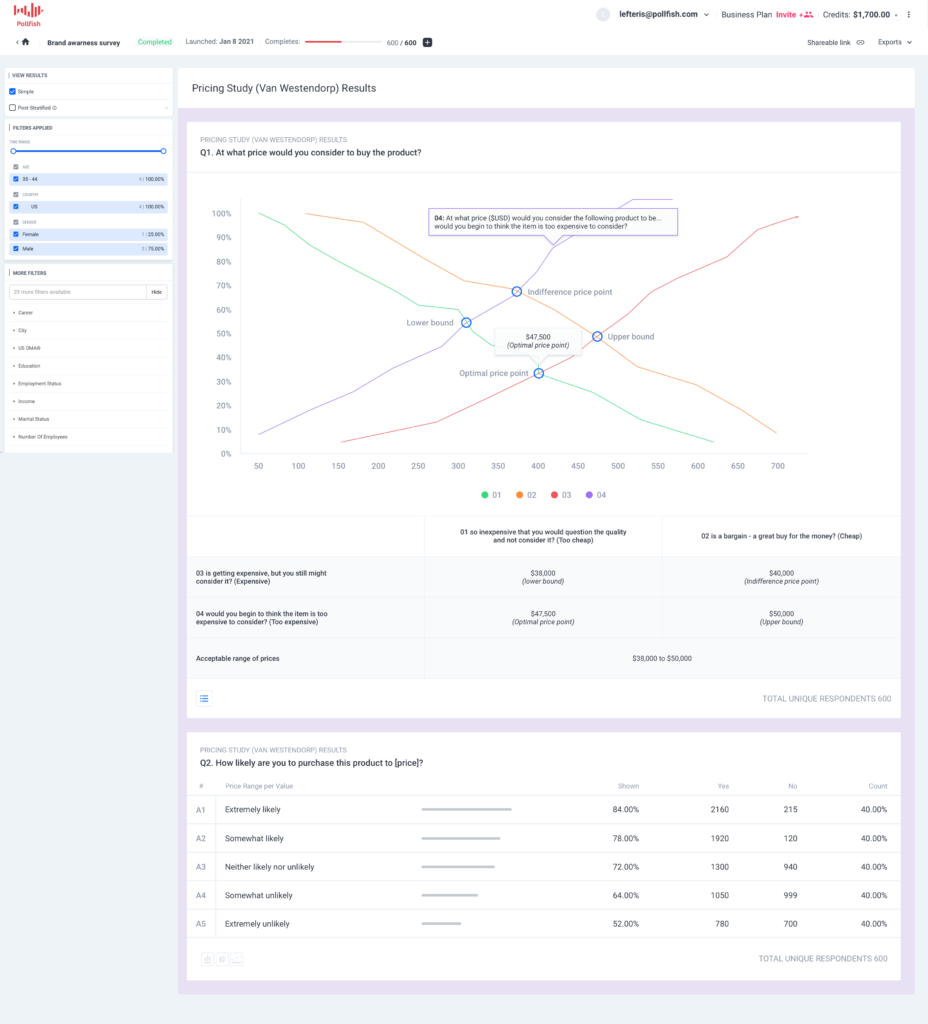
This chart is the outcome of the PSA approach, showing researchers the price range from the lower bound to the upper bound for the product/service. It also allows them to unearth the “optimal price” point and the “indifferent price point.”
This marks the end of the standard or basic PSM. However, the Pollfish platform offers an enhancement to this market research technique. This is called the Newton-Miller-Smith Extention.
The NMS extension grants researchers the ability to add additional questions (2 or more) about the likelihood of customers purchasing the products and services they were shown/ asked about.
These questions will appear after the four Van Westendorp ones. They exist as rating scales. For example: “On a scale of 1-7, how likely are you to buy this product?”
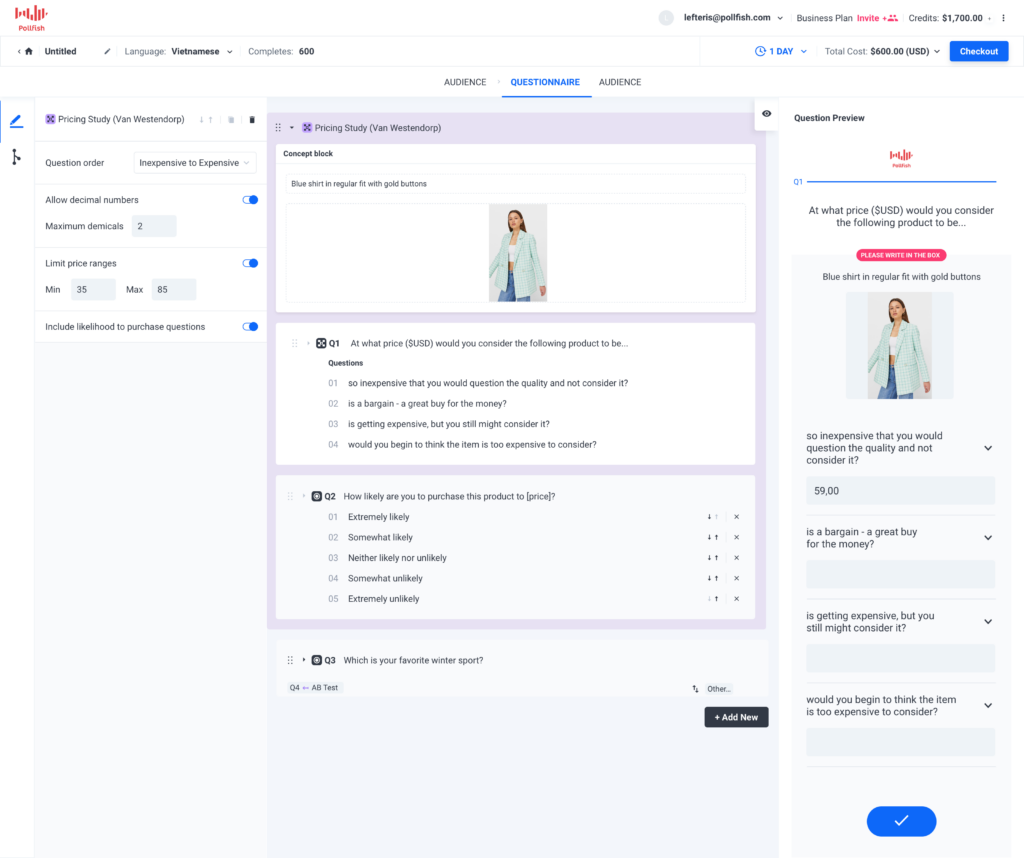
Ultimately, this extension allows researchers to not only understand customers’ sentiments towards price points, but to ascertain whether they will buy the products or not.
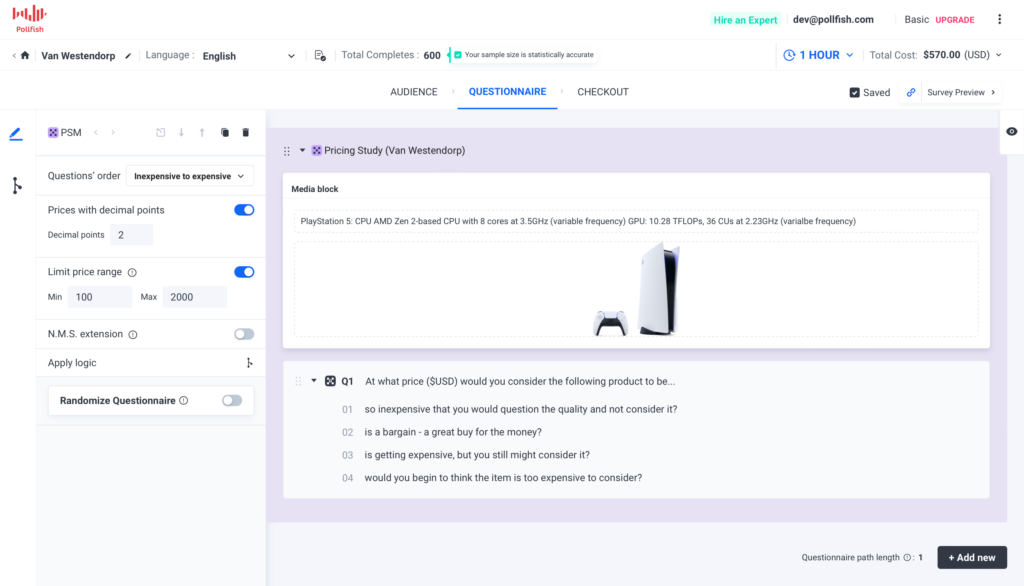
The Van Westendorp Price Sensitivity Meter Survey Questions
These questions remain the same in the PSA model. The following displays these survey questions: questions, which exist as numeric, open-ended survey questions.
- At what price would you consider the product to be priced so low that you would feel the quality couldn’t be very good?
- Discovers whether a price is too cheap
- At what price would you consider the product to be a bargain—a great buy for the money?
- Discovers whether a price is either on the cheaper end or a good value
- At what price would you consider the product starting to get expensive, so that it is not out of the question, but you would have to give some thought to buying it?
- Determines whether a price is expensive or on the upper pricing echelon.
- At what price would you consider the product to be so expensive that you would not consider buying it?
- Determines whether a price is too expensive or on the upper pricing echelon.
Using Advanced Skip Logic (2022 Update)
The Van Westendorp Pricing Meter now supports the usage of the Pollfish advanced skip logic feature. This valuable addition to the Price Sensitivity Meter enables you to route respondents to relevant follow-up questions based on their previous answers. Thus, you can create a deep dive into customers by asking them questions based on their specific answers from a prior question.
You can use advanced skip logic when a respondent exits the Van Westendorp PSM. This new capability strengthens and empowers the PSM to be more relevant and personalized to respondents' survey experience.
Forming Optimal Pricing Strategies
Forming an optimal price strategy is difficult; this is compounded when you consider shifting expectations with new seasons. After all, you ought to stand out from your competitors by offering better prices, but also ensure that you’re not selling yourself short.
The Van Westendorp Price Sensitivity Meter allows you to do just that, saving you the guesswork and hesitation in setting prices across all your products and services. What’s best is that it is included in the Pollfish online survey platform.
Remember, you should use a market research platform that deploys surveys within a mass network of publishers, ones that account for major websites, apps and mobile sites, along with one that also grants you the ability to send surveys your own way.
A strong market research platform will also attract your survey audience with an appealing digital element that leads to your survey and easily grabs users’ attention. In addition, it will partner with publishers who gamify surveys, allowing respondents to gain incentives while playing a game, making the experience far from boring.
You should also opt for an online research platform that makes buying survey respondents a quick and simple process. This way, you’ll collect all your necessary data from the right respondents in a short space of time.
Additionally, use a platform that features artificial intelligence and machine learning to remove low-quality data and offer a broad range of survey and question types.
Applying an online survey platform with all of these capabilities will empower you to reach any survey audience and gain all of their thoughts on all price ranges, allowing you to form smarter and more effective pricing strategies.