
New Pollfish Feature: A/B Testing Directly in Questions with the Monadic Version
New Pollfish Feature: A/B Testing Directly in Questions with the Monadic Version
Pollfish is thrilled to now offer an A/B testing functionality in our dashboard, enabling market researchers to easily test concepts alongside one another. It is now easier than ever to test a variety of concepts, whether it is for marketing, advertising, branding or pure market research needs.
A/B tests can be used to compare product concepts, communication ideas, or specific ads using equally structured groups of participants.
In our first iteration of A/B testing, we introduce the Monadic version. Two more versions are slated to be released on the platform — all of which are set up as a question type. The next two are the sequential and conjoint analysis.
The monadic and sequential version is open to all account types, while the conjoint analysis version is for Elite accounts only.
This article explains A/B testing, how to use it in the Pollfish platform and the three versions Pollfish offers.
Understanding A/B Testing on the Pollfish Platform
A/B testing on Pollfish is performed as a new kind of question type. That means, to perform the test, the A/B testing function has to be added to each survey that researchers wish to apply the test to. As such, A/B testing is an option that researchers can apply to their survey.
There can only be one A/B test per survey.
Researchers cannot apply advanced skip logic in the A/B group. However, they can apply logic to questions before and after the A/B group, as well as include the A/B group in the logic path.
All respondents who will be directed in the A/B testing will be randomly assigned to a concept, if the test is monadic. Pollfish ensures that all concepts are evenly distributed to the audience.
You cannot apply the question function of Recall Information, which places the text from a previous question onto another or the Carry Forward function, which pipes a part of a question or answer into another, to questions within the A/B Test. Those features are disabled in the A/B test.
There are different options available to view the A/B test results. Researchers can filter per concept; they can isolate a concept or compare two or more concepts.
Different table views are available for different questions, such as Single, NPS, Rating stars etc.
The researcher can view the concepts per answer or per concept. Attributes (more on this in the following section) will be displayed next to the questions.
The Monadic A/B Testing Version
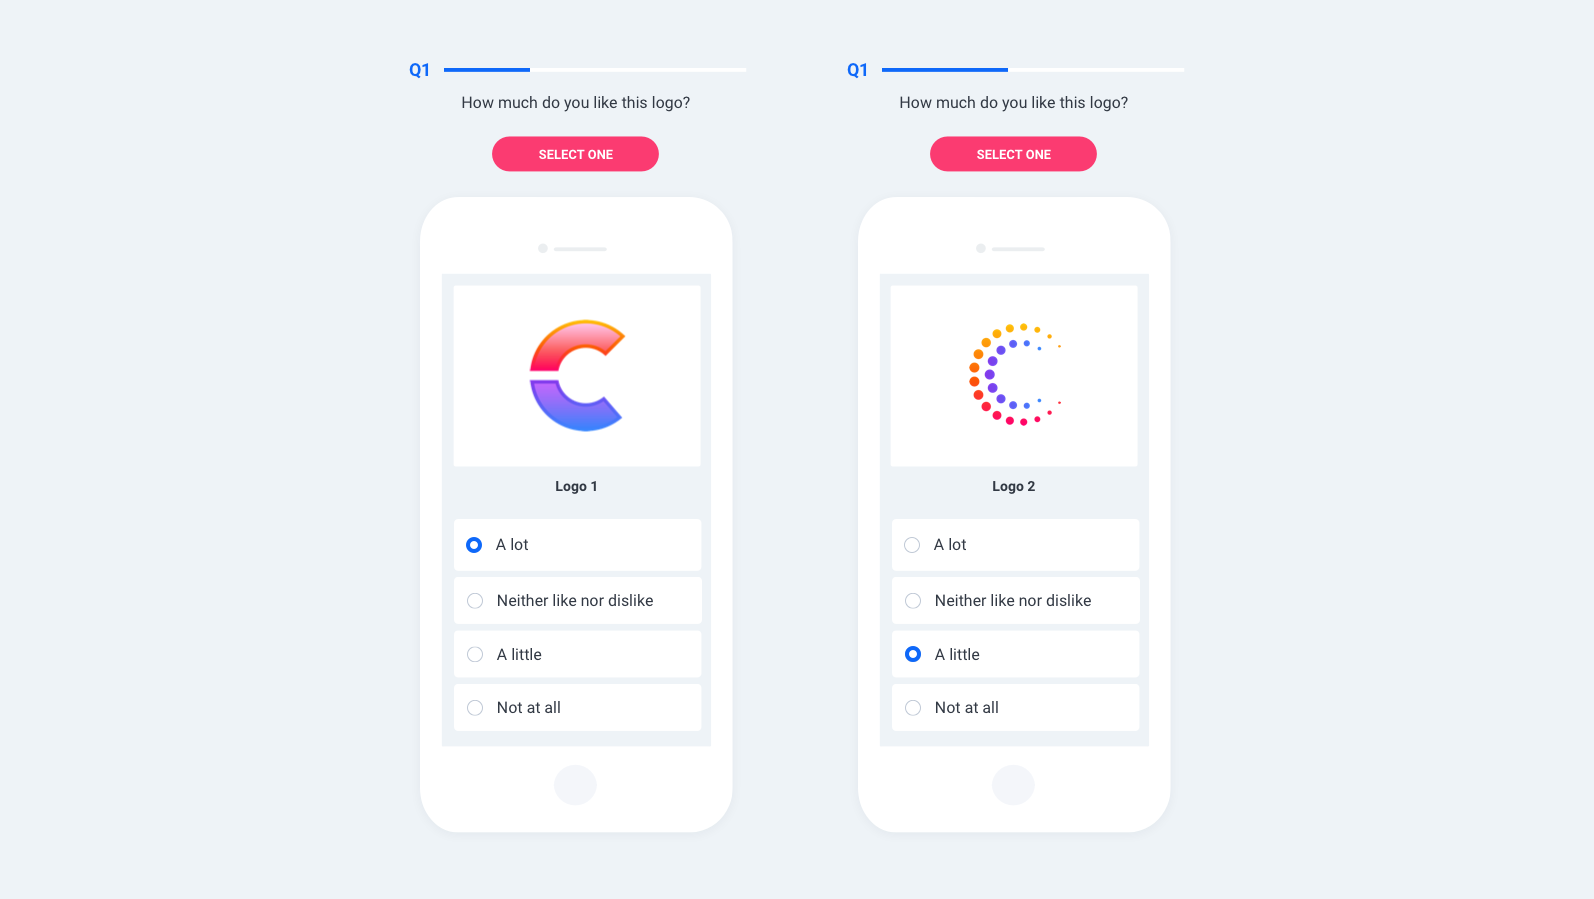
Monadic testing is a useful survey design that allows a respondent to claim their preferences for one concept or product they will randomly get, out of the many that the researcher wants to test and compare, instead of being exposed to two or more at once.
Focusing participants' attention on just one stimulus at a time grants researchers a deep dive into making product, pricing and various marketing decisions.
Monadic testing is typically used for gathering independent findings for each stimulus — a contrast to comparison testing, where several stimuli are tested side-by-side.
In the monadic version, each question in a monadic group counts individually to the cost calculation as a simple question. For example, if the monadic group includes ten questions and you add eight questions outside of the monadic test, the price will start at $1.25 per response in a basic account.
The monadic test uses what is known as “attributes" which allow researchers to use different representations of the concept in a monadic question. These involve different media, such as images, videos, GIFs, audio recordings, long descriptions, short text such as a tagline and use text formatting.
For example, for a soft drink concept testing, you would add logos, packaging, and pricing attributes.
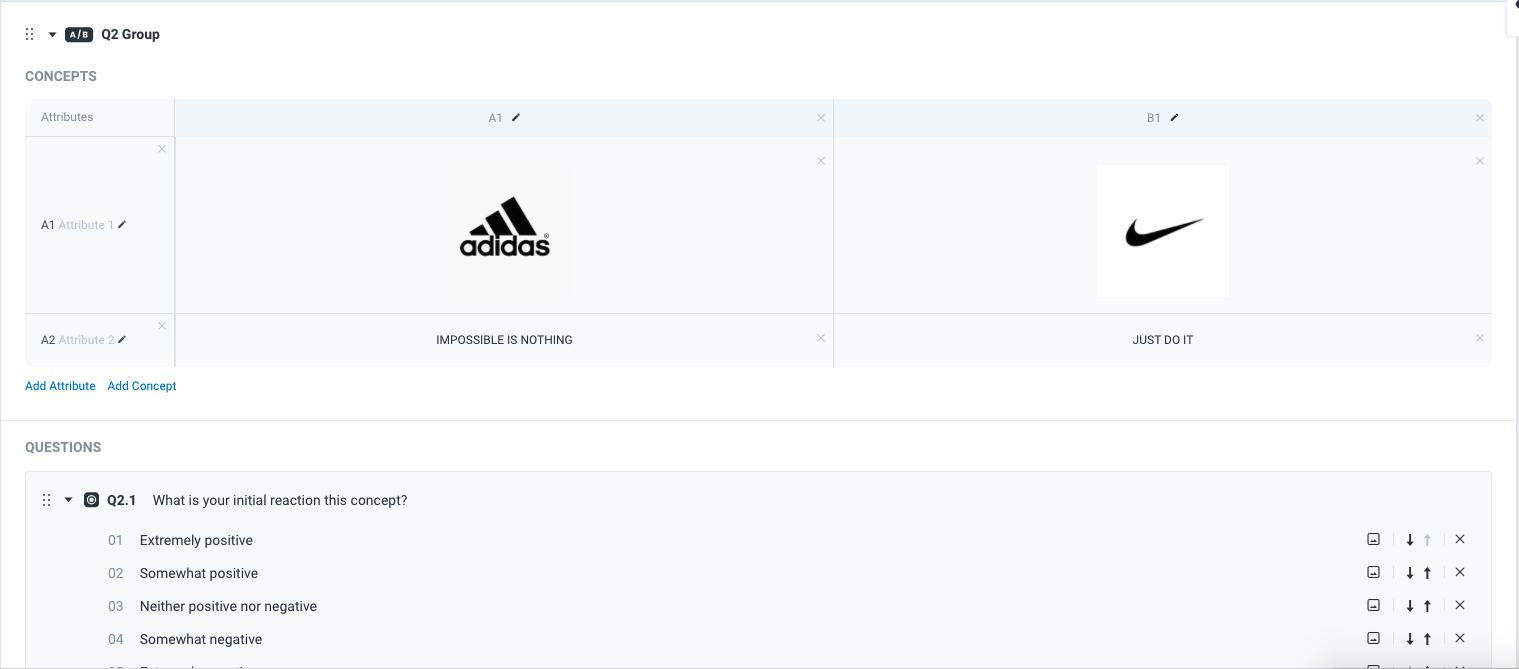
The attributes in monadic testing are displayed on a monadic table, which defines the order of the attributes. The rows (in the left panel) are named A1 (the first), A2 (the second) and so on. Thus, the respondents view every question within the A/B test accompanied by the attributes selected at the left panel.
Researchers can apply logic and direct responses after the monadic test; thereby skipping it. In this case, the researcher must understand that the final results for each concept may not be evenly distributed. As aforesaid, skip logic is not supported within the A/B test, so it can only be applied outside of it.
How to Create a Monadic Version A/B Test
Follow these steps to create and view a monadic A/B test on the Pollfish platform.
- To create a monadic test, go to the questionnaire section of a survey.
- In the left panel, click on "add new," then click on AB Test.
- Below that, there is a dropdown menu to select the type of A/B test. Choose Monadic.
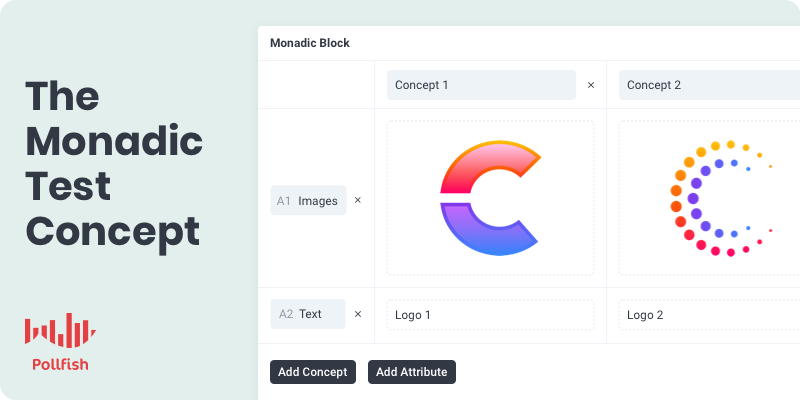
- In the concepts table, enter the attributes, these can be media files or text or even combined.
- You can view these in your results page, while the survey is running and when the results are ready.
- As the survey is running, you have the option of translating the survey, including the A/B group of questions.
Using A/B Testing to Accompany All Campaigns
With the recently released feature of A/B testing, Pollfish allows market researchers to test virtually any concept while running a survey in tandem.
With three new kinds of A/B testing soon to be available on the Pollfish online survey platform, it is now easier and smoother than ever for market researchers to incorporate A/B testing into their survey research.
Pollfish supports all exports (except the crosstab) for A/B tests. These are generated containing the concept data per each question. Hence, each question is generated as many times as the concepts, and is accompanied by the concept name to distinguish between the different concepts. Crosstab export with concept data, will be supported shortly after the monadic version is released.

Incorporating Custom Terms & Conditions in Surveys for Privacy, Disclaimers & Much More
Incorporating Custom Terms & Conditions in Surveys for Privacy, Disclaimers & Much More
The new Pollfish feature allows researchers to customize their surveys to the max. Researchers can now include additional custom terms and conditions in their surveys.
These serve as a preface to the survey, allowing respondents to understand the unique conditions and aspects of the survey itself and its broader study. As such, it is a kind of opener to the survey that allows respondents to understand what their participation entails.
Additionally, they are always used in surveys and are mandatory for respondents to accept in order to take a survey.
The Pollfish online survey platform makes it easy to create, edit, insert and access customer terms and conditions to all kinds of surveys. Researchers don’t need to be tech-savvy to include these, making their creation and use a seamless process.
Thus, democratizing the survey pre and post-launch is an easy cycle for all those involved.
This article explains the necessity of using custom terms and conditions in surveys, along with how to include these elements on the Pollfish platform.
The Need to Preface Surveys
Adding custom terms and conditions in surveys is a necessity for many brands and researchers, as it prefaces key aspects of the survey and its study. More importantly, it relays key information about matters such as privacy, data use, consent and many others.
This is important, as it enables the survey and its larger study and campaign to be as transparent as possible. By including these terms and conditions, respondents won’t be left guessing the implications of their participation, how their data will be used, whether they’re answering anonymously and more.
In this way, adding terms and conditions can assuage respondents’ fears, dispel their misconceptions and eliminate any misgivings they may have about taking the survey. Thus, it gives respondents peace of mind, increasing their likelihood of taking the survey, rather than opting out.
Although indirectly, this contributes to shorter total survey completion time, as more online users will opt into the survey, accelerating competition times across surveys.
In addition, some countries require compliance with data anonymity laws, such as the GDPR. Therefore, the data subjects residing in such countries will require surveys that have terms and conditions alluding to GDPR compliance.
Finally, given that these terms and conditions can soothe respondents' doubts about taking the survey, this feature can help raise the survey completion rate. This plays a major role in extracting speedy insights.
Additionally, if a brand decides to use its name and likeness in a survey, using terms and conditions will help it improve its standing and reputation. While this may seem to be a stretch, consider the importance of these terms/conditions. The fact that they remove respondents’ doubts, fears and misgivings will paint the survey and its study in a positive light.
When a business is associated with such a survey, its brand will therefore be seen in a positive light.
What Terms and Conditions Include and Can Be Used With
As the above section explains, including terms and conditions in surveys is important for a number of reasons — from legality, to giving respondents peace of mind and everything in between.
As such, survey terms and conditions can be used for a number of purposes and applications. The following lists what these terms and conditions can include and the applications they can be used with:
- Disclaimers
- Respondent responsibilities
- Acknowledgment and acceptance
- User privacy
- Terms of use
- Modification of prior services or terms
- Confidentiality
- Registrations
- Proprietary rights
- Anti-spam reassurance
- Advertisers
- General transparency
How to Include Custom Survey Terms and Conditions in a Survey
The Pollfish platform makes it practical and easy to include additional survey terms and conditions to any kind of survey and for any region of the globe.
The following explains how to create custom terms and conditions for survey research and how to use them with any kind of survey.
Follow this short step by step guide:
- Open up a survey in the Pollfish dashboard.
- To access the Survey Terms & Conditions button in the navigation, you must be in the targeting or questionnaire section.
- In the upper navigation bar, click on the icon of the survey with a small check on its bottom right.
- This represents the button to click on for creating, editing and accessing survey terms and conditions.
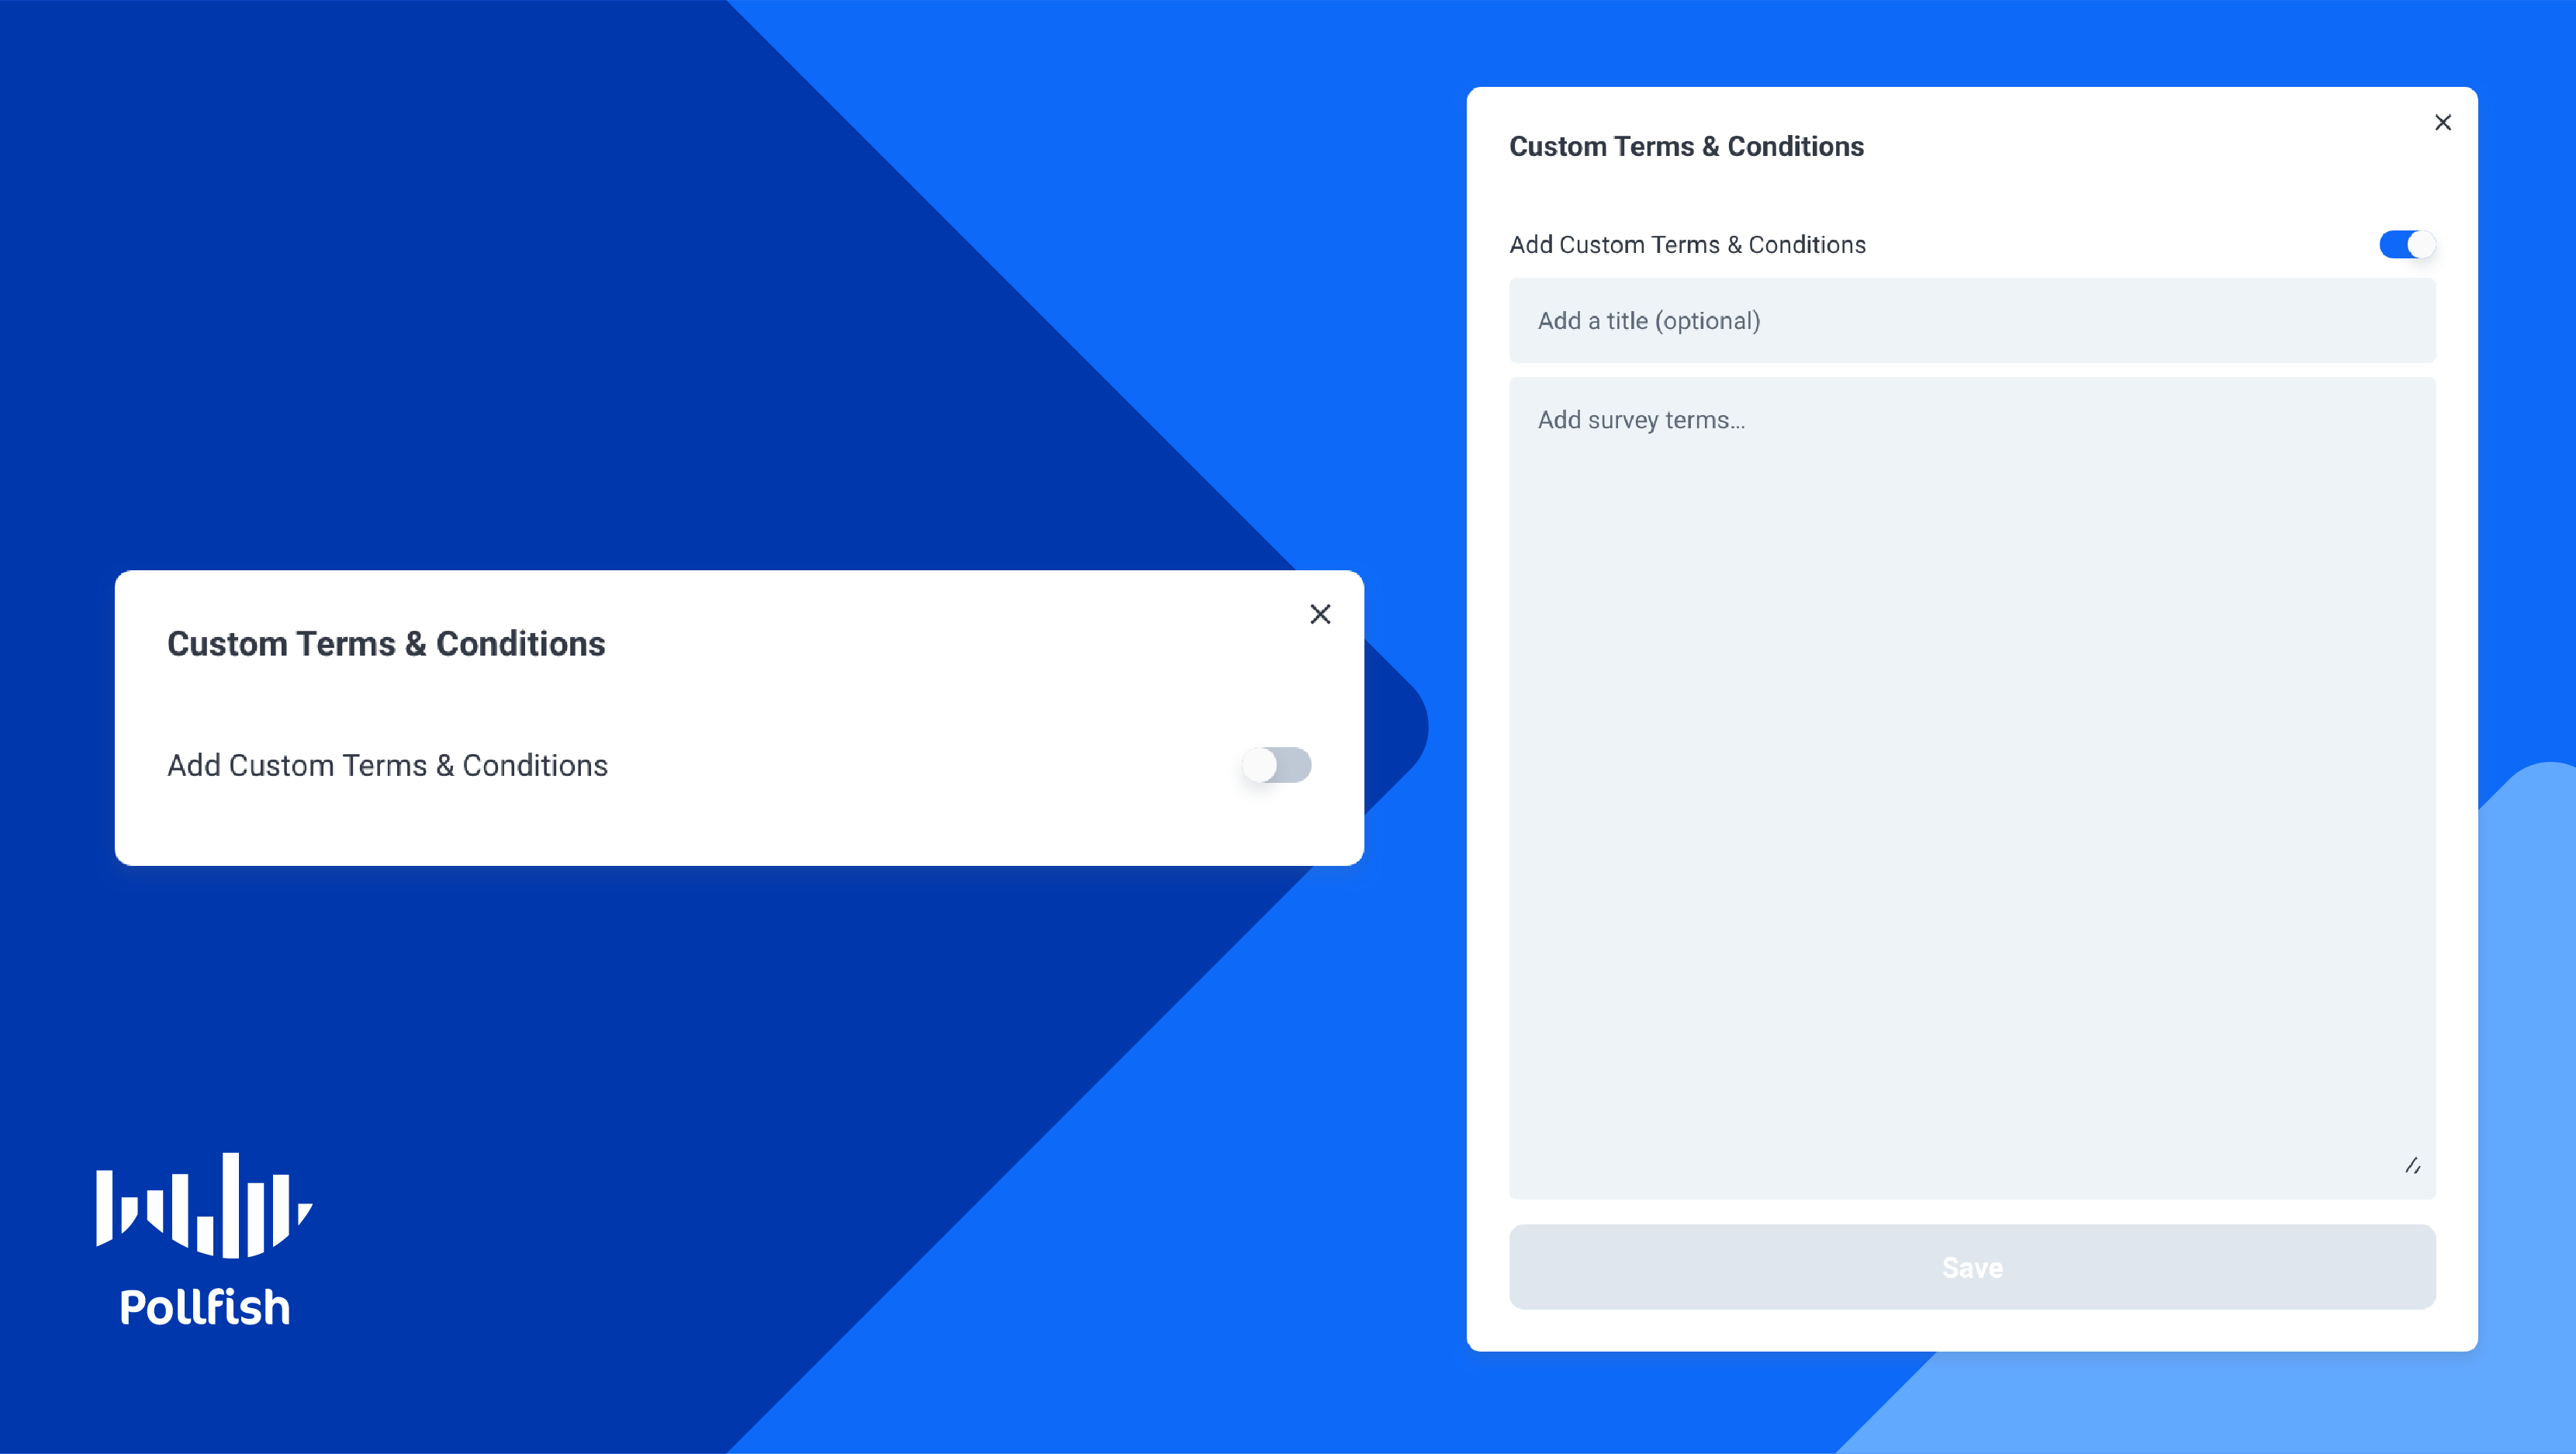
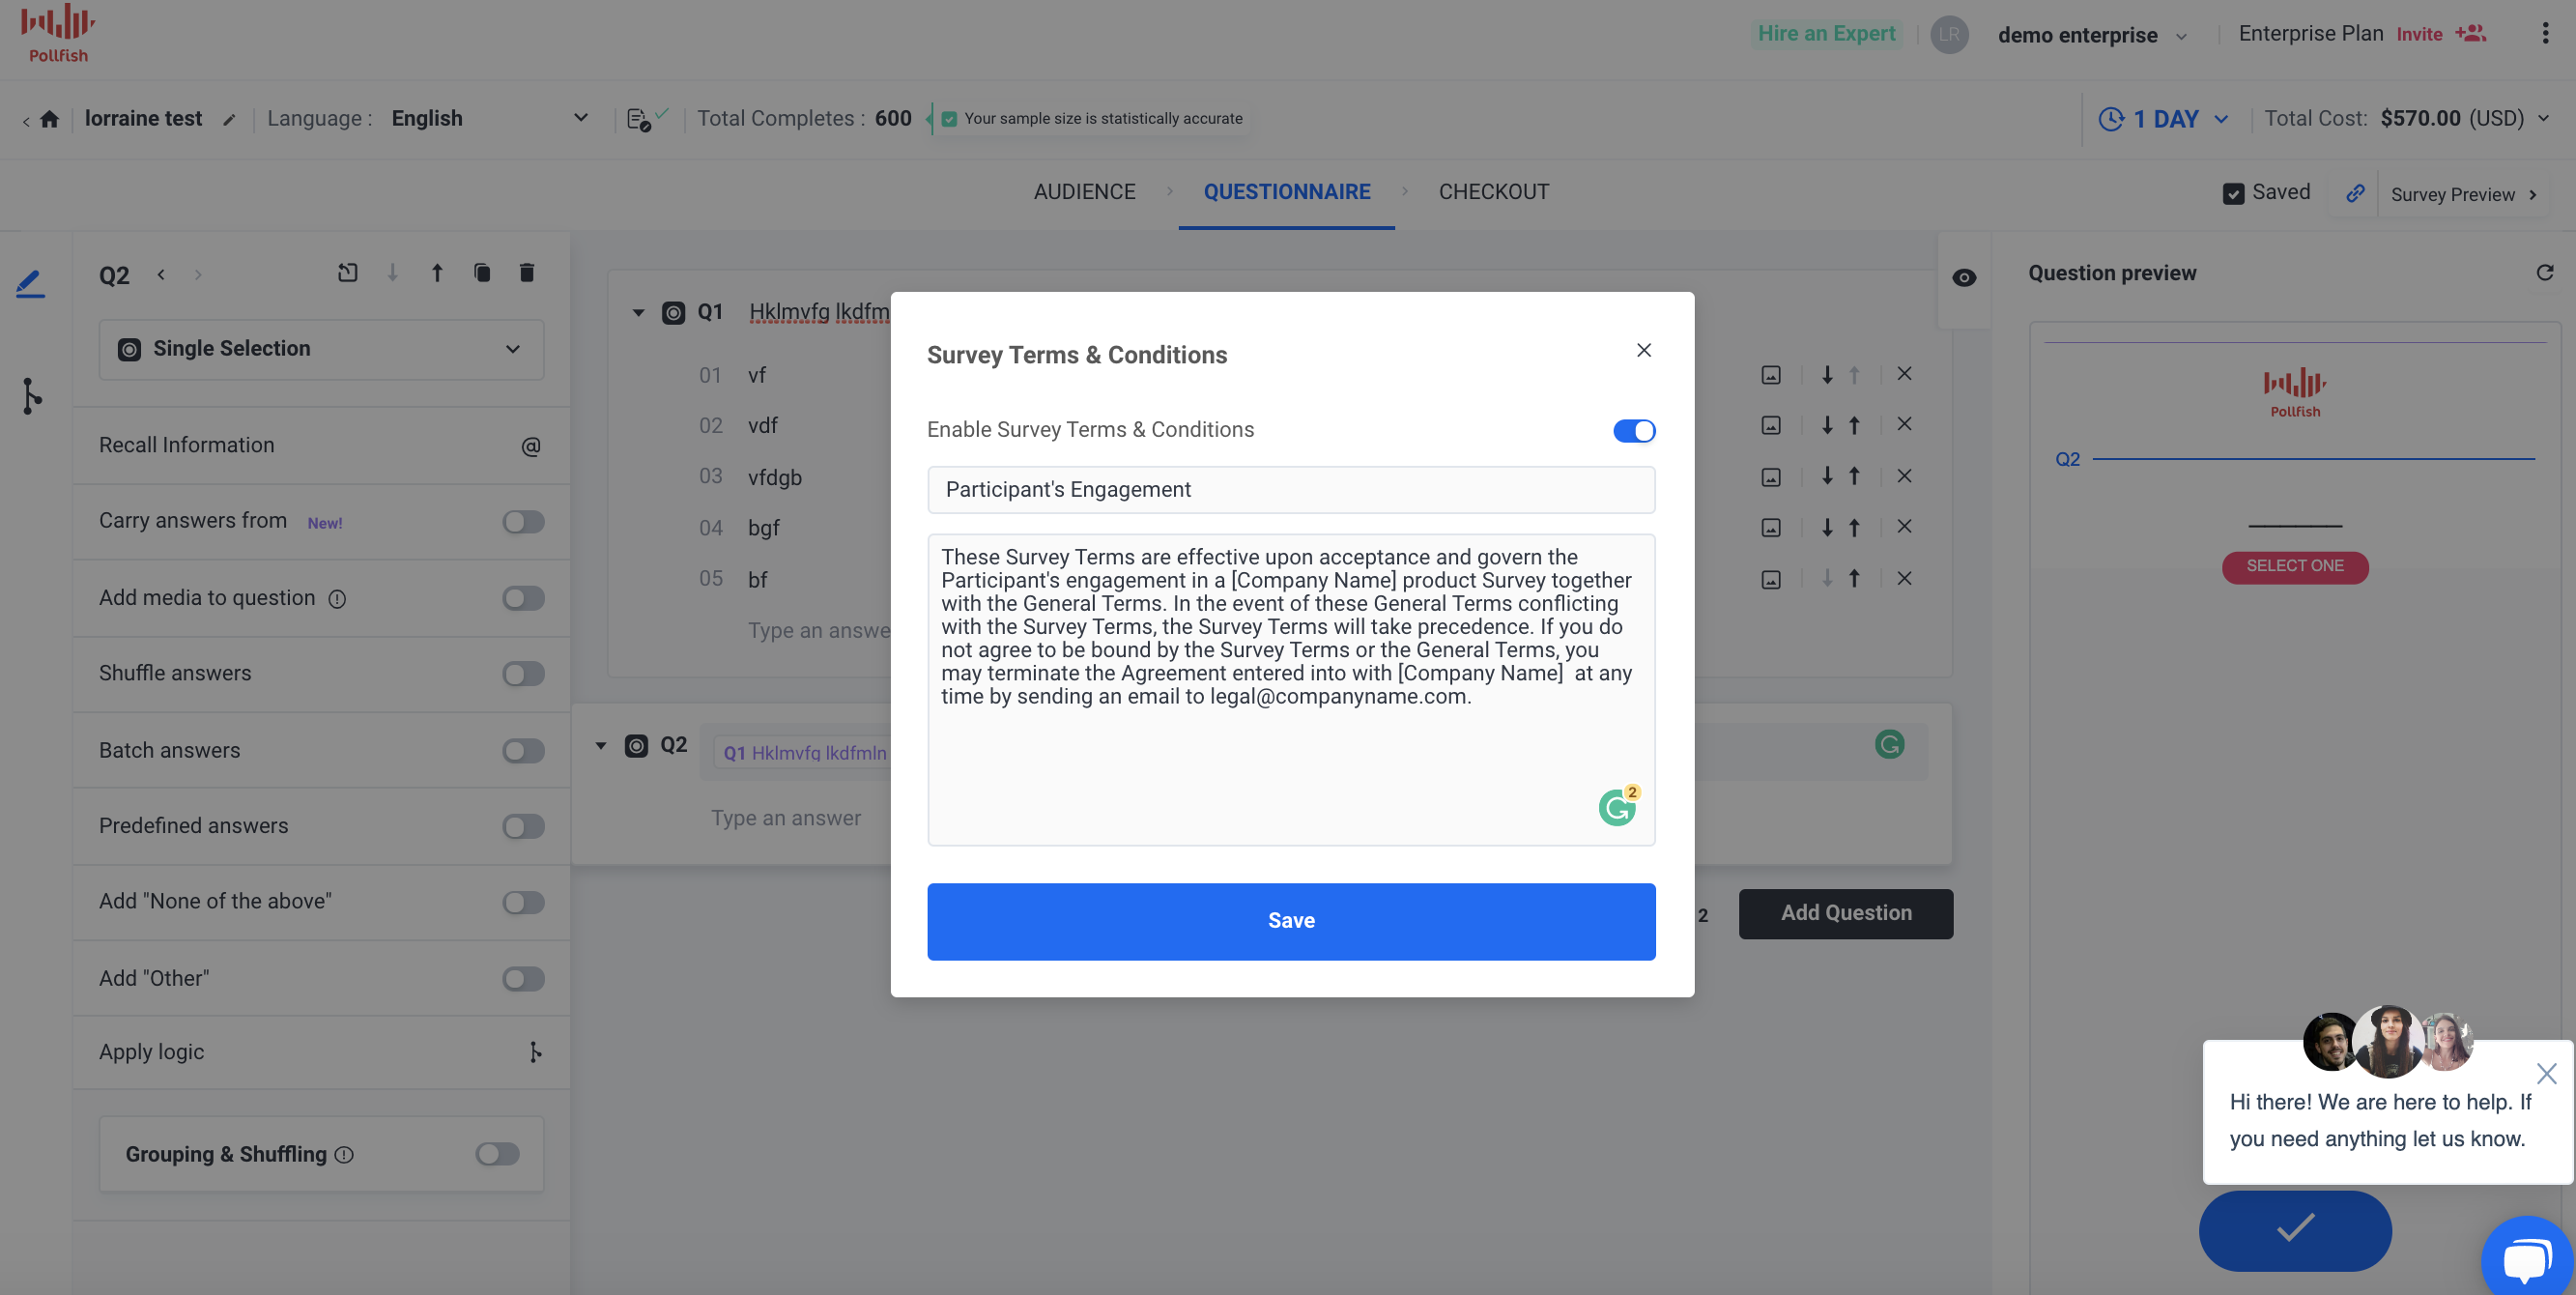
- A pop-up window will appear, titled Survey Terms & Conditions.
- In the pop-up, click on the toggle to enable the terms and conditions.
- In the field below, you can add and edit the text of the terms and conditions.
- Hit Save to save your changes.
- You’ll see the Survey Terms & Conditions icon on the top navigation will have a green checkmark and blue dot to mark that survey terms and conditions were added.
- To view the terms and conditions in the survey click on the Survey Preview button at the top right
- Click on the text of the terms and conditions button on the bottom; this will expand the text.
- Right next to the Terms and conditions a link “View Survey Terms” will appear
- This will take you to the additional terms and conditions specifically.
A Holistic Survey Experience
This new feature allows market researchers to provide a holistic survey experience to their target population, as terms and conditions are critical elements of a survey’s introduction, as well as its entirety and its study at large.
Its ease of access and editing makes including these terms easy, practical and stress-free. Researchers will never have to worry about respondent misgivings, fears and other roadblocks when it comes to prefacing their surveys about privacy, agreements and many other issues.
This new feature is therefore the perfect solution for creating and accessing survey terms and conditions — the kind that are unique to each company, campaign and customer.

Understanding the Data in Multiple Selection Questions
Understanding the Data in Multiple Selection Questions

Several market research campaigns and survey types will require using multiple-selection questions — questions in which respondents have the option to select more than one answer.
In opposition to single-selection questions, multiple-selection questions allow researchers to gain a more granular understanding of their target market.
They are often generated via advanced skip logic, that is, the automatic function that routes respondents to different questions based on their answer(s) to a previous question. They may also be used as the original questions on which skip logic is based.
In the Pollfish platform, multiple-selection questions yield various data in the form of percentages. This article explains the meaning behind the different data and how to navigate them with ease.
The Utility of Using Multiple-Selection Questions
There are a number of reasons as to why you should create multiple-selection questions. First off, they provide more precise answers. This is especially important when respondents cannot settle upon one answer, as multiple answers may apply to them.
Secondly, using multiple-selection questions help you thwart the Survey Scope Error. This error arises when researchers omit certain things from questions that would fully address the issue surrounding a topic. Multiple-selection questions help evade this error, as you are able to cover as many possible answers as possible in solely one question.
Moreover, multiple-selection questions help researchers clamp down on other survey biases, such as Demand Characteristic Bias. As its name suggests, this bias takes hold during the presence of a demand characteristic. Denoting an unintentional cue in the survey that influences respondents' answers, this bias can occur if a researcher gives away the purpose of the survey study.
 Multiple-selection questions stamp out this bias, as providing various answers helps keep the purpose of the survey latent. In other words, it drowns out the obvious. Thus, respondents won’t be inclined to give false answers to produce specific results, ie., those that will benefit them somehow.
For example, in a community survey, respondents may change their answers if they discover the purpose of the survey is to allot benefits to community members. The same idea applies to all other verticals and survey types.
Lastly, multiple-selection questions provide an overall better experience on the researcher side and the end-user side. This is because these questions allow respondents to better express themselves, coupled with gaining more concrete insights to researchers and businesses.
They also remove the need to ask multiple questions about the same topic and can incorporate a choice for an open-ended answer by using the choice designating “other”.
The Different Data in Multiple-Selection Questions
Since these questions deal with multiple answers as opposed to just one, they offer more than one point of data about every such question. In the dashboard, you’ll see two metrics in the results of a survey with these question types.
These can be confusing since they deal with multiple answers; some respondents may choose only one, while some may choose two or even all of the selections.
We’ve laid out the meanings of each metric to avoid any confusion. But first, you ought to understand the meaning behind “count,” which is used to calculate the other data.
Count
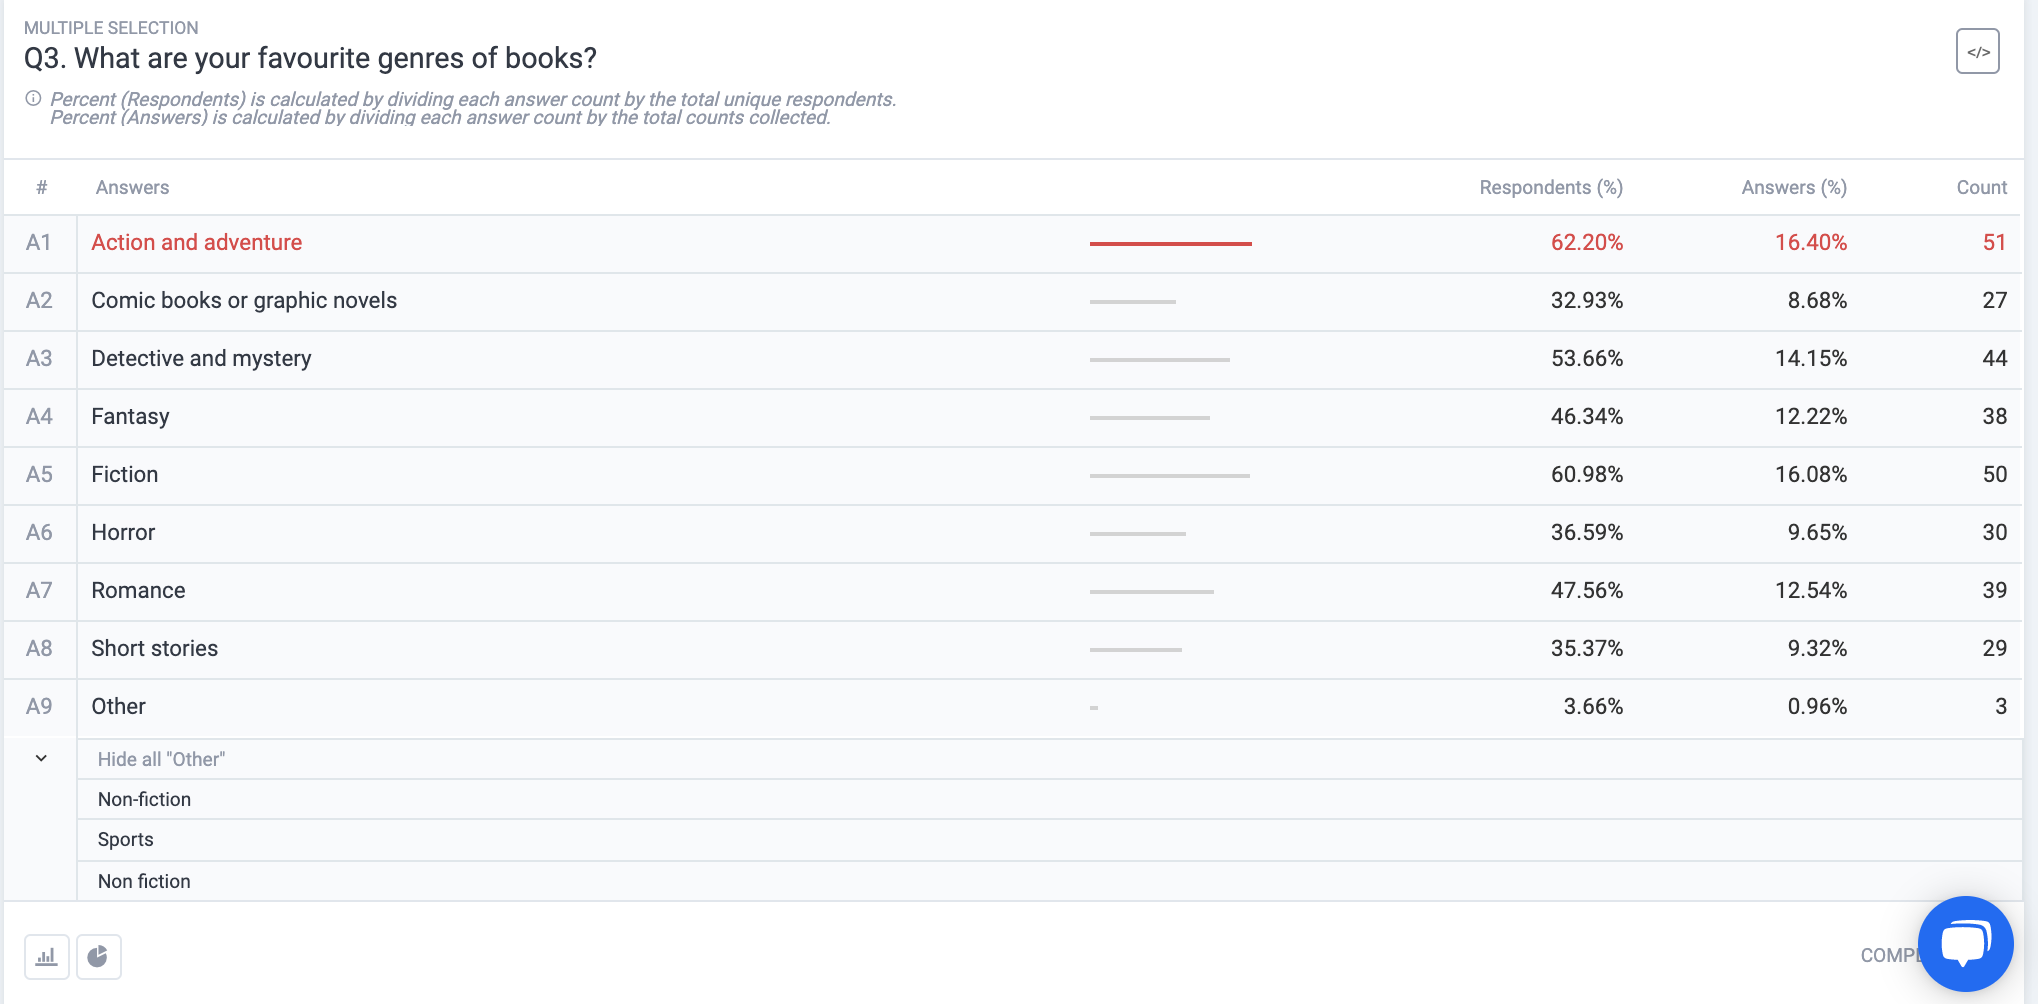
The count refers to the number of times that one answer was selected. It would need to be selected at least once to be considered.
For example, if the count is 51, that means an answer was selected 51 times.
Percent of Respondents
This piece of data is calculated by dividing each answer count by the total amount of unique respondents. Then, to get the percentage, the quotient is multiplied by 100.
For example, if the count is 51 and the total number of unique respondents is 82, the calculation is as follows:
51/82 = 0.6219
0.6219 x 100 = 62.19
% of Respondents: 62.2%
Percent of Answers
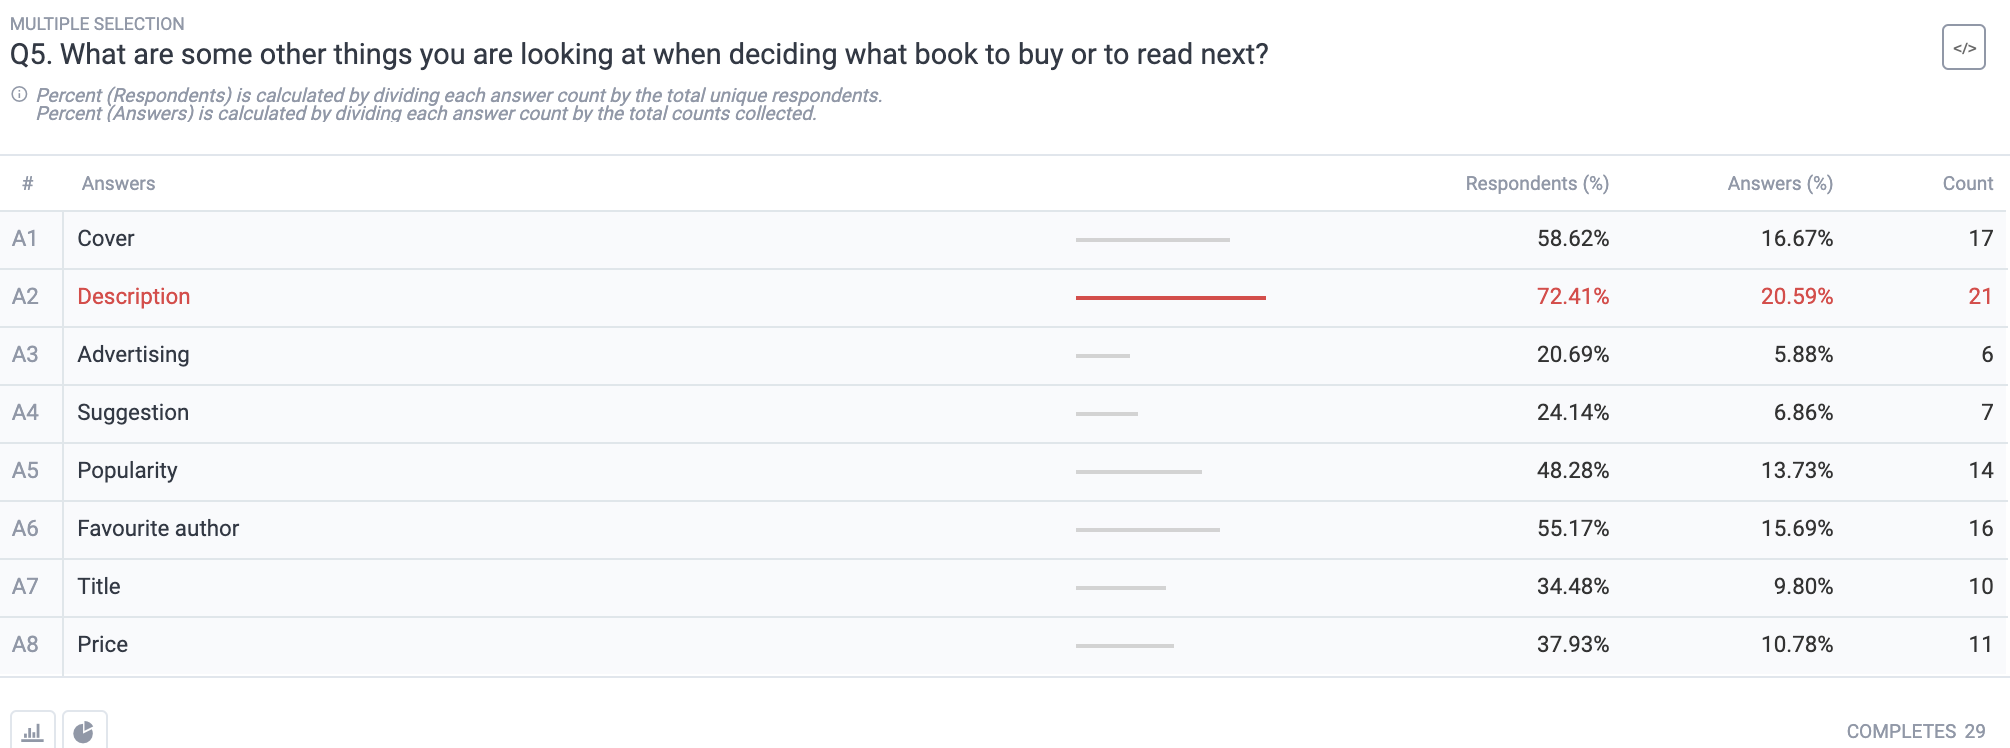
This percentage refers to a calculation centered on counts. It is calculated by dividing each answer count by the total counts collected per question. This variable is not readily visible. This is because it involves adding all the counts per question.
As such, this is typically where researchers stumble upon difficulty, as adding each count together gives you a number far higher than the number of respondents participating.
But, this is the nature of multiple selection questions: the fact that each respondent can select more than one answer, the total count of answers will be much higher than the number of respondents.
After you work out the quotient from the preliminary calculation (above), you multiply it by 100 to get the percentage.
 For example:
Number of counts of one answer = 51
Number of answers in the question = 9
Add the count of EACH of the 9 answers:
51 + 27 + 44 +38 + 50 +30 + 39 +29 +3 = 311
311 = total counts per questions
51/311 = 0.1639
0.1639 x 100 = 16.4%
% of Answers: 16.4%
Making the Most out of Multiple-Selection Questions
Multiple-selection questions can be more difficult to navigate, given that there are more answers to parse.
As such, understanding the metrics illustrated above will empower you to understand the overall sentiment around your answers. They are also critical when you conduct survey data analysis, as more points of data serve as key findings in your survey campaign.
These bits of data help you understand your respondents’ answers in a more quantitative way, which you can use for further analysis, such as follow-up emails in your current campaign.
When you comprehend these metrics, it will be far easier to make sense of the multiple answers you receive. So go ahead and use multiple-selection questions. They render a deeper read of your target market and allow you to explore more concepts while using less real estate in your survey (meaning fewer questions).
This makes the questionnaire adept for a mobile-first survey design.

Build Your Ideal Survey with Survey Templates
Build Your Ideal Survey with Survey Templates

There are myriads of ways to construct your survey campaign and its corresponding surveys. While it is wonderful to use an online survey platform with so many survey capabilities, it can also be overwhelming to decide on and create the proper survey.
The new Survey Templates feature from Pollfish changes that.
Whether you’re stumped on deciding on the proper survey to use, or you don’t know how to begin creating it, the new Survey Template feature is here to assist you, easing the survey creation process and bringing you closer to agile data.
You can choose from a batch of 17 survey templates, which touch on different campaign categories to help you gain insights for any business campaign, from branding to product and more. Researchers can now schedule templated surveys to launch as either single-use or as reoccurring trackers.
This new feature enhances and simplifies the survey process, so that you can focus your time on what matters most, whether it is ideating campaign ideas, analyzing the survey data or working on other projects.
This article explains the new Survey Templates feature, so that you can optimize your survey development process immediately.
Understanding Survey Templates
Survey Templates is the latest feature from Pollfish, allowing researchers to create surveys with the aid of 15 survey templates. These templates are categorized by both general business campaigns and survey campaign types.
From general advertising and branding campaign survey templates, to hyper-focused logo testing and two kinds of Net Promoter Score (NPS) survey templates, there are templates for virtually every department.
Our survey templates are not solely for market research; you can use them to gain feedback from your site visitors and your own team. This is because we offer the website feedback survey template to examine your site users, along with various employee survey templates.
We also offer the event evaluation survey template to help you understand your event marketing efforts. Moreover, aside from the business world, our surveys can be used in the realm of education, as we offer a template for evaluating university instructors.
The Survey Templates feature offers all the flexibility as every other interface in our dashboard. That’s because when you select a template, the platform allows you to edit, add and remove anything you’d like, much like our predefined answers and other functions.
As such, you’re not rigidly tied to any question, answer, order of questions and other functionalities. You are completely free to customize your template as you wish, whether it involves editing the question and answer wording, reordering the questions, adding new ones, or deleting certain items and all else.
In short, you are in full control of the design and setup of your survey with these templates. They are simply there to help you gain survey ideas and put together your survey to save you time.
The Categories of Survey Templates
Presently, this feature offers five categories of survey templates. These help you organize your templates and stay on track. Each category offers different templates; there may be some overlap, as some templates can be used across different campaigns and purposes.
The following lists the 5 categories of survey templates we currently feature:
- Brand feedback
- Product feedback
- Customer feedback
- Employee feedback
- Generic
- These include surveys for educational settings and miscellaneous survey types.
There is also the parent category option of “templates,” which displays all the survey template categories when you select it.
Various categories include the specialized survey type of A/B testing and the NPS survey. This is because these surveys are versatile (as are many others) and can be applied to different campaigns.
The Survey Templates and Their Applications
As aforementioned, you can use this feature for various campaigns. Some templates are generic, while others are laser-focused. You can tailor each one to your favor and to your specific needs. Or, you can simply use the questions and answers that are included and preset.

The following lays out all of our survey templates, with specific attributes, use cases, campaigns/ applications and examples of corresponding surveys:
- Brand Awareness
- Purpose: Branding, brand visibility, recognition
- Campaign(s): Measuring awareness, comparing brand equity, raising awareness
- Survey example(s): brand equity survey, brand awareness survey
- Brand Perceptions
- Purpose: Branding, brand trust, brand opinions and sentiments
- Campaign(s): Measuring brand trust, building a brand advocate
- Survey example(s): brand tracking survey, brand perception survey, brand trust survey
- Advertising Testing
- Purpose: Advertising market research, Ad concept testing
- Campaign(s): Advertising, comparing ads, measuring emotional responses to ads
- Survey example(s): ad testing survey, concept testing survey, A/B testing survey
- Logo Testing
- Purpose: Branding, design, imagery assurance
- Campaign(s): Determining a logo, finding the proper images for different needs
- Survey example(s):
- Product Concept Testing
- Purpose: Concept testing,
- Campaign(s): Product campaigns, customer development, in-home use test
- Survey example(s): concept testing survey, A/B testing survey
- Customer Satisfaction Survey (NPS)
- Purpose: Customer satisfaction, customer feedback
- Campaign(s): Measuring customer satisfaction, minimizing customer effort
- Survey example(s): NPS survey, customer satisfaction survey, CSAT survey (Customer Satisfaction Score), CES survey (Customer Effort Score)
- Customer Loyalty & Relationship NPS
- Purpose: Consumer loyalty, brand trust, CLV,
- Campaign(s): Measuring customer loyalty, increasing loyalty, increasing brand advocacy, increasing and measuring customer lifetime value (CLV), building brand trust, driving repeat purchases
- Survey example(s): NPS survey, customer loyalty survey
- Employee Satisfaction
- Purpose: Employee feedback, employee satisfaction
- Campaign(s): Measuring employee satisfaction, finding what makes employees happy, finding ways to boost employee morale, improving employee performance
- Survey example(s): employee feedback survey, employee satisfaction survey, eNPS survey (Employee Net Promoter Score)
- Employee Engagement
- Purpose: Employee feedback, employee engagement
- Campaign(s): Measuring employee engagement, discovering employee preferences, discovering how to make employees more engaged, improving morale
- Survey example(s): employee feedback survey, employee recognition survey, employee burnout survey
- University Instructor Evaluation Template
- Purpose: University instructor feedback, curriculum feedback, opinions on teaching style
- Campaign(s): Assessing a professor/instructor’s teaching style, opining about the curriculum, measuring fairness of grading
- Survey example(s): Professor/Instructor feedback survey, college survey, university survey
- General Event Feedback
- Purpose: Event evaluation, event headcounts
- Campaign(s): assessing events, event performance, discovering issues with events, preparing for future events
- Survey example(s): event evaluation survey, event survey
- Website Feedback
- Purpose: Event evaluation, event headcounts
- Campaign(s): Understanding digital UX, measuring usability, understanding digital customer journeys, finding glitches
- Survey example(s): website feedback survey, UX survey, customer journey survey, user testing survey, customer experience survey
- Purchase Feedback
- Purpose: Buying experience, purchase touchpoint optimization
- Campaign(s): to understand customer buying behavior, foster repeat purchases, optimize buying touchpoints
- Survey example(s): product satisfaction survey, customer journey survey, post-purchase survey
- Return to Work
- Purpose: Employee feedback, return to work opinions
- Campaign(s): to compare working remotely with in-office work, to gain insights on improving in-office work, to understand why employees don’t want to return to the office
- Survey example(s): employee feedback survey, employee satisfaction survey, return to a workplace survey
- Remote Working
- Purpose: Employee feedback, rating remote working
- Campaign(s): to compare working remotely with in-office work, to gain insights on improving remote work, to understand why employees don’t want to return to the office, to assess comfort levels of possible hybrid or in-office working models
- Survey example(s): employee feedback survey, employee satisfaction survey, remote working survey
- Brand Diagnostic
- Purpose: Brand feedback
- Campaign(s): to obtain a comprehensive brand health assessment with key drivers of brand performance, compare prospects’ conversion through the funnel and compare it with other brands, to understand the reasons why prospects drop out at each stage in the funnel
- Survey example(s): brand tracking survey, brand reputation survey, brand health survey, brand equity survey, brand perception survey, brand trust survey
- Product Naming
- Purpose: Product feedback, brand feedback, customer feedback
- Campaign(s): to test your product name ideas with customers to understand how they affect their perceptions and likelihood of buying before you launch a new product, which includes finding the name of a new product, finding the name to an existing product and uncovering what comes to mind when respondents see certain names.
- Survey example(s): concept testing survey, A/B testing survey
How to Create and Use Survey Templates
It’s easy and intuitive to create and use survey templates on the Pollfish dashboard. All the templates are on one page, which you can filter based on categories. The search field also allows you to find exactly what you’re looking for without browsing through categories, if this is your preferred method of finding the correct survey template.
The following explains how to create and use survey templates in a step-by-step way:
- To begin your templated survey, click on the “Create Project” button on the top right of your dashboard
- Select “From Template” in the drop-down menu.
- Under each template, you have the option to click on the Preview button to see the questionnaire and a small description on the most opportune reason to use it.
- Once you find the template you’d like to use, click on the “Use this template” button on the bottom left panel.
- Then, type in the title of your survey.
- Select whether you want to buy responses from the Pollfish Audience Network or send the survey to your own list of respondents.
- Edit your survey template to your liking and needs.
- Run your survey as you normally would.
Forming the Most Ideal Surveys
The new Survey Templates feature allows you to set up a preset survey for various occasions, purposes and campaigns. It is just one way in which the Pollfish online survey platform is the most powerful on the make research tools market.
You need to use a strong online survey platform to easily create and deploy surveys to your target market, along with specific individuals.
You should use a mobile-first platform since mobile dominates the digital space and no one wants to take surveys in a mobile environment that’s not adept for mobile devices.
Your online survey platform should also offer artificial intelligence and machine learning to remove low-quality data, disqualify low-quality data and offer a broad range of survey and question types.
The survey platform should offer advanced skip logic to route respondents to relevant follow-up questions based on their previous answers.
Additionally, it should also allow you to survey anyone. As such, you’ll need a platform with a reach to millions of consumers, along with one that offers the Distribution Link feature. This feature will allow you to send your survey to specific respondents, instead of only deploying them across a vast network.
With an online survey platform with all of these capabilities, you’ll be able to form surveys for any campaign swiftly and efficiently.
Incorporating the Translate Survey Feature into Your Surveys
Incorporating the Translate Survey Feature into Your Surveys
![]()
![]()
With this feature, you can translate a survey that you already conducted in English (or other languages) into your target languages. This new feature allows you to translate surveys that are either underway (running but not complete) or have already been completed.
It will enable researchers to build, store, and view their survey results in different languages as a means to help their analysts across geographical regions.
This Pollfish School article will teach you the aspects of this new feature, along with the steps required to activate it.
Key Aspects of the Translate Survey Feature
As its name implies, the “Translate Survey” feature translates surveys into other languages. This is especially useful for businesses and organizations that need to share survey research across countries.
There are several capabilities that Translate Surveys offers, along with certain characteristics that this feature does not support. The following provides an in-depth account of what the Translate feature supports and does not.
What Translate Surveys supports:
- Elite accounts
- Translations from Google Translate
- Supports ALL the languages of Google Translate — 109 languages in total!
- There is no limit in how many translations you can add per survey.
- Surveys that are currently running or have reached the preset amount of completes.
- Exports of results as a PDF, Crosstab, Excel sheet or SPSS.
- Results are updated in real-time.
- Can be used in BigQuery if integrated with this PaaS.
- Researchers can add their own translations manually if they prefer in on both questions and answers in editing mode.
- Can view each edition of the translated survey via the dropdown of translated languages within the survey’s dashboard.
- Can translate a question that contains a recall of a previous question’s answer(s).
- Can translate a question with Carry Forwarded answers.
What Translate Surveys does NOT support:
- Basic accounts
- Translations of the drafts
- Canceled or failed surveys
How to Incorporate & Use the Translate Surveys Feature

Now that you know the attributes and limitations of the new Translate Survey tool, let’s get acquainted with using it. The following provides step-by-step instructions on how to incorporate the feature in your surveys and how to use them.
To Activate the Translate Surveys Feature:
- In the Pollfish dashboard, go to “All” and find the survey you’d like to apply the Translate Surveys feature to.
- Click on the general dropdown menu of your designated survey (activated by clicking on the three dots beside it).
- Select Translate Survey. This will open up the survey.
- On the right-hand side in the middle of the screen, select the language you would like to translate the survey to by typing it into the field.
- All languages that begin with the letters you typed in will appear as options.
- You can now translate the questions and multiple choice answers in a twofold way:
- By typing in the questions/answers in their corresponding fields manually in the selected language OR
- By clicking on the upper right button called Google Translate, in which Google will provide the translations.
- If you need to add more languages to translate the survey, click on the + in the box on the right side, adjacent to the box above with the first language you chose to translate the survey to.
- Click “save translation” to save the added translations to your survey.
To find the translated results and make exports:
- Go to the Pollfish dashboard and find the survey on which you applied the Translate Surveys feature.
- Hit the three-dot button and select “See Results,” which will trigger a new tab with the results of the survey, translated in the language(s) you selected.
- The top-left box will feature a dropdown with the languages you used with the new Translate Survey feature. Select the language you would like to view your survey in.
- Scroll to the bottom of each question to select the buttons to view the results as a bar graph or pie chart.
- At the top right-hand corner, click on “Export Results.” This will prompt a pop-up in which you can choose the language of the survey you need to download, along with the kind of export you need.
Other Considerations for the Translate Surveys Feature
There are a few other considerations to take note of, including expanding on some of the topics aforementioned.
First off, you can export the surveys to Big Query — only in their translated views. As a side note, after concluding the Translate Surveys process, a three-letter code will appear in the upper left corner of the translated survey in the dashboard.
Although this feature won’t translate the drafts it can be used as an internal tool in the dashboard, one that allows you to create layers on their surveys in other languages.


How to Use the New Carry Forward Feature for an Enhanced Survey Experience
How to Use the New Carry Forward Feature for an Enhanced Survey Experience

As the heart of any survey, the questionnaire must be contrived carefully so that you receive the responses most necessary for your survey research. Creating the questions themselves can be difficult, especially if you choose to create question paths.
Pollfish is thus thrilled to present a new feature to make building the questions a much easier task: Carry Forward. This new attribute provides advanced piping capabilities to optimize your questionnaire experience.
The Purpose of the Carry Forward Feature
As a refresher, piping is a functionality that allows users to place, aka, “pipe,” a part of a question or answer into a subsequent question or answer.
In the Pollfish platform, piping works by taking the answer(s) from the sender question and inserting them to the receiver question.
In the first piping iteration, researchers were able to funnel answer choices from one question to another based on respondents’ selections. The following question would carry forward answers from previously piped answers.
The new Carry Forward feature carries (no pun intended) the function of enriching the question-building experience, as it allows you to pipe questions on more question and answer types, along with other capabilities.
This new feature helps researchers design specific questions that are more relevant to the respondent’s behavior, and more useful to their research.
It functions on both selected and unselected answers. It also can be used with:
- Matrix questions
- Ranking questions
- Single selection questions
- Multiple selection questions
Laying Out the Carry Forward Capabilities
Multiple Selection Questions
Along with carrying forward selected answers, this feature allows researchers to carry forward all the answers that the respondent did not select.
In the case of a multiple selection question, for example, the feature can carry forward the unselected answers into the receiver question.
Due to this, when a responder selects all the answers and proceeds, there will be no answer to carry forward, as there are no remaining unselected answers. For this precise reason, the Pollfish platform has developed a validation which exists as a dialogue box.
This pop-up allows the researcher to know that the Carry Forward feature cannot support this case, as it only works if at least one answer is unselected. This is due to the condition that unselected answers cannot be carried forward if all the answers have been selected.
Advanced Logic
This can be used in tandem with advanced logic, allowing you to augment your survey with multiple layers.
Enabling advanced logic (ADL) can trigger questions without forwarded answers. For example, when Carry Forward is enabled but a respondent skipped the sender question, the respondent will then be routed to a question without Carry Forward answers
Pollfish has also added front end validation that disables the researchers from proceeding with the previous structure.
Sender questions with either the “None of the above” or “Other” option must be structured correctly, that is, with multiple selection questions. If these aren’t added to the proper question, there will be pop-up error messages.
Carry Forward Answers that Contain Media
If the Carry Forward answer type is the same or similar to the source (question) type, such as:
- single to single,
- multiple to multiple,
- single to multiple, etc.,
then the platform will carry forward the media files together with the answers.
In other cases, such as different types between sender & receiver questions, there are certain conditions and rules that dictate how Carry Forward will work.
How to maneuver Carry Forward answers which contain media:
- If the Carry Forward answer type is the same or similar (single, multiple) to the source type ? the media will be carried forward.
- If the Carry Forward answer type doesn’t support media then:
- The text will be carried forward if the source answer contains both text and media.
- Carry Forward will not be supported if the source answer contains only media.
How to Add Carry Forward to Your Questionnaire
In order to add the Carry Forward feature, you’ll need to enter the questionnaire portion of the survey first (after completing the audience section). You’ll also need to have your questions and answers in mind.
You can add Carry Forward when you begin the questionnaire, as you’ll need at least two questions to use this feature, the sender and receiver question. You can also implement it to an existing questionnaire.
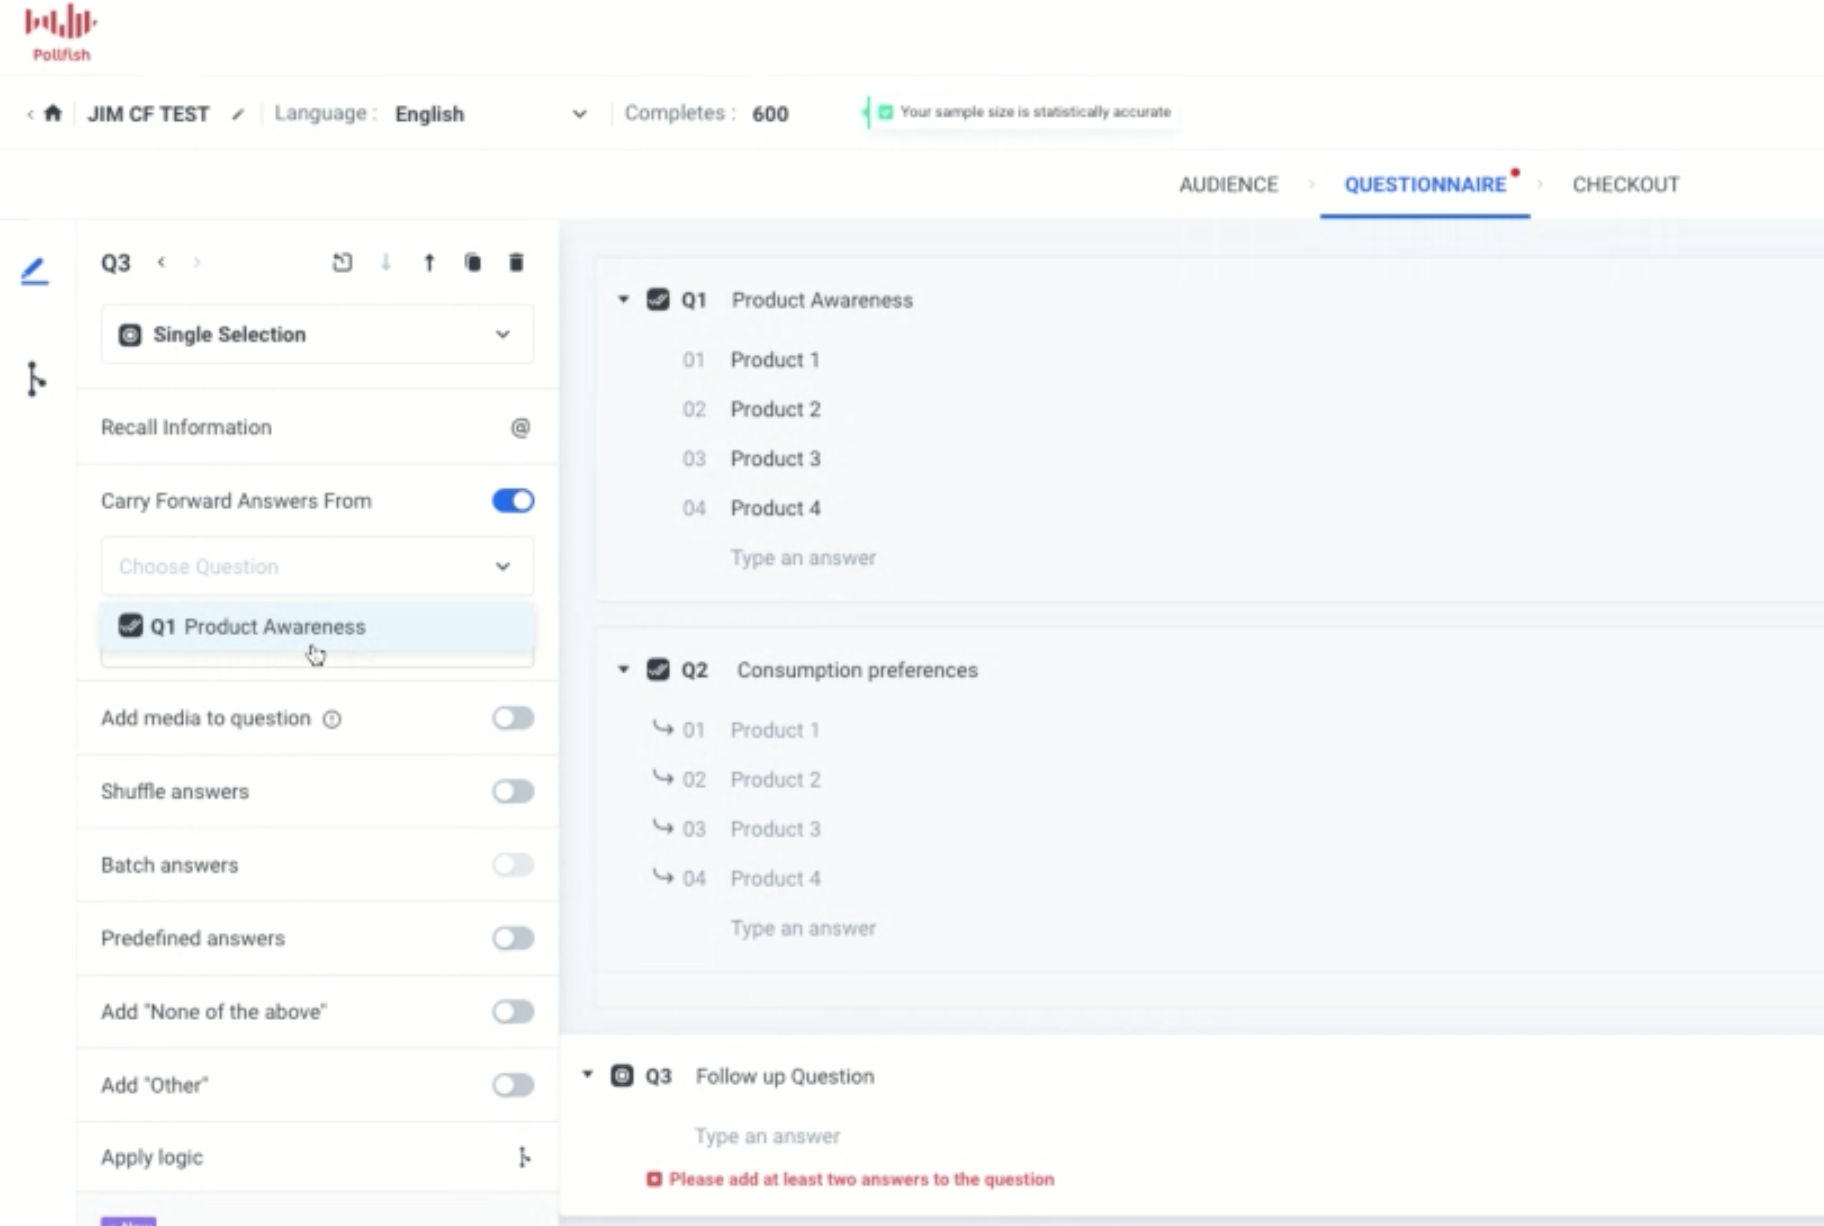
- Find the Carry Forward option at the left panel of the questionnaire.
- Find a sender and a receiver question you wish to apply the CF feature to. This can be in any order. For example, you can use Question 1 as the sender question and Question 2 as the receiver question.
- Enable this via the receiver question and select “Carry Forward” and then the selected or unselected answers from a previous question (the sender question).
What Carry Forward Supports Vs. What It Does Not Support
There are certain conditions that need to be met in order to apply the Carry Forward function. There are certain circumstances in which your questions will not be able to implement Carry Forward.
What it supports:
- Carry Forward can be used with single/ multiple/ ranking/ matrix questions when they are designed as receiver questions.
- When you carry forward a matrix question, there’s an additional option to narrow the choices based on selected columns, unselected columns, rows for selected columns, rows for unselected columns, and columns for specific rows.
- It is supported by single, multiple, open-ended, numeric, ranking, matrix, slider and OE when they are set up as sender questions.
- The researcher can carry forward all the questions that the respondent didn’t select.
- There is simultaneous support of advanced logic and Carry Forward.
- It supports Order/ Shuffle answers for funneling questions.
What it doesn’t support:
- Carry Forward cannot be used with description questions, Net Promoter Score (NPS) surveys and visual ratings surveys.
- It does not support screening questions and therefore cannot be used in them.
- It does not support the option of “Group and Randomize.”
Note: Closing off, you should know that responses that are carried forward will be treated the same as other answer choices on the results page.
We suggest you preview your survey design before submitting the survey itself. Try it out!

Incorporating Multiple Audiences into Your Survey
Incorporating Multiple Audiences into Your Survey

Have you ever needed to create multiple audiences under one sampling pool for your survey research? Now you can, with the new Multiple Audience feature in the Pollfish dashboard.
This feature creates a hyper-targeted audience landscape, allowing you to select various demographics, mobile usage and geolocation criteria — for multiple audience groups. Previously, the platform allowed researchers to select these criteria, but for one audience group only.
The Purpose of the Multiple Audience Feature
With this new feature, you will be able to create separate audiences in one survey and achieve any targeting combination you desire.
Essentially, the feature allows you to apply quotas within the quotas and conditions within conditions. You can also use minimum quotas, in which only a percentage of an audience gets assigned a quota (which you select), while the rest does not and will therefore receive random response types.
This will allow you to achieve a hyper-granular approach to targeting your sampling pool, aka, the survey respondent audience.
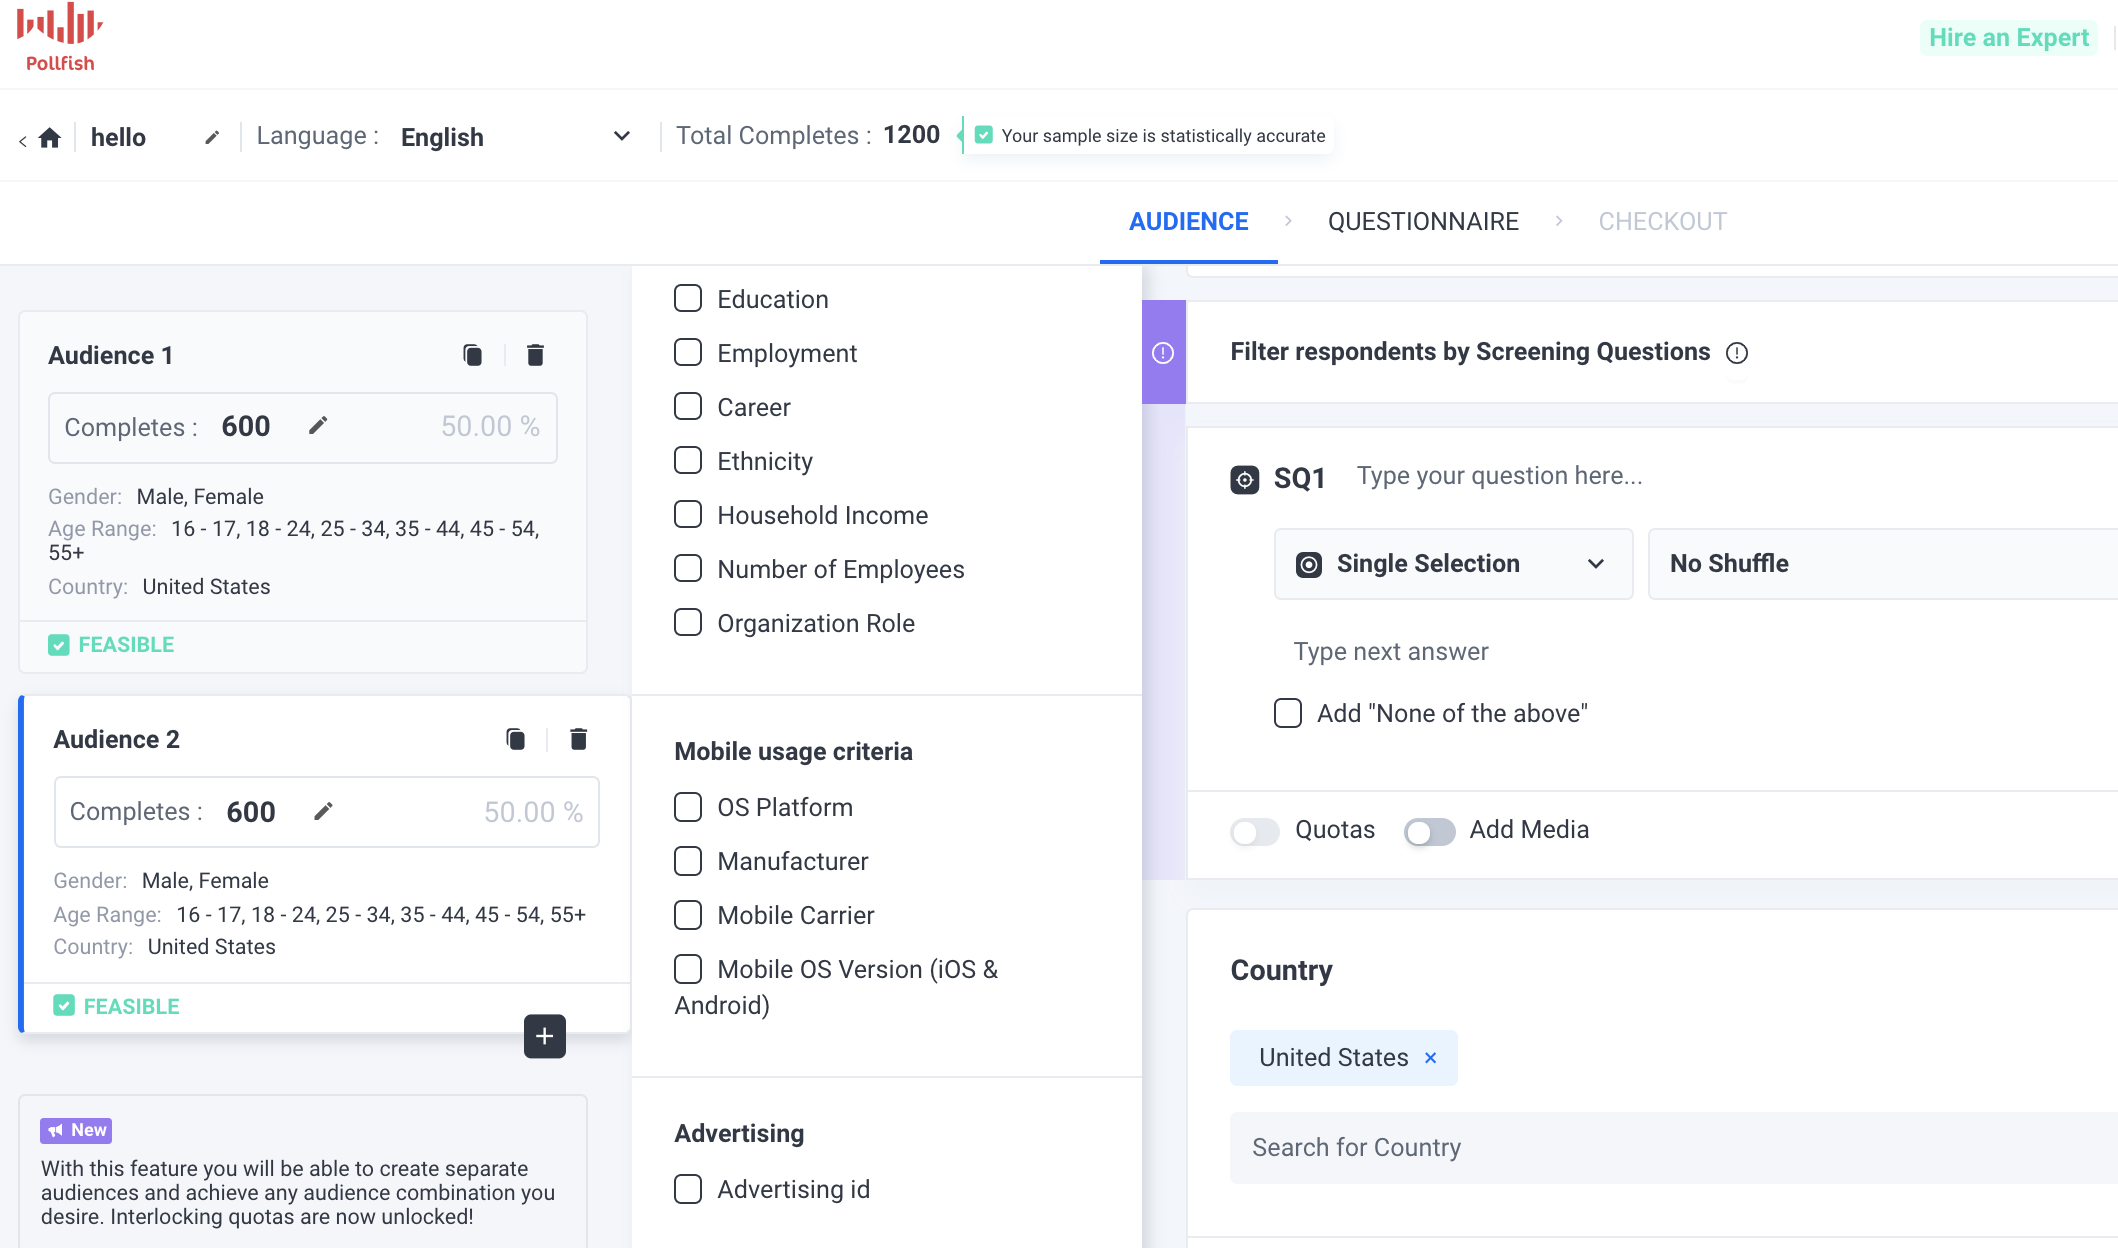
Laying Out the Components of the Multiples Audience Feature
The feature includes separate audience blocks that can be customized as you so choose. Each block represents an audience group, i.e., Audience 1, Audience 2, etc. There is no limit to the number of audience blocks you can create, so long as they don’t exceed the total amount of survey completes.
The blocks also present a wide variety of audience category selections. As with the previous single-audience capability, this one allows you to create quotas for each type of demographic, geolocation and mobile usage selection, along with a maximum of 3 screening questions. This is known as layered demographics conditions, which are also called interlocking quotas.
Prior to the update, researchers were able to apply separate quotas to each targeting variable (non-interlocking quotas, or overlapping quotas). For example: in a sample pool of 1,000 respondents, the requirements may be: 500 (50%) men and 500 (50%) women, 500 (50%) young people and 500 (50%) older people. In this instance of non-interlocking quotas, you risk a pool of 500 young men and 500 older women.
Interlocking quotas can avoid this, in which a quota is defined by more than one variable. The interlocking percentage involves multiple variables, for example, household income, gender and age.
In reference to the aforesaid example, you can define a target size for each combination of variables. That means you can mandate 250 young men (50% x 50%) 250 young women, 250 older men and 250 older women. This assures that not only will you get respondents of every variable, but that they are collected evenly (if you so choose with your assigned quotas).
Each audience, regardless of how different will have the same language, as they are each part of one survey, i.e., one sampling pool.
The Pollfish platform will calculate the CPI and feasibility of the survey by taking into account all the conditions of each audience.
How to Create Multiple Audiences
To create multiple audiences and use their various features, follow these steps. Keep in mind that, while they give complete direction in using all the new feature’s functionalities, your survey may go in a different direction. As such, you may not have to follow all the steps enumerated below if you don’t need certain functions and additions.
- Create a new survey.
- You will be taken to the “audience” interface.
- Begin by choosing the number of completes — the maximum number of respondents in the first audience.
- The total completes on the top left will reflect how much completes you have by adding up the completes in each audience block.
- Start with the age and gender criteria. Select the subcategories your survey is targeting. Add quotas to each subcategory (male or female, or within the age ranges).
- Next, move onto the screening questions portion and add three questions that pertain most to your survey (a maximum of 3 per survey, meaning a maximum of 3 no matter how many audiences you add).
- Decide which criteria to use for this particular audience, as you can choose various subcategories under demographics, geolocation, mobile usage and even advertising ID.
- By enabling this criterion, all responses of the survey will be accompanied by the respondent’s advertising ID (in an Excel sheet export).
- Once you decide which criteria to use, apply quotas. You may add more or less completes to Audience 1, just make sure you don’t use up the total completes.
- After setting up your first audience, click on the + icon on the bottom of the Audience 1 block.
- This will open up a new audience group, aka, block.
- Follow steps 2-6 for your next audience selections.
- Follow step 7 should you wish to add more audiences.
- Review the entire audience section. Check the total completes to ensure you’re going to enlist the correct amount or respondents in the platform.
- Also, make sure the audience blocks are all feasible.
- If a block is not feasible, adjust the targeting design of the audience related to a ''not feasible'' estimation to make it feasible. You can expand the targeting, remove quotas or filters.
- You’re all set with Multiple Audiences and the audience section at large; you can now move on to the questionnaire.
This new feature will allow you to hyper-target your survey to befit a wide variety of segments in your target market, or any of your subject of interest.

How to schedule surveys in Pollfish
How to schedule surveys in Pollfish
Sometimes it’s not always convenient to launch your survey—either it’s not in your target audience’s time zone at launch, or perhaps you’re away from your computer. With survey scheduling in Pollfish, you can automate the process and send surveys at your convenience.

Benefits of scheduling surveys
The benefit of scheduling surveys is that you can set them to run anytime, on your own schedule. Whether you’re about to leave town for vacation or want to be prepared for work the next day, a scheduling feature can automate the sending of your survey for a time that works best for you or your target audience.
When scheduling your survey, you can also select whether or not you want to add additional responses to your survey on a recurring basis for continual monitoring. For example, if you wanted to measure the impact of a quarterly campaign, you could schedule the same survey to run at two different dates with sufficient time for you to gather data needed to measure your impact on brand awareness or ad effectiveness. Other times, a recurring survey can validate actions you already have in place, ensuring that you’re still on the right course.
What to keep in mind when scheduling surveys
Be ready 2+ hours ahead.
When surveys are scheduled, they launch automatically at the set date and time. This means all audience targeting and questions in your questionnaire must be finalized before selecting the scheduled time. The minimum amount of time for selecting scheduled surveys is 2 hours before the survey launches.
Targeting cannot be changed on scheduled surveys.
Once your survey is scheduled, your targeting is set and cannot be changed. For surveys that have multiple occurrences, the same targeting will be used and the same number of responses added to your existing survey. If targeting needs to be changed in a scheduled survey, that survey must be canceled and a new one created.
This can easily be done in your dashboard by duplicating an existing survey and making the manual changes needed before rescheduling the launch.
The survey's completion status has no impact on future scheduled additional responses. For example, if a survey was scheduled for 3x occurrences with 2000 responses added each time and only 1000 are complete by the scheduled date of the next round, 2000 additional responses would be automatically added regardless of how far the survey has progressed.
Timezones and frequency are in your control.
Scheduled surveys allow you to select the time, timezone, and frequency of your survey’s launch. This can be a one-time scheduling or it can be set up for daily, weekly, quarterly or custom occurrences to add more respondents and track changes in target audience attitudes and behaviors over time.
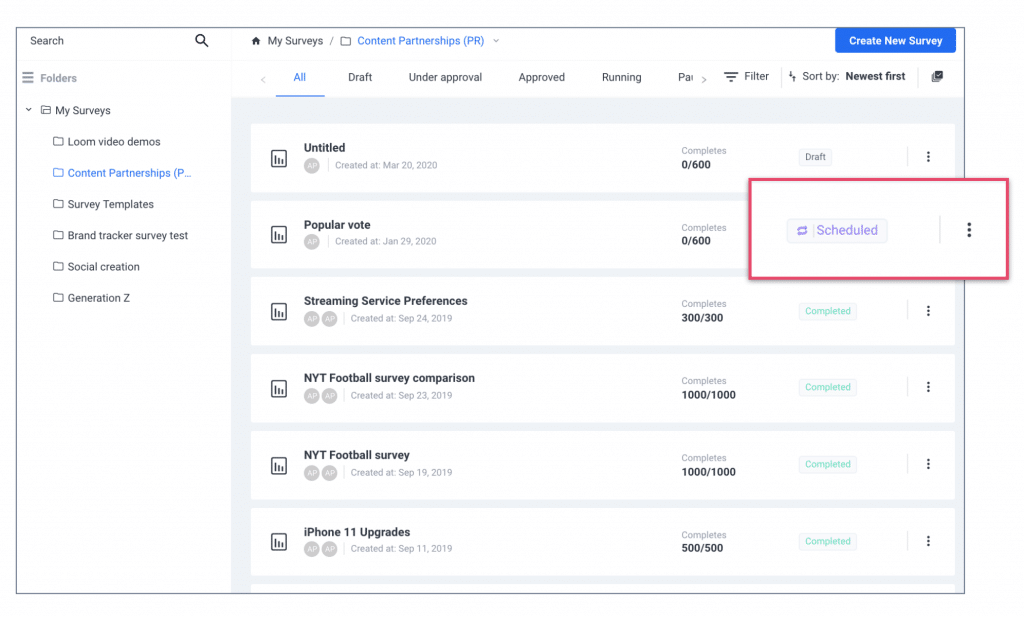
Billing occurs on a rolling basis.
A scheduled survey appears in your dashboard under the status of “scheduled” once it has been approved. Payment will not be collected until the survey launches to ensure all billing information is accurate and up-to-date. Each scheduled occurrence of a survey will be billed separately at the time that additional responses are added.
This also gives you the opportunity to cancel and reschedule surveys as needed up until 2 hours prior to launch at no cost to you. There is no additional charge for choosing to schedule a survey or penalty for canceling one.
How to schedule a survey
Survey scheduling is offered as an option when you check out. This means your audience targeting and questionnaire must be selected and finalized when you get to the checkout page to be approved. Targeting cannot be edited in scheduled surveys, so be sure to select the right audience prior to launch.
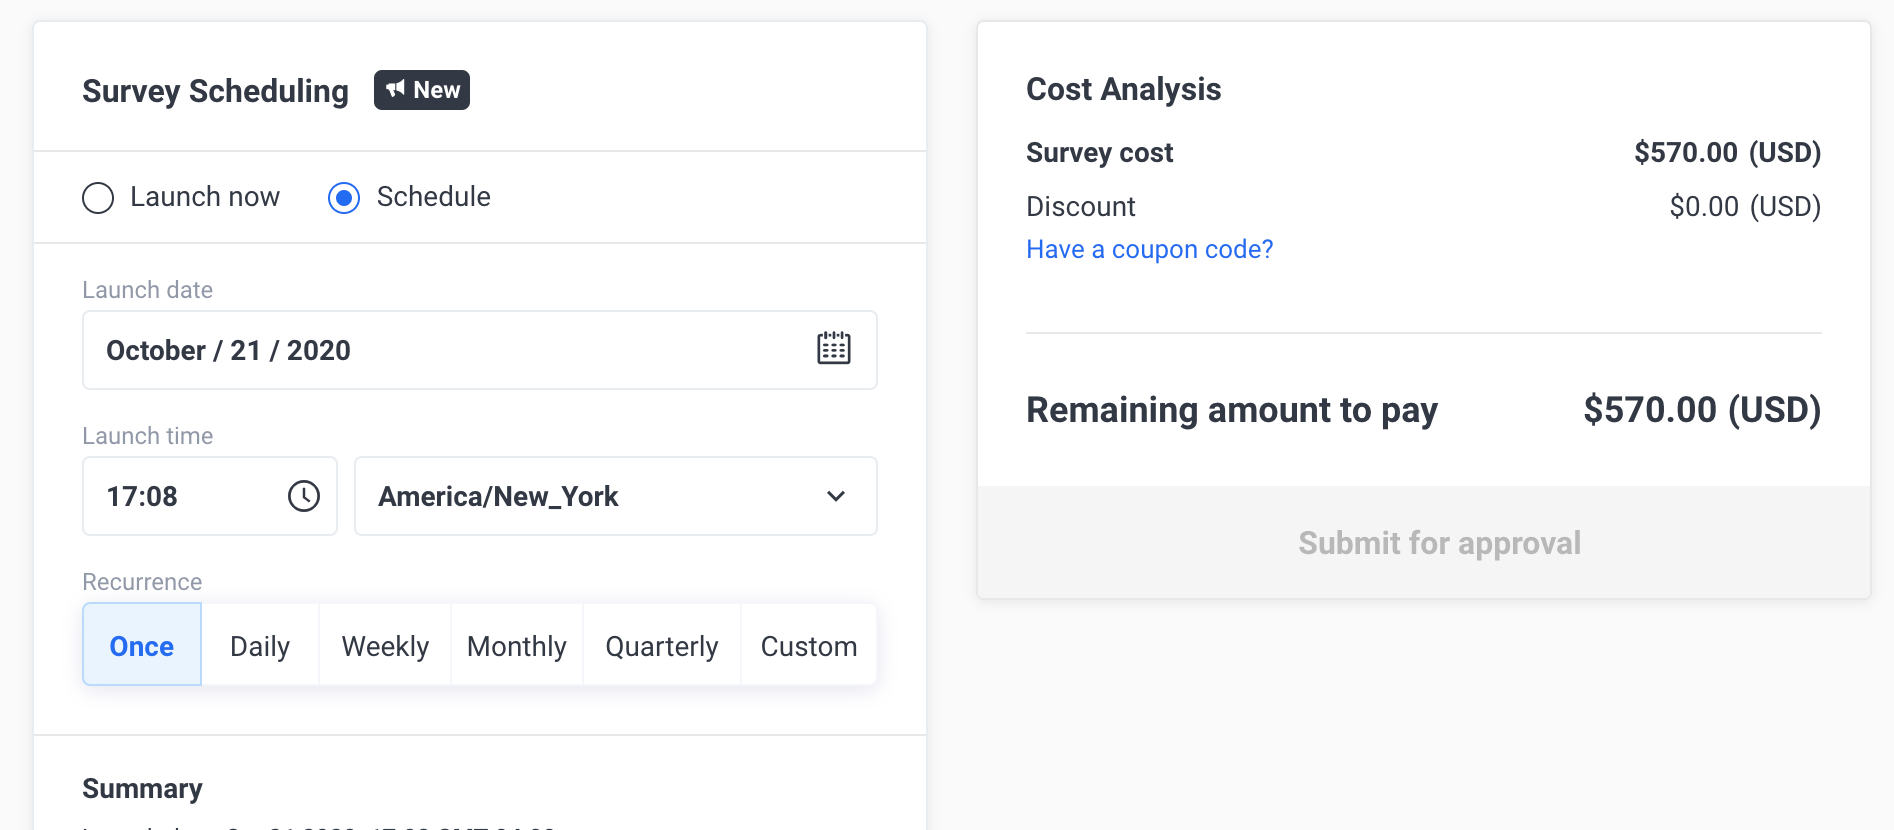
You can also select the number of times you want to run the survey, the dates and times in which you want to launch it, and the timezone you want it to launch in. The number of responses you have selected for your original survey will be added on the scheduled date for each occurrence. All of these can be selected in your checkout option.

How To Export Survey Data With Pollfish (And What To Do With It)
How To Export Survey Data With Pollfish (And What To Do With It)

It may sound like a cliche coming from a consumer data company, but data is powerful.
It is so powerful, in fact, that one single survey can touch every corner of an organization. By building smart questionnaires, carefully choosing targeting options and exporting and slicing data, brands can create internal messaging, build dynamic content, remake company strategy, build new products and much more.
To get the most out of your next survey, understanding your data export options is a great place to start.
What Are Export Options?
When you create a survey with Pollfish, you can download your results as four different report types. These reports present your data in radically different ways, and allow the various teams within your company to inject data into everything from interactive infographic to complex statistical analyses.
What Report Types Does Pollfish Offer?

What is a PDF?
PDF stands for Portable Document Format. A PDF is a file format developed by Adobe in the 1990s to present documents, including text formatting and images, in a manner independent of application software, hardware, and operating systems. Basically, instead of your document adopting the settings of the application you are saving the document to, PDFs stay true to how you saved them originally, similar to how a screenshot might behave.
What can I do with it?
The Pollfish PDF report offers a convenient, visually appealing document that can be shared with stakeholders, added to reports and saved as reference docs. The layout of the Pollfish PDF is similar to that of a PowerPoint presentation.
Excel Spreadsheet

What is an Excel Spreadsheet?
Microsoft’s spreadsheet platform should be instantly recognizable to anyone working in a modern business environment.
What can I do with it?
With an Excel spreadsheet export from Pollfish, you will have full access to all results from your Pollfish survey inside the data management platform you know best. Add pivot tables, graphs, use functions to get deeper insights--anything your Excel mastermind can dream up.
The report layout helps you access the right data more quickly, separating out the full list of respondents, as well as individual spreadsheets for each question, delivered in the familiar tab layout of Excel.
Lastly, once you have created your perfect data set, adding your data to Google Sheets allows you access to a great number of API and data delivery tools for use in websites, interactive infographics and more.
Crosstabs Report

What is a Crosstabs Report?
For a full guide to using your Crosstabs report, the Pollfish Resources Center can help. That article offers this definition:
Crosstabs are a matrix-style format for data visualization and are one of the most useful and common ways that market researchers analyze data. Pollfish offers cross tabs as an excel export for easy synthesis outside of the platform.
What can I do with it?
Crosstabs reports allow you to dig into individual insights and slice the data different ways, opening the door to different consumer insights that wouldn’t be readily available from the initial results.
For example, let’s say you conducted a survey of Android users interested in switching to an iPhone. With Crosstabs, you could see what percentage of women Android users surveyed were interested in switching. You could also see, of those interested in switching, what percentage were women.
So in our data, let’s say we find that only 13% of women Android users are interested in switching. We also find that, of those interested in switching, 58% are women. So while it may seem Android’s female fanbase is pretty loyal, you can also see that women are more open to switching in this survey than men.
As you can see, Crosstabs can be used to slice data in different directions to gain additional context on data, and build deeper, more compelling insights.
SPSS Report

What is an SPSS Report?
SPSS stands for Statistical Package for the Social Sciences. The acronym refers not to the type of data being exported, but to a set of software programs combined in a single package. When data is formatted for this package, it allows you to add your Pollfish results to various kinds of complex data analyses.
What can I do with it?
SPSS is very good at combining varied, complex data sets. Researchers use it to make connections, find correlations and quickly graph results from multiple data exports at once.
SPSS has several tools for analyzing data to make predictions and spot patterns, increasing it’s usefulness for brands and marketers looking for trends in buying behavior or trying to vet the viability of a new product or service.
How To Export Data With Pollfish
Step 1: Complete Your Survey
Once you have chosen your targeting, questionnaire and screening/quota configuration, checkout and run your survey. Once your results are complete, you will be able to export your data.
Step 2: Visit The Results Page
Even before exporting your data report, there is plenty you can do right on the Pollfish results dashboard. Check out the different features, slice your data by using the demographic and psychographic checkboxes to the left. Watch your results update as you go. Once you have gotten a few reports where you want them, check out the visualization options available on each question. These will allow you to instantly create graphs and charts to display your data one question at a time.
Step 3: Export Your Report
From your results dashboard, find the button marked Export Results in the top right corner underneath the Credits Counter. When you click this button, a pop-up should appear allowing you to choose your preferred report and download.
A Few Things To Remember…
- Post-Stratification data is not currently available in the PDF export format.
- Crosstabs reports come with multiple views, not just the one that appears in the first tab. Make sure you scroll through all tabs to see the different ways you can slice your data.