
How To Conduct A Survey That You Can Trust In 8 Steps
How To Conduct A Survey That You Can Trust In 8 Steps

So you want to conduct a survey, not any run-of-the-mill survey, but one that you can trust, that is, one that quickly gathers the total number of survey respondents you selected — with the correct demographic and psychographic traits.
To do so, you’ll need to be able to preset these requirements in an online survey platform.
You’ll first need to find a potent online survey platform, along with understanding how to conduct a survey that provides accurate and reliable data on your target market.
While building a strong survey campaign can appear to be difficult, if not downright intimidating, it is much simpler than it looks. This simplicity will depend on the survey platform you choose, as they are not all the same.
Nonetheless, there’s a process to conduct a survey that you can use across multiple campaigns, whether you need to conduct local or global surveys, study customer behavior, or even increase your customer retention rate.
Luckily, we’ve prepared an easy-to-follow, 8-step process for conducting surveys. This article is an 8-step guide to help you to design, conduct, and organize an effective survey in no time. Let’s dive in.
Table of Contents: How To Conduct A Survey That You Can Trust In 8 Steps
- The Importance of Conducting Surveys
- What You Need to Conduct a Survey
- Steps to Conduct a Survey
- Step 1: Identify Your Research Goal
- Step 2: Define Your Survey Audience
- Step 3: Come up with Preliminary Questions
- Step 4: Design Your Questionnaire
- Step 5: Distribute Your Survey
- Step 6: Organize Survey Responses
- Step 7. Analyze and Present Survey Results
- Step 8: Take Action
- Making Every Survey Count
The Importance of Conducting Surveys
First off, let’s uncover why you should conduct a survey in the first place. After all, there are a variety of other market research techniques you can use, including both primary and secondary research methods.
One of the most important reasons to conduct survey research is due to the prowess of surveys; they grant you original hard data and facts. You can use surveys to study virtually any subject and gain both quantitative and qualitative insights.
Data, especially customer data, is becoming more and more sought after, as 40% of organizations aim to increase data-driven marketing budgets, and 64% of marketing leaders believe that data-driven strategies are vital in today’s economy. Surveys act as a convenient conduit to gain access to any sort of data, whether it is consumer-related or otherwise.
Conducting surveys on your customers is one of the most effective ways to collect invaluable data and gain answers to concerns that are important to you. This is core to market research, as it allows you to better understand those most likely to buy from you, aka, your target market.
So how can you use surveys as a means of data for decision-making? There are numerous campaigns and insights that surveys can avail and unlock.
Surveys let you uncover hidden growth opportunities, reveal public sentiment, gain deep insights into customer buying behavior, and even get extra media coverage when prominent publications cite the findings of your research.
They also prevent you from making the wrong business decisions, whether it deals with releasing a new product, creating an ad campaign that won’t resonate, appealing to the wrong persona and much more. Thus, surveys allow you to discover your risks, decide on whether they are worth taking and avoid mistakes.
As an added bonus, simply the act of conducting a survey affects customer behavior, along with their opinions of a company. Specifically, the satisfaction of writing a positive survey response creates a desire to buy more of a product. With this information in tow, brands that include their name and likeness can increase sales simply by conducting a survey.
As such, surveys don’t merely provide you with an understanding of your customers’ needs, wants and sentiments; they also allow you to affect their perception of your brand and their willingness to buy from you.
In this way, and as mentioned in the above link, surveys, especially those that provide positive experiences, contribute to your revenue, which keeps your business afloat. Aside from granting you new customers, you can also use them to survey existing customers.
By offering them a good experience and presenting your company in the best possible light, surveys also help you boost consumer loyalty, which is an absolute must. Loyalty is the core of customer retention, which is often cited as more important than customer acquisition.
For example, did you know that 80% of profits come from just 20% of your existing customers? In addition, retaining customers is far less costly than acquiring new ones. There are plenty of statistics that back up the claim that customer retention is both more profitable and less expensive to achieve than customer acquisition.
For example, consider the following:
- Increasing customer retention by just 5% can increase profits from 25-95%.
- The success rate of selling to an existing customer is between 60-70%, while the success rate of selling to a new customer is only 5-20%.
All in all, conducting a survey is crucial to the well-being of your customers and your business. Surveys help you unearth virtually any insights which you can then use to guide your next or ongoing business move.
What You Need to Conduct a Survey
If you want to get meaningful results that you can act on, there are certain things you’ll need to have and certain actions you’ll need to take. These will steer your survey campaign in the right direction, give you the most accurate and useful results and ward off survey bias.
Before we dive into the steps to conduct a survey, let’s glance over the things you’ll need (not all of which are tangible), to conduct your survey. These are a must and must be present within the online survey platform (or market research agency) that you use.
The following list lays out everything you need to conduct a successful survey:
- Survey the correct population,
- Use the correct survey distribution method (see Step 5)
- Make sure your survey provides a pleasant survey experience
- This includes ALL digital properties where your survey will live, such as websites, mobile sites, apps and more.
- Have the ability to customize your surveys to your liking
- Have various questionnaire building options, such as
- Survey templates
- Advanced skip logic
- Different screening options for demographic and psychographic screening
- A filtering system
- Screening questions
- A wide variety of question types you can use, such as
- Matrix questions
- Open-ending questions
- Likert scale questions
- Rating scale questions
- Be able to create a variety of specialized surveys, such as
- The Net Promoter Score (NPS) survey


- The Customer Satisfaction Score Survey, aka, CSAT survey
- The CET (Customer Effort Score survey)
- Visual rating surveys, which include
- ones that use hearts,
- stars
- emojis
- other visual ratings as scaled questions).
- Both B2C and B2B surveys
- The Net Promoter Score (NPS) survey
- Access to granular insights via a post-survey results dashboard and a survey builder.
- Use a platform that offers 24-hour technical support
- Can conduct global market research
- Leverage a system that offers a wealth of technical and quality checks to avoid survey fraud
- This helps you avoid
- Gibberish answers
- Respondents who aren’t paying attention
- Flatliners (those who keep answering with the same choice in multiple-choice questions)
- Bots
- Those hiding their location via VPN
- This helps you avoid
As you can gather, there are various elements to a successful survey. You’ll need to therefore carefully select your market research platform — or agency, if you’re taking the syndicated research path.
You don’t want to settle for a low-tier platform, otherwise, you risk collecting unneeded biases and a whole host of low-quality data.
Steps to Conduct a Survey
Follow along the 8 steps in this guide to conduct meaningful survey research.
- Step 1: Identify your research goals
- Step 2: Define your target audience
- Step 3: Come up with preliminary questions
- Step 4: Design your questionnaire
- Step 5: Distribute your survey
- Step 6: Organize survey responses
- Step 7: Analyze and present survey results
- Step 8: Take action
Step 1: Identify Your Research Goal
Every successful survey has a purpose. You’ll need to identify yours to get started. This will serve as the basis of the entire survey campaign.
In order to identify your research goal, you’ll need to consider the insights your business needs most. Consider the following questions to ask yourself and your team:
- Do you need to steer an advertising campaign?
- Do you need to form a marketing strategy?
- Are you trying to find out why you are losing customers?
- Do you want to know if your policies are effective?
- Are you figuring out what to do in the current market?
- Do you need to discover your own employees’ sentiment about your workplace?
- Would you like to cut back your customer attrition rate?
The kinds of questions you need to ask yourself and your company’s different departments are limitless.
We suggest forming a survey that relates to your most pressing needs, or setting up a proactive survey study, that is, a survey campaign designed before you go through with something, such as designing a new feature or ad.
Understanding your survey’s main goal both improves its quality and reduces the time you’ll spend on executing your research.
In case you struggle to pinpoint your exact goal, write down a list of all the questions and issues your market research campaign needs and prioritize the most important ones.
In addition, ask yourself and your team questions to better understand your own standing in regards to market research, your existing tools, campaigns and more. These are your peripheral questions, which will help you determine your key research goal.
The following questions will help you understand your survey goal better:
- Do you understand who comprises your target market?
- Do you need to segment your target market further?
- Do you already have any existing data that you can use?
- Do you need data to improve an existing product or launch another?
- What resources do you have to perform the survey?
- What actions are you going to take after the survey is complete?
After you have figured out the main goal of your research, you will need to define your survey audience.
Step 2: Define Your Survey Audience
Identifying your survey target audience is key to any successful market research campaign. After all, it is the audience that you seek to study, to learn how its members tick, their habits, sentiments, etc.
The wrong survey audience will invalidate your study, as it will be irrelevant to your business or study.
There are two main concerns when it comes to surveying participants: who should I survey and how many participants do I need?
Let’s clarify both.

Who should I survey and who is in my target market?
Surveying the right people makes all the difference. That’s why before determining your survey audience, you’ll need to first identify the makeup of your target market. To do so, you’ll need to conduct secondary research, along with consolidating what you already know about your target market.
In addition, you’ll need to conduct market segmentation, which will allow you to break your wider target market into various segments. These can exist on the basis of various factors, such as age, ethnicity and other demographic factors, along with behavioral aspects, such as buying habits, frequency of purchase, brand trust and more.
You can do this by conducting an RFM analysis, which is an abbreviation of Recency, Frequency and Monetary Value. In this analysis, researchers estimate the value of a customer based on the three data points in its abbreviated title. This is one of the models for customer behavior segmentation.
Targeting a specific audience is important for many reasons. For example, suppose you want to learn if iPhone users are happy with the recent product updates.
By surveying random iPhone users, you may notice that the majority of responses are somewhat neutral. But if you target specifically the Gen Z generation, you might learn that the younger demographic is worried about having to buy extra accessories.
The more defined your target audience criteria are, the more accurate and deep your survey insights will be. Thus, make sure to brainstorm, segment and fully identify your target market and your own customer personas before setting up your survey questionnaire.
Identifying them first will show you which target audience you’ll need for your survey to gain the most accurate insights and help you fulfill your survey goal.
How many survey respondents do I need?
When doctors want to examine your blood, they don’t drain all of it - they just need to take a small sample. The same principle stands with surveys: a small sample of survey respondents can accurately represent the opinions of a larger group.
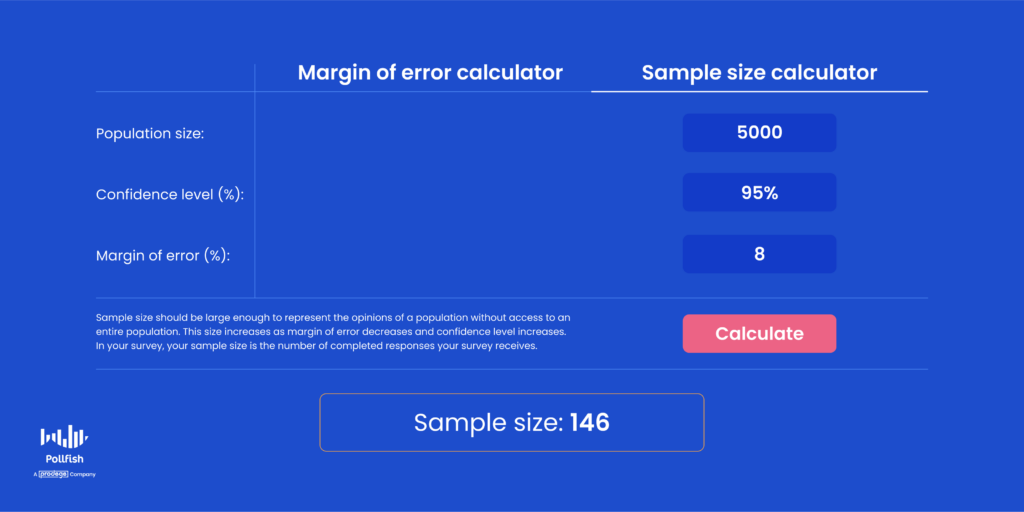
For example, if there are 5,000 people in your company and you want to know how well the latest HR policy was received, you don’t need to survey all 5,000. In fact, surveying just 146 employees will be enough.
Thus, if you want to learn what all American high schoolers think about the recent TikTok ban, you don’t need to ask all 76 million of them. Surveying between 200 and 600 respondents will give you a sufficient amount of opinions to draw from.
For the majority of studies, 200 to 800 respondents will be enough to represent the thoughts and opinions of a particular population. However, all studies are not built the same, nor are they geared towards the same kind of longevity, think longitudinal surveys versus cross-sectional surveys.
As such, you’ll need to calculate your survey sampling size, which is also referred to as a sampling pool.
If you want to calculate how many respondents you’ll need to get scientifically accurate survey results, feel free to use our sample size calculator.
Step 3: Come up with Preliminary Questions
Now that you’ve carefully selected a main survey goal and theme, along with having identified who to survey and how many to include in your sampling size, it is time to get to the heart of your survey: the questionnaire — or at least the beginning of it.
To do this, you’ll need to consider the main goal and subgoals of your survey campaign. As such, write down the most pressing questions you have. We suggest coming up with a list of 10 questions.
Note that not ALL of them need to be in your survey, in fact, we suggest keeping your questionnaire short. Even users of a game who’ve come across your survey and decided to take it for in-game survey incentives will hesitate to take a lengthy survey.
As such, your preliminary 10 (or more) questions are just that: preliminary. Not all of them will make it to your questionnaire, as they are meant for brainstorming ideas.
As you create these questions, heed the following tips:
- Create questions based on the survey campaign you’re going to use.
- For example, if you’re going to run a longitudinal study, you’ll need to create questions that span through various time periods.
- Or, for a cross-sectional study, you’ll need to create questions for just one survey and thus have one primary focus of the study.
- Do any of your questions appear too similar to one another? If so, consider merging them or removing a few.
- Decide whether certain questions need follow-up questions.
- For example, if you ask a question in which a certain answer requires more information, consider using follow-up questions.
- That’s where advanced skip logic becomes handy, as it routes respondents to relevant follow-up questions.
- This creates paths in your survey and allows you to understand your respondents and the subject of the original question at a deeper level.
- This can also be relevant to the first point, as you can use similar questions as potential follow-up questions.
- Do your questions pertain to certain customer segments or personas?
- If so, refer to your customer segmentation and personas list. You may need to break your survey into two or more, depending on how many customer segments it can be used for.
- You can also add multiple audiences in one survey.
- Show your preliminary set of questions to your team/colleagues for their feedback and suggestions.
- Here, you can get into the nitty-gritty of what is most important for your study by way of other relevant opinions that will help shape it.
Step 4: Design Your Questionnaire
Next, we’re going to move on to designing the questionnaire itself. This will largely depend on the survey platform you use. As aforementioned, you’ll need to use a strong market research SaaS platform that offers a variety of features and services to form a robust survey campaign.

Make sure your survey platform allows you to build the questions you need at ease and speed.
It’s key to note that the quality of a questionnaire is where the majority of surveys fall short. Experiments suggest that sensitive or vague opinion questions increase the potential of error by up to 30%. Put simply, your survey is as good as your questionnaire is.
Make sure your questions are clear and don’t contain jargon or uncommon abbreviations. This is key to shaping the survey experience.
A poor example of a survey question: Do you think VR is going to take off in the next 5 years?
A better example of a survey question: Do you think virtual reality (VR) is going to take off in the next 5 years?
In some instances, a poor question is one that yields scant information. In this case, it is key to follow it up with another, or create it so that it doesn’t require additional questions to begin with. In this case, a yes or no question constitutes a poor example, whereas an open-ended question is the better example.
A poor example: Do you agree that this is a great movie?
A better example: What do you think of this movie?
Take some time to learn how to write clear, unbiased, and effective survey questions to get the best results out of your research.
Step 5: Distribute Your Survey
There are several ways to distribute a survey. These include legacy distribution methods and modern ones. While it may not appear to be very important, choosing how your survey is distributed is as important as choosing who you want to survey.
This is because survey distribution accounts for many aspects of your study, including the following:
- Where your survey will exist
- In the digital vs analog world
- On websites or apps
- Used as part of a focus group
- If your target market see your survey based on its distribution channel(s)
- When your target market will see your survey
- How quickly you’ll gain respondents and completed surveys
- When you can access your post-survey dashboard
- When you can carry out a survey data analysis
- Associations of your brand (if you mention it in the survey)
- How long it takes to complete your survey
- For example, an online survey platform that continues iterating until it receives all required responses works faster than do interviews that a market research firm conducts.
The environment of the survey is critical to its exposure by your target market, as Point 2 states. This is because different demographics spend time online (and in the real world) differently.
Let’s continue with the example of surveying Gen Z iPhone users. Suppose you moderate a local school Facebook group and decide to post your survey there. Even if you get a large number of responses, the results may not accurately affect this demographic.
This is because in this case, you don't pick survey participants randomly, instead, you survey only those who joined the local school Facebook group that you conveniently happen to moderate.
This is called convenience sampling, since the majority of survey participants unintentionally live in one area. The survey didn’t account for Gen Z users from other areas with different average household incomes.
To ensure you get the most accurate survey results, use a survey platform that can help you reach your targeted demographics more precisely and at speed. In short, avoid convenience sampling.
Instead, opt for organic sampling, which gathers survey respondents by distributing your survey to the places they spend their time organically. On the Pollfish online survey platform, we use organic sampling in the form of RDE sampling, or Random Device Engagement sampling.
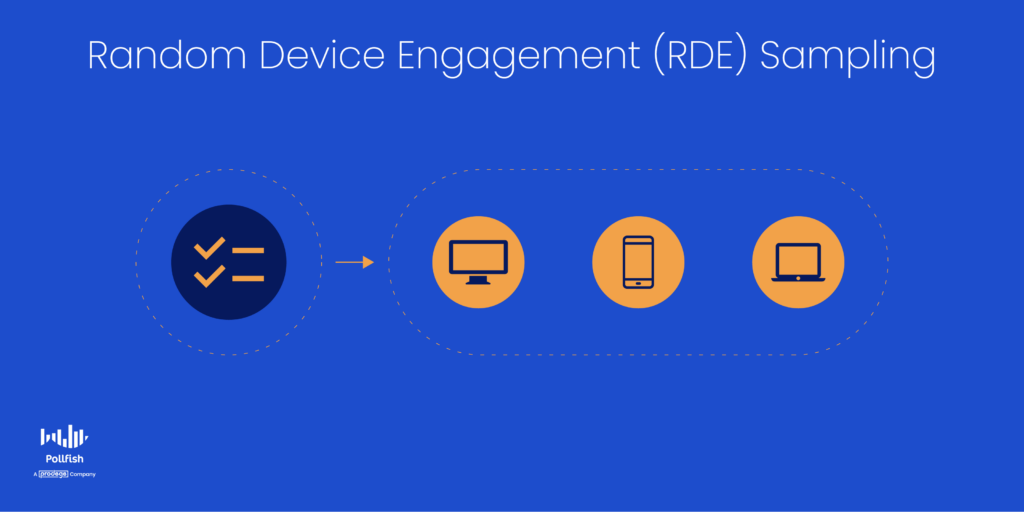 RDE sampling is a kind of organic sampling in which polling relies on advertising networks, or other portals on digital devices, to engage random people where they naturally spend time. This can occur on gaming and mobile apps.
This is the opposite of a research panel, which is a research method that pre-recruits and prescreens a group of research participants who have opted in to take part as the studied subjects of a market research campaign.
Lastly, before we provide a few examples of survey distribution methods, it is also critical to be strategic about when to send your survey. For this, we recommend reading our quick guide on the best time to send a survey.
Here are a few common ways to distribute your surveys:
- Email. You can distribute your survey by email, especially if you have access to an established email list. The two main drawbacks of email surveys are that it’s harder to set specific target audience parameters and email response rates are generally low.
- Social media: if you survey people via social media channels, beware that sometimes social media groups attract people with shared interests that may not represent the opinion of your target audience or the general public.
- Online survey platforms: survey platforms such as Pollfish allow you to hyper-target specific audiences, control the number of participants, distribute the survey in different ways, reach all quotas, easily organize your survey results and more.
- Survey panels: A survey panel is a consistent group of survey participants, who have pre-recruited and pre-screened, who opt into a survey study. Researchers would return to the same people to run surveys or host interviews repeatedly over time.
- Syndicated research: Syndicated research refers to research conducted by a market research firm, oftentimes independently. It is published and sold by a market research firm, which is usually industry-specific and funded by several companies within a particular industry. The firm and its partner companies own the data that the firm collects. Other companies in their particular industry may purchase the data.
Besides these prominent survey channels, there are other survey solutions you can use; make sure to select the one most pertinent to your market research needs.
Step 6: Organize Survey Responses
After you’ve gathered your responses, you’ll need to organize the data before starting your analysis. As with the prior steps, this will largely depend on your survey tool, which also dictates your survey distribution, audience targeting and creation.
Here are the steps to prepare your data for analysis:
- Clean. Sometimes people fill out the survey twice by mistake. Although Pollfish survey technology prevents duplicate responses altogether, if you’re conducting a survey on your own, or via syndicated research, make sure to clean duplicates and “funny” answers before you proceed to organize your data.
- Organize. Group survey answers that are similar to each other and try finding patterns that allow you to structure your data.
- Visualize. Try finding ways of visualizing survey responses using graphs, charts and images. Visualized survey data is easier to analyze and refer to, especially if you want to share survey results with other people.
Step 7. Analyze and Present Survey Results
The data you collected during your survey can be presented and analyzed in many different ways, so make sure to go back to the survey goal that we covered in Step 1.
Analyzing survey results and writing a report often go hand in hand, so it’s a good practice to go back and forth between the two until you fully narrow down your findings.
Here are some questions that will help you write a better report:
- Did you achieve your survey goals?
- How can you organize your findings into cohesive narratives?
- What are the main insights that you gathered?
- How can you use the collected data in the future?
- Are there other ways this data can be interpreted?
Keep your margin of error in mind during your survey analysis. This measurement points to the degree of error in the results of a survey, specifically one that relies on the random sampling method.
It is imperative to keep the margin of error low, as a high margin of error reveals a smaller likelihood of survey results to reflect the true views of your survey target audience. As such, a higher margin of error renders your survey less reliable and inconclusive.
If you are presenting a report to others, remember that different audiences may be interested in different aspects of your survey.
In case your audience is primarily business stakeholders, then the main focus should be concrete customer preferences or aversions, along with actionable suggestions.
If you are presenting a survey to other researchers, they will be more interested in the technical aspects of your survey such as target audience, sample size, and data analysis method.
Make sure to consolidate your survey data analysis into one document. The document should be divided into the themes, patterns and other central areas of focus of which you’ve collected and analyzed data to draw different conclusions.
It will be this data — not the raw data in your dashboard — that will guide your business decisions, changes and all other courses of action.
Step 8: Take Action
In this step, you’re going to consult the information you’ve gathered and analyzed in Steps 6 and 7. You’ll need to create a document of your findings, one that exists outside your dashboard and is central to your survey analysis.
This document should cover central findings, along with key granular ones. It should also answer some of the key concerns you had in Step 1, along with the questions designed for your respondents themselves.
Do your results and analysis answer all the inquiries and curiosities you had about the topic at hand? If so, it is time to take action. If not, then you should create another survey, one that focuses on the things that are left unanswered, or anything you need more information on.

Sometimes, the latter is most common, with survey campaigns lacking clarity, therefore lacking completion. However, not to worry, just create another survey. If you have the contact information of your respondents, just send them a follow-up survey. If not, send your new survey as you had originally done.
We recommend using an online survey provider that offers the random device engagement method, which, as aforementioned, is a kind of organic sampling that uses digital properties to query respondents where they visit organically.
If, however, you have all the insights you need, it is time to take data-informed action. There are many ways to take action on any given topic. The following list enumerates various ways to act on your survey data and analysis:
- The establishment of something (ad campaigns, marketing strategy, pricing, a slogan, etc)
- Changing something already in existence (ads, videos, promotions, pricing, etc)
- Scrapping aspects of an ad, marketing, sales or any other business campaign or activity
- Terminating an action or campaign entirely
- The formation of slightly different approaches based on different market segments
All in all, after you’ve followed these steps, you will be much closer to your original goal, whether it is solely to have invaluable customer/subject data, or to use that data to make immediate or long-term decisions.
Therein lies the power of surveys, they grant you the knowledge you can use for a host of decision-making.
Making Every Survey Count
Every business has a slew of questions about its industry, competitors and customers. As such, they must use market research to crack these challenges and properly serve their target market.
Conducting a survey is at the forefront of conducting this kind of research, as it grants you firsthand insights, tailored specifically to your target market, with your most requisite questions.
The challenge in conducting a survey manifold: finding a survey solution to easily distribute your questions to the right audience, creating a survey with the proper questions, distributing the survey in the right channels, consolidating your data and more.
Following our eight steps will help you conduct meaningful and unbiased surveys to answer your most demanding questions. However, adhering to this process is not enough.
You’ll need to find a potent online survey platform to facilitate your entire survey process, from targeting, to questionnaire building, filtering data and more.
Ideally, it should provide various quality and technical checks to ward off survey fraud, offer a mobile-first survey environment and allow you to survey anyone, not just via on network on the RDE method (although this method is incredibly effective).
It should allow you to survey specific people, such as via email, or whichever digital channel you seek to use. Luckily, there’s the Distribution Link feature, which enables you to do just that.
Good luck!
Frequently asked questions
What is the first step in planning a successful survey?
Before writing questions or recruiting participants, you should establish the goals of your survey. By understanding goals, you can ensure your survey stays focused and will answer your most important questions.
Why are surveys used?
Surveys are one of the best ways to gather information about your customers or target audience. As opposed to simply researching an industry or trend, surveys let you ask specific questions to the people who matter most to your business.
Why is it important to define the target audience for your survey?
A more defined audience will lead to deeper, more relevant insights. A carefully defined audience provides more accurate results and ensures the goals of your survey are met.
How can online surveys be distributed?
Online surveys can be distributed via email, social media, or a professional survey platform.
How many people should take an online survey?
The number of respondents needed will vary from one survey to the next. The important part is that the sample size accurately represents the target audience. For most studies, a sample size of 200 - 400 is a good goal.

Diving Into the Competitor Survey for All Competitive Analyses
Diving Into the Competitor Survey for All Competitive Analyses

All businesses should deploy the competitor survey periodically, to keep a watchful eye on their competitors and their target market’s perception of their competitors. Competition is alive and well across every vertical, so it is critical to stay in the know on this front.
94% of businesses are investing in competitor intelligence and for good reason, as one of the main reasons why businesses lose their customers is because customers abandon them for their competitors.
In fact, 89% of customers switched to doing business with a company’s rival due to poor customer service. As such, all businesses must strive to surpass their competitors in a variety of matters, from product satisfaction to customer convenience.
That way, they can build brand trust to arm themselves against customers abandoning ship.
This article examines the competitor survey, competitive analysis, its importance, when to use the survey and how to create one.
Understanding the Competitor Survey
The competitor analysis survey is a critical online survey that helps businesses across industries understand their competitors’ business performance, especially in comparison to themselves.
This survey is the leading tool in competitor analysis, which is the practice of identifying your competitors and evaluating them on their strategies, target market perception, strengths and weaknesses and other key characteristics relative to your own.
Competitor analysis allows you to assess and fully understand your market in terms of its key players. It also grants you insight into your own standing and how you compare with your direct contenders.
Competitor analysis helps you assure that you’re allotting resources in productive ways by understanding your competitors, what has worked efficiently for them and what hasn’t. It assures you don’t fall behind and keep up with them, whether it is through product improvement and innovation, customer support, CX and all else.
The competitor survey helps you understand your competitors through the perceptions of your target market. After all, it is your customers whose opinions matter most and you’d be hard-pressed for an employee in your rival company to reveal trade secrets — or any at all.
However, you can still gain competitive insights by surveying certain competitors with B2B surveys. This is especially useful in business partnerships. While you may not get access to your direct competitors, you can still collect crucial information from indirect competitors that help inform on the state of your industry and niche.
Given that competitive analysis is most productive when consistently conducted, you should deploy the competitor survey regularly.
The Importance of the Competitor Survey
This type of survey has several advantages.
First off, by using this survey, you get access to firsthand insights from your customers, allowing you to glean all of their opinions on your competitors’ performance. Whether it comes to their brand messages, products or CX, this survey gives you a clear view into how they see your business rivals.
As such, you can use this survey to form a comparison between you and the competition. You can do so by asking your respondents to choose their favorite brand in a list and include your brand. You can also ask them to rate each brand by using a ranking question.

Additionally, this survey grants you key data into your customer behavior as it relates to your contenders. In this regard, you can survey customers on where they buy from your competitors,’ how they shop from them, how often, whether they’ll buy more during a certain event (ex: promotion) and more. In this way, you can create a kind of RFM analysis from this kind of survey.
It allows you to conduct competitive research by keeping track of your competitors through the eyes of your customers. Essentially, it is a kind of brand tracking, but instead of focusing on how your own brand is perceived, the spotlight is on your counterparts — unless of course, you explicitly ask questions that compare you to your rivals.
By understanding what your target market likes and dislikes about how your competitors operate, you get a twofold advantage. Firstly, you’ll generate ideas on how to run marketing campaigns, how to innovate your products, augment your customer support and improve across your entire customer experience. Secondly, you’ll also know what to avoid and do away with, based on what your customers view unfavorably about your opponents.
In regards to the former, you’ll also form ideas on how to target and acquire new customers, which has the potential to lower your customer acquisition cost. This is because you’ll be armed with data for decision-making, the kind that shows you exactly what your target customers want and expect.
When to Use a Competitor Survey
There are various times to implement the competitor survey for your competitive analysis. These often depend on your marketing campaigns and the time of the year. The following includes several opportune times for deploying this kind of survey.
- Shortly after your competitor(s) release new products or services.
- During heightened times of customer attrition. For example, when you notice high bounce rates on product and landing pages, along with customers abandoning their shopping carts.
- Shortly after you released new products, a new campaign or content.
- This can include new services.
- This can also include new website experiences, whether you offer a new subscription, UI elements, etc.
- During an in-home use test.
- One of many market research techniques, this allows companies to understand how their target market interacts with their products before they officially launch them.
- It grants businesses to understand how their customers use their products in natural settings instead of at customer facilities.
- Before launching a new product or innovating on a product idea.
- You should be aware of similar such products from your competitors along with your customers’ opinions of them.
- This way, when forming new products as well as post-production but before they go to market, you will understand how to best market them.
How to Create a Competitor Survey
To create a competitor survey, you will first need to work on another aspect of competitor analysis: identifying your competitors. This requires doing some secondary market research. A good starting point is to google the products sold within your niche.
Pay attention to the first and second-page rankings of the SERP (search engine results page). Additionally, take a look at the ads that show; these will appear at the very top of the SERP and are marked by the word “ads.”
When you google the common offering found in your niche, you’ll notice some competitors will rank for content aside from only the products and services. Some of these will take the form of a featured snippet. This kind of positioning places content above the very first search engine result.
Instead of appearing as a link and meta description, the snippet extracts more information from the page it’s highlighting. As such, the extracted content will be longer.
 Companies that land feature snippets perform well in terms of SEO. As you’re gathering your list of competitors, you can move on to the following steps, which guide you on how to create the competitor survey:
- Put together a list of at least 10 competitors, including indirect competitors.
- Start by understanding how customers feel about them by targeting your various market segments and customer personas in a preliminary competitor survey.
- In this survey, conduct brand awareness research on your competitors to see whether your customers know about their existence before you probe any further.
- This will keep your survey short, which is a general survey best practice.
- Next, choose a particular theme and campaign for the survey study.
- It can be based on a new product your competitor released, a seasonal campaign, or one with general questions about how customers feel about it.
- Use the above section on when to use this survey to provide some ideas on when to launch its study and what to base the study on.
- Create several key questions based on the theme of the study.
- Deploy your survey at a favorable time.
- Learn about the best time to send a survey.
- You should send it to a vast publishing network, along with identified, individual customers.
- Analyze your survey results.
- Decide whether you need further information and if you do, create a follow-up survey.
- Choose another theme for the survey.
- There are plenty of topics to base your survey on, such as testing the brand trust of your contenders or for brand tracking.
- Analyze and iterate if need be.
- Then, make decisions based on your customer data.
Staying Ahead of the Competition
To remain competitive, you’ll need to conduct a competitive analysis of your competition. You can easily achieve this with survey research. The key is to find a stong online survey platform to carry out your research and present it in a way that’s most convenient for you.
As such, you should use an online survey platform that makes it easy to create and deploy consumer surveys. It should offer random device engagement (RDE) sampling to reach customers in their natural digital environments, as opposed to pre-recruiting them.
You should also use a mobile-first platform since mobile dominates the digital space and no one wants to take surveys in a mobile environment that’s not adept for mobile devices.
Your online survey platform should also offer artificial intelligence and machine learning to remove low-quality data, disqualify low-quality data and offer a broad range of survey and question types.
The survey platform should offer advanced skip logic to route respondents to relevant follow-up questions based on their previous answers. It should also make it easy to form a customer journey survey to survey your respondents across their customer journeys.
Additionally, it should also allow you to survey anyone. As such, you’ll need a platform with a reach to millions of consumers, along with one that offers the Distribution Link feature. This feature will allow you to send your survey to specific customers, instead of only deploying them across a vast network.
With an online survey platform with all of these capabilities, you’ll be able to gain useful insights on your competitors from your target market.

Diving into the Customer Service Satisfaction Survey to Improve All Customer Service Sessions
Diving into the Customer Service Satisfaction Survey to Improve All Customer Service Sessions
The customer service satisfaction survey is the chief tool to use to assure you offer the best customer service sessions. Your customers are bound to elicit customer service activities with your business, no matter how well they know your products.
Whether it’s for technical support, a glitch in a product or help with your digital properties, seeking out and receiving customer service is a major part of your customer experience. It can occur in all parts of the customer buying journey, including pre-sales and post-sales periods.
As such, you’ll need to optimize your customer service satisfaction, just as you would with any other part of your CX. This is also because customers don’t keep their brand perception to themselves.
72% of customers will share a positive customer service experience with 6 or more people. However, unsatisfied customers also share their experiences; 13% of unhappy customers will share their experiences with 15 people or more.
To take matters into further perspective, 70% of customers say they’ll support a company that delivers great customer service. 17% of Americans are even willing to pay more for a business that has a good reputation regarding its customer service.
These statics prove the weight that customer service satisfaction has on businesses. You can optimize yours by gauging this experience through surveys.
This article explains the customer service satisfaction survey, its importance, when to use it and how to create one.
Understanding the Customer Service Satisfaction Survey
The customer service satisfaction survey is a survey that inquires into customer service satisfaction, as its name suggests. It is a kind of customer service survey, but it should not be mistaken for one, as there are a few distinctions between the two.
The customer service survey is a broader survey type that can be used across the customer buying journey, whereas the customer service satisfaction survey specifically focuses on the satisfaction portion of a customer service session. In this regard, this survey zeros in on support sessions, which are typically conducted after a customer has already made a purchase.
However, this is not a fast and hard rule, as there are other instances in a customer journey where customers receive customer service. Businesses will need to probe them on their satisfaction with these experiences as well.
As such, this kind of survey is centered on gathering customer feedback on the satisfaction aspect of various kinds of customer service. Businesses can use it to measure customer happiness and dissatisfaction during the service session, learn how to improve their service and discover how to streamline future customer service sessions.
When it comes to differentiating from other customer satisfaction surveys, the customer service satisfaction survey entails using customer service representatives to help come up with the questions. This is because you’ll need to use questions specific to the customer service session; otherwise, your customers won’t want to take part in the survey, as it will come across as too generic and not useful to their situation.
The Importance of the Customer Service Satisfaction Survey
The customer service satisfaction survey is critical to use for a number of reasons, including the ones mentioned in the intro.
To piggyback off of the intro, the importance of this survey comes into play, given that you can use it to improve your overall customer experience. Given that customer service sessions involve interacting with a company, usually for an extended period, it plays a major role in CX.
In fact, 1 in 3 customers will leave a business they love after only one bad experience, while 92% would completely abandon a company after two or three negative interactions. There are many things that contribute to a bad customer service experience — some aren’t as obvious as others.
This is where the customer service satisfaction survey is useful, as it helps you find the things that bother your customers, ones which you may have overlooked or never had considered as sources of problems.
A poor customer service experience can be due to the lack of a follow-up. In this case, businesses that have time-poor employees are at a disadvantage, unless they commit to following up with the customers they’ve assisted in a customer service session.
However, even if you follow up with customers you’ve assisted, the customers themselves may lack the time and will to speak with you, if it’s over the phone. Emailing customers is the easy route; however, they may be unwilling to begin an email conversation with customer service agents.
In such a case, the customer service satisfaction survey is especially useful, as it provides a quick and easy method to follow up with your customers after a customer service session. You’ll show your customers you care about their opinions on their customer service experience without asking them for too much time while reaping the benefits of their insights.
As such, this survey helps build connections between you and your customers. The stronger your connection with customers, the more they’ll rely on your products and services. As such, this survey can be used as a tool that goes beyond merely learning about how satisfied customers were with the customer service they got. It also doesn’t stop at improving your CX. Instead, by building relationships with customers, you’re also building brand trust, the cornerstone of consumer loyalty.
Loyal customers are far more inclined on making repeat purchases than causal customers. These are the most quality customers you can strive for, as they will continuously purchase from your brand and even become brand advocates. Loyal customers also tend to have a higher Customer Lifetime Value (CLV).
Given that this survey can help foster brand loyalty and a high CLV, it will in turn lower customer attrition along with your customer churn rate, as you are retaining your customers.
All brands should use the customer service satisfaction survey, as it can reveal critical insights on how to improve your customer service.
When to Use the Customer Service Satisfaction Survey
You’ve probably had various kinds of customer service sessions with your customers. Sometimes, what may appear to be a regular in-store or online encounter, such as a chat, turns out to be something more significant, as it involves customers interacting with your support or sales employees for a considerable amount of time.
Or, it may be quick, but provided invaluable help for your customers. These qualify as customer service sessions as well.
This begs the question of when is the best time to send a customer service satisfaction survey.
The following lists the most apt times to send a customer service satisfaction survey:
- After any situation in which a customer received assistance from an employee, whether it is a customer service employee or others.
- This can involve solicited help, in which customers set up a call or at-home meeting with a representative, or when your employees approach the customers.
- Directly after a scheduled meeting, phone call or other customer service session.
- It is best to let the customers know that you intend to survey them by emailing them.
- This is also a good time to collect their email addresses if you haven’t already.
- This usually occurs after a customer has purchased from you.
- After a customer sampled your product at a store and spoke with a sales representative.
- This occurs usually before a customer has made a purchase and is still deliberating whether to buy from you or a competitor.
- This is a good opportunity to understand customer satisfaction with your customer service in the early stages of your customers’ relationship with you.
- After an impromptu customer service chatting session.
- Some chatting sessions can be minor, with customers asking basic questions that can be found elsewhere on your website.
- But others are more significant, granting key information to customers about all your offerings.
- This can occur at various places in the customer journey, from pre-sales, to after a recent purchase and well after purchasing.
- After customers interacted with a Voice of the Customer (VoC) program, such as a phone call, or in-person experience.
- At times, your support employees may offer specific customer service during these times, so these sessions can extend beyond customers’ venting about their issues or other feedback.
- You can frame the survey as being sent to better help the customers further, even after they gave their VoC feedback.
How to Create a Customer Service Satisfaction Survey
There are various instances where you’ll need to use a customer service satisfaction survey, as the above section explains. They will help you gauge how satisfied your customers are at different points of being served.
If you’re not sure how to go about creating this survey and need a few pointers, the following will guide you.
The following explains how to create a customer service satisfaction survey in a step-by-step way. Check out how to create customer service survey questions.
- Determine a recent instance with a customer, in which they received customer service.
- Refer to the above section to help you decide what to accomplish with your customer service satisfaction survey.
- Decide on the correct online survey platform.
- There is a swath of online survey tools but they don’t all offer the same capabilities, user-friendliness and speed to insights as does Pollfish.
- In the screener section of the survey, select the demographics, location and other traits with which you're going to qualify the respondents of the survey.
- Use screening questions to select respondents even more granularly, by qualifying only those who answer in a particular way to take the survey.
- Form a few key preliminary questions for the questionnaire portion and guide the direction of your survey.
- These should be based on the nature of the customer service.
- Choose the survey type you need for your campaign.
- In the questionnaire section, add in your preliminary questions. Choose from a multitude of types of survey questions.
- Create both general questions and those that are very specific to the customer service session you had.
- Your customer service representative will need to come up with the questions.
- As such, this kind of survey will involve more than just your analysts and market researchers, as it will require forming specific questions from sessions with your customer support team.
- Use advanced skip logic to route respondents to relevant follow-up questions based on their answers.
- With skip logic, you can ask a quantitative question using multiple choice and follow-up with a qualitative, open-ended question.
- Create both general questions and those that are very specific to the customer service session you had.
- Always make the survey unique to your brand if you send it to specific people instead of mass-sending it as in Step A.
- Write an effective email invitation by mentioning the importance of the survey and the fact that you value your customers’ time.
- You can include survey incentives.
- Include a call to action (CTA) to an online survey, such as one that exists on a landing page, or post-checkout.
- Be sure it stands out to your respondents.
- Thank your customers for taking your survey with follow-up emails and a “Thank You” on the final page of your online survey.
- Analyze your survey and use it to make changes to improve your customer service satisfaction.
- This may include changing your customer service representatives’ tone of voice, their introduction statements to the customers, etc.
- This may also lead you to omit certain things your customer service representatives currently use when assisting your customers.
Forging the Most Satisfying Customer Service Meetings
There are various key aspects that makeup of customer experience; customer service sessions are one of the most important factors, as these meetings allow customers to resolve issues, ask key questions about your products and services, acquaint themselves with your offerings and virtually anything else related to customer service.
You’ll need a strong market research platform to host your customer service satisfaction survey campaigns. The platform you use should also allow you to survey anyone. As such, you’ll need a platform with a reach to millions of consumers, along with one that offers the Distribution Link feature.
This feature will allow you to send your survey to specific customers, instead of only deploying them across a vast network.
It is also important to use a mobile-first platform, as mobile dominates the digital space and no one wants to take surveys in a shoddy mobile environment.
The online survey platform you opt for should also offer artificial intelligence and machine learning to remove low-quality data, offer a broad range of survey and question types and disqualify low-quality data.
With an online survey platform with all of these capabilities, you’ll be able to measure and improve your customer service satisfaction survey.

What is a Research Panel and is it Necessary for Market Research
What is a Research Panel and is it Necessary for Market Research

A research panel is a frequently used means for conducting research, including market research (the study of your customers). This method involves studying the same group of opted-in participants through various methods and stages that are developed as part of a research campaign.
The technique that underpins a research panel counters organic sampling, which seeks out research participants, particularly survey respondents, in their natural digital habitats. As such, a research panel is an alternative to random sampling and has various differentiations.
You ought to know all the differentiators of research panels, how they stray from organic sampling, as well as what makes a research panel tick.
With this key information at hand, it will make your research endeavors simpler; it will also allow you to choose the best research method. This is a must, considering that there is a wide range of market research techniques. Panels are just one of many.
You may be wondering if panel research is a viable research method for your business needs or research campaign. Or, you may consider using it in tandem with another research technique or tool.

Luckily, we’ve got you covered on this topic.
This article explains the concept of the research panel in full depth, which can serve as a possible avenue market researchers can explore within the vast array of market research techniques.
What is a Research Panel and is it Necessary for Market Research? Table of Contents
- Defining the Research Panel
- The Role of a Research Panel in the Market Research Process
- When to Use a Research Panel</a
- The Pros and Cons of a Research Panel
- Research Panel Examples
- Why Online Polling Software is Better
- The Online Survey Tool: A Stronger Alternative
- What a Machine-Learning and AI-Powered Survey Tool Does for Your Market Research Campaign
- The Ultimate Verdict on the Research Panel for Market Research
Defining the Research Panel
A market research panel is a pre-recruited and pre-screened group of research participants who have opted in to take part as the studied subjects of a market research campaign.
This kind of research method can involve studying its members repeatedly. In this case, the particular study is called a panel study.
It is also referred to as a longitudinal study, although longitudinal studies don’t necessarily need to involve panels, as there can be longitudinal surveys completed by non-panelists.
As such, it is a way of describing those who have agreed to take surveys on an ongoing basis, which, in market research, are typically members of your target market.
You can use a research panel for a wide range of subject matters. The members of the research panel can include a wide range of people across multiple sets of populations.
Whether you seek to study the workforce of a company or a major constituent of a national population, the term research panel can apply to all such groups.
The key is to use participants who represent members of your target market and most importantly your target audience also referred to as your survey target audience. That’s because a research panel is a recruitment method used to get respondents to take your survey.
In market research, the participants in a research panel are usually the people who belong to a business’s consumer base.
Moreover, they belong to a particular audience, known specifically as a survey target audience in survey studies. This label can also apply to research panelists, as they too can be asked to take surveys.
The members making up a research panel must share several traits, such as demographics, psychographics, geographic location and more. A market researcher may also study various segments that make up a target market.
There are various methods researchers can employ in their research campaigns, in which a research panel provides insights. These include:
- Interviews
- Focus groups
- Surveys
- In-home usage tests
- Experimentations
- Test marketing
The Role of a Research Panel in the Market Research Process
A research panel is but one process within the encompassing practice of market research. Some businesses may decide to extract data from a research panel alone, while others may use it alongside probability sampling.
Also called organic sampling, this method involves reaching out to all the individuals who fall under the qualifications of your subjects of study. As such, it allows more individuals to take part in the sample.
Unlike many of the sub-methods of organic sampling, a research panel is not anonymous, in the sense that the panelists’ identities will not be hidden from the researcher.

They are still kept anonymous when it comes to sharing the findings with the public, as you wouldn’t reveal the panelists’ identities.
This allows researchers to study the members at a greater depth, in that researchers can match answers with the respondents themselves. This is due to the nature of pre-recruiting participants; when you do so, you’re going to need to collect information on each panelist, some of which may be personal.
This method will allow you to understand if they’re qualified to partake in your studies. As such, you’re effectively putting names and faces with data, essentially identifying each member. Additionally, this allows you to build a profile on each participant, adding bulk by applying multiple studies.
Forming profiles gives you a glimpse into the presence of personas in your target market. A research panel is the starting point in building a persona.
When you’ve profiled panelists through various means (interviews, focus groups, etc.), you have several kinds of data, from which you can form an analysis and draw conclusions.
You can test the prevalence of these conclusions by surveying other members of your target market, i.e., those who are not in the research panel.
Various survey sampling methods will not only complement your research panel but also give it validity and statistical relevance. After all, there are only so many panelists you can interview or meet with.
Even if you study your research panel via surveys, it is not practical to spend a lofty amount of time vetting people to ensure they fit your research campaign. Thus, a research panel may not be the strongest of the various market research techniques.
When to Use a Research Panel
While businesses and market researchers can use a research panel liberally, it is not always in their best interest. This can be due to the size of a business, a limited budget, the objectives of a research campaign and the length of the research study. There are also times when it makes sense to engage in research yourself and other times in which it may be beneficial to work through a professional market research agency such as IntoTheMinds.

With this in mind, there are particular times in which companies and researchers alike can benefit from using a research panel. These include the following instances:
- Obtaining a constant, in-depth read of a certain group of participants.
- Conducting a more intimate study on a particular group of people.
- Running continuous studies on the same people, ie, for longitudinal studies.
- Gathering data on subjects with scant studies due to rarities. Ex: people aged 100+
- Large research projects that will involve multiple modes of data collection
- When you are performing market segmentation.
- When you are building research or customer personas.
- To fulfill the preference of conducting research in a group setting.
- To gain insights on a topic that you may not have considered from your list of questions/concerns.
- These insights typically arise in conversations, as participants bring up points and considerations that you may not have originally thought of when forming your research plan.
- To assist or act as a helping agent in conjunction with another form of research, such as survey studies.
The Pros and Cons of a Research Panel
The research panel tactic offers advantages and disadvantages that all market researchers should be privy to. Like other research techniques, it is not perfect and for some, the disadvantages may outweigh the benefits, while to other researchers, the opposite may be true.
You should mull over both the advantages and disadvantages that come with this form of research.
The following lists the advantages and drawbacks of using a research panel.
The Pros
- Panel members have a more advanced understanding of the research topic since they can be recruited through a longer vetting process.
- It can be used multiple times on the same survey, to study change within a particular group that represents segments of your target market.
- It’s easier to conduct in recurring intervals, given that you have all the panelists’ information and don’t need to screen them as you would with a new set of participants.
- Deeper reads and longer researcher/panelist interactions are suitable for the 3 main types of survey research methods.
- It is much easier to follow up with panelists, should you need more research, as you already have their contact information.
The Cons
- Lack of privacy: face-to-face interviews, along with phone interviews in which researchers know the identities of panelists can be intimidating.
- Even a panel study lacks privacy, which can lead to intimidation or fear of answering honestly.
- Acquiescence bias: along with other biases, this issue can take shape, as respondents may feel pressured to answer in a particular way, leading to forced or inaccurate responses.
- Panel attrition: Due to re-interviewing, research panels are susceptible to fatigue, loss of interest, or pressure (Points 1, 2), making them easy candidates for attrition.
- Ingenuine change of attitude/ opinion: Interviewing and reinterviewing can change attitudes, in ways that are not always genuine, due to re-interviewing.
- Expensive: Whether you hire an in-house panel or use an external one, it is often an expensive affair, as you will need to pay each panelist. Since this is an ongoing study, you may have to pay them for each session.
- Poor data quality: This is especially true when a panel member is a participant in multiple panel companies.
- The quality of the data may be compromised when a respondent is a member of two or more panels.
- This is because the respondent may partake in the same survey.
- If they answer the same way, you will have duplicate data, but if they answer differently, there might be bias. At any rate, you’re getting data from the same person twice, which doesn’t improve the trustworthiness of research findings.
- Missing out on a larger survey pool: This relates to the aforementioned lack of privacy. Not everyone in your target audience will want to give away their contact info, let alone have their answers be tied to their identity.
- As such, you may not get enough participants for the specific quantity required for your survey sampling size.
Research Panel Examples
A research panel can be applied to all kinds of scenarios and has various use cases. Remember, they can be applied to both long and short-term research, despite being associated with the former more often.
They can be used in market research, which is for business purposes and is centered on customers. Or, they can be used for a wide range of other research types, such as medical, scientific, social, behavioral and educational research.
To help you better understand research panels, the following list includes seven examples of them across different areas of study:
- A business studying the customer buying behavior of three of its customer market segments.
- This is especially useful to compare segments with high and low consumer loyalty.
- A university research group studying the effects of sleep deprivation among students over a semester or year.
- An enterprise company seeking to release the most resonating ad campaigns by comparing how it's received across the world.
- A condiment manufacturer who is interested in comparing flavor and texture preferences across different parts of the country.
- A business that is intent on following its target market’s shopping habits and how they compare to their competitors.
- This will need to involve research on competitors. That means you’ll need to inquire about them in the panel, as well as perform secondary research to complement the study.
- A healthcare company seeking to find the relationship between device usage and obesity.
- A government program that tracks the success of a new social program for certain populations.
Why Online Polling Software is Better
Online polling software trumps research panels for a variety of objective reasons. There are also various subjective and preference-based justifications for leveraging an online survey tool instead of a research panel.

Organic Sampling and RDE
First off, online survey platforms allow you to run random organic sampling, which allows you to reach non-professional survey takers and gain a far larger reach than you otherwise would have.
This is because organic sampling involves what’s known as Random Device Engagement (RDE), a kind of polling that relies on advertising networks and other portals on devices, to engage random people where they are, voluntarily.
Additionally, in Random Device Engagement, the surveys are delivered to users in their natural digital environments, capturing them where they prefer to be. They were not pre-recruited and thus do not face the same pressures and conditioning that they would in a research panel.
As such, they are more likely to answer questions truthfully, as they have no one to answer to, are kept anonymous and have nothing to lose.
Greater Privacy
With far more privacy afforded to them, respondents of organic sampling surveys are also less vulnerable to acquiescence bias and all the other biases that involve the respondents’ reputation.
On the other hand, there’s polling software. This method, as aforesaid, provides respondents with the most privacy, as they are not pre-recruited or pre-screened. In many cases, polling software reaches respondents organically, which affords respondents the most amount of privacy.
Some survey platforms (such as Pollfish), allow you to send surveys to specific individuals instead of simply across a vast network of online platforms; in this case, the study won’t be as private. However, it is another deployment option to expand how you run your survey study.
Greater Reach to Research Participants
It also has a far greater reach to respondents. This, however, will depend on the online survey platform you use. We suggest one that allows you to conduct global surveys with the same ease as you would with local surveys.
Upfront Incentives
When you use an online survey platform, survey incentives are usually mentioned upfront. This is typically the case with a survey platform that partners with gaming sites and other digital platforms that offer in-app awards, which can be either monetary or non-monetary.
With incentives being offered (or at least mentioned) at the fore, all kinds of customers will be more willing to participate in the survey study.
Less Time Consuming
Moreover, an online polling platform isn’t as time-consuming for respondents. This is because such a platform does not simply conduct longitudinal studies — and even when it does, it can target random people who fit into certain customer profiles and customer personas.
It is also far less time-consuming for researchers. That’s because they don’t need to conduct interviews or other actions to recruit participants; the polling software does it for them. As such, it’s a win-win for all the people involved in the study: the respondents and the researchers.
Less Room for Attrition, Boredom and Bias
As such, it isn’t reliant on using the same people repeatedly to take part in a study. In this way, it cuts survey attrition. This is because some panel members may feel exhausted, burned out or simply frustrated with having to continuously be part of a study, especially if it covers the same subject.
As such, using polling software grants you the opportunity to ward off boredom from your respondents, as well as gain accurate responses. As mentioned earlier, panelists are far more prone to acquiescence bias and other biases.
Respondents of a polling platform offering organic sampling are at a far lower risk of being biased or getting bored. The latter is especially true in a platform that offers a mobile-first environment. After all, mobile dominates online web traffic, as over half of web traffic comes from mobile devices.
Thus, a good survey design, especially one built for the mobile space creates a pleasant survey experience, one that intrigues respondents to take a survey in the first place, and most importantly, complete it.
Aside from these advantages that online polling offers over research panels, there are many more. The other pros deal largely with the survey tool itself as opposed to its distribution and high-level polling aspects.
The Online Survey Tool: A Stronger Alternative
While a research panel has several benefits and use cases, online survey tools present a stronger alternative. First off, they have even more use cases and can be applied to all with greater ease.
This is because the survey tool itself does all the recruiting and screening for you. As a researcher, marketer, or business owner, you don’t have to worry about whether your survey respondents fit your target survey audience’s qualifications.
Identifying and acquiring respondents are both taken care of by an online survey platform, that is if you choose a potent one. This means you don’t need to have a pre-study interview to vet potential participants. Instead, everything is automated.
A strong online survey platform offers machine learning and artificial intelligence software to run all of its functions and mechanisms. This means, there is little to no manual labor required on your part.

All you need to do in your survey campaign with a strong online survey tool is:
- Set your screener so that your survey targets the correct populations
- Create your questionnaire
- Analyze the survey
Those are the three steps involved in the Pollfish platform. If you’d like to learn how to make your own survey in just 3 easy steps, read the article in the hyperlink.
The online survey platform should handle all the rest. When it comes to running a high-quality market research campaign, there is a lot that goes into staving off poor-quality data and ensuring accurate results.
The following lays out what an AI-powered survey platform can do for your survey campaign:
What a Machine-Learning and AI-Powered Survey Tool Does for YOur Market Research Campaign
A lot is going on behind the scenes of an online survey platform. Luckily, you won’t have to worry about nearly all of them. Regardless, it is crucial to understand the depth of survey SaaS that runs on machine learning and artificial intelligence.
Here’s what to expect from an AI-based survey platform:
- A strong adherence to targeting
- No respondent partially matches the demographic and psychographic screening that the researcher inputs into the platform.
- All survey participants must match 100% of the respondent qualifications. If not, they are disqualified from taking the survey, no matter how close to filling all slots of the criteria they get.


The Audience section on the organic sampling survey platform Pollfish has a rigid adherence to granular respondent targeting.
- Respondent verification
- This mechanism checks respondents for duplicated IDs to ensure each survey completed is done by a unique person, as opposed to one person taking a survey more than once.
- The platform checks IP and MAC addresses, Google Advertising and mobile device identifiers.
- In addition, the platform works with vetted publishers to send unique IDs as an added layer of protection against survey fraud.
- A layer of security in the questions themselves
- In-survey questions are designed as yet another layer of security against survey fraud.
- For example, a question can request respondents to answer a simple math problem.
- Or the survey would include identical questions with the response options re-ordered to verify answer consistency.
- Antibot Policy
- Bots are no match for an AI-powered platform that is designed to disqualify them from taking a survey.
- Zero tolerance for VPNs
- Most businesses and research campaigns put qualifications based on geographies.
- A respondent on a VPN would tarnish any study with filters on who gets to partake in the survey based on location.
- The Pollfish zero-tolerance approach to VPNs ensures the veracity of respondents’ location.
- Removal of incomplete surveys
- This speaks for itself, as surveys are meant to be fully completed. A partially complete survey would provide insufficient data.
- Incomplete surveys are especially problematic in surveys with follow-up questions to past questions, or those seeking more depth to a certain issue.
- Removal of surveys with suspicious activities
- Surveys with any questionable behaviors are rejected.
- This includes the removal of the following:
- Answering open-ended questions with nonsense
- Attempting to sign in from multiple countries/devices at once.
- Taking an inappropriate amount of time on the survey.
- Multiple layers of quality checks
- The survey platform uses a technical layer to perform other quality checks.
- This process includes our technical experts continuously working to avoid survey fraud.
- There are several layers that we use to maintain good data quality. These include checks on the following:
- Hasty answers Check: catches respondents who answer faster than the average time needed to read the questions.
- Reset ID Check: Activates when the respondent answered the same survey previously, but with a different device to avoid the same respondent from taking the survey more than once.
- Gibberish Check: Checks for answers contain nonsensical text. This is the kind of text without real words, such as “jnfjv vdf gre.”

 Avoid receiving gibberish answers thanks to the Pollfish AI-powered survey platform
 - Same IP Participation: Checks if a survey has been completed before within a certain time from the same IP address of the respondent’s device.
- Carrier Consistency: Assures that the carrier of the respondent’s internet service exists in the targeting market.
- Specialized questions to identify those not paying attention
- Aside from a layer of security in all questions, we offer specialized questions that detect poor data quality.
- These include the following question types:
- Red herring questions: Asks questions with odd answers to assure respondents are paying attention.
- Trap questions: Finds who is paying attention to a command, usually one that asks to select a negative response. Responders who choose positive responses will be caught.
- Quality Questions: Similar to red herring questions, they check if respondents read and understand what’s being asked.
- Constant iteration until all quotas are met
- With the agile research approach, the platform doesn’t merely provide speedy insights.
- Instead, it creates constant iterations until all the quotas and the desired amount of completed surveys are met.
- As such, the platform doesn’t cease, or pause (unless you set this command on your dashboard).
- It allows you to gain the proper amount for your sampling pool.
- With this, no survey pool is too large (relative to the necessary sampling size).
How else do research panels compare to an online survey platform?
Respondents can rest assured that they do not need to give away their data. To add to this, they can still be incentivized to take part in a survey study.
An online survey platform does all the heavy lifting in terms of retrieving responses, while in a research panel, the researcher has to make sure that all the participants respond adequately. This is to say that the researchers themselves must check for gibberish answers, questions left unanswered and much more.
This is especially more difficult in focus groups and one-on-one interviews, in which a researcher has to make sure everyone participates in the former, and that the panelists are willing to truthfully answer all the questions in the latter.
An online survey tool also effectively eliminates the need to worry about survey response rates, as it keeps iterating until the preset requirements are met (including the number of respondents).
As such, researchers have plenty to gain for their research needs from using an online survey tool in tandem with a research panel, or even as a replacement for a research panel.
The Ultimate Verdict on the Research Panel for Market Research
A research panel is a useful method for conducting market research, particularly for studying the same group of participants to monitor their opinions and behaviors and changes thereof.
However, a productive market research campaign will rely on using more diverse methods to extract data. This involves using random organic sampling, which forgoes the conditioning and pressures of a research panel.
As such, you should opt for a survey platform that offers RDE, or Random Device Engagement, which, as mentioned earlier on, distributes surveys randomly, across a wide network of digital properties. This includes websites, mobile sites and mobile apps.
With this survey function, the platform does all of the work when it comes to identifying respondents and covering all quotas. That means you don’t need to do anything in this regard, as the platform performs these tasks.
But there’s more.
To piggyback off of the section on the role of the research panel, online surveys and research panels do have some beneficial similarities. For example, they’re both ideal for creating and validating personas.
A research panel can identify a persona over several rounds of interviews/ surveys/ etc., while an online survey tool can conduct further research to find whether those personas are statistically significant.
Thus, these methods work well hand-in-hand when it comes to conducting market research. A strong online survey platform will ensure a synergistic relationship between random sampling surveys and research panels.
It should allow you to survey specific people, such as via email, or whichever digital channel you seek to use. Luckily, there’s the Distribution Link feature, which enables you to do just that.
Frequently asked questions
What is a research panel?
A market research panel includes participants who have willingly opted to participate in a research group regarding a specific subject. These members are pre-screened and pre-recruited.
Why are research panels important in the market research process?
Research panels are essential because they are not anonymous, unlike the respondents who take the surveys incognito. This is important because it allows researchers to find out everything about the members to match answers with the respondents themselves, ruling out chances of inaccuracy.
When should businesses use a research panel?
Businesses should set up a panel to facilitate in-depth research of audiences and their behavioral patterns or conduct a detailed, intimate study on customers. Large research projects that require multiple modes of data collection or market segmentation also work well with a dedicated research panel. You can also use them when building customer profiles.
What are some pros of using a research panel?
Panel members usually have a more advanced understanding of a research topic. Research panels are also easy to conduct in recurring intervals, and researchers do not need to screen information as they would with a new set of participants. In this way, it is faster and more efficient.
What are some cons of using a research panel?
With a panel, participants do not have privacy. They may have to participate in interviews which can be intimidating. This may pressurize a respondent to answer in a particular way, leading to an incorrect response. Research panels are also prone to fatigue, loss of interest, and panel attrition. Also, hiring a research panel is usually costlier as you may have to pay the participants for every session.

Building Brand Purpose with Market Research
Building Brand Purpose with Market Research

As businesses seek to scale, grow and differentiate themselves from others in their field, they’ll need to have their brand purpose on full display.
Making light of your brand purpose is a critical way to show that your brand is mission-driven and exits beyond the shallow purpose of making a profit. Customers, especially the younger generation are fond of brands with a purpose.
In fact, 92% of Gen Z and 90% of Millennial respondents say they would support a purposeful brand, compared with 81% of Gen X consumers.
Consumers from across the globe also view brands that actively display their purpose in a positive light. 64% of global consumers say brands that communicate their purpose are more attractive. 62% want companies to take a stand on the issues they care about.
This article delves into brand purpose, its importance, examples of companies with visible purpose and how to find and build your own through market research.
Understanding Brand Purpose
This concept refers to a brand’s moral reason for being and what it stands for aside from making a profit and other commercial interests. Typically, a business assumes a brand purpose aligned with what its customers believe.
Also called the North Star and the noble purpose of a brand, it largely deals with finding a reason for the brand’s existence and using it to help its consumers.
Brand purpose is essentially the “why” behind a company. This “why” allows the business to show customers the values it holds and the noble cause it hopes to either achieve or contribute to.
A business’s brand purpose can serve as a reflection of the founders’ lives and experiences, what they consider to be gaps in their market or a major change in their market.
A brand’s purpose can be ethical, moral or political in nature, giving customers the chance to do business with a brand that supports a certain cause or way of life.
A brand purpose should not be confused with a brand promise, which is the general expectation a product or service offers to its customers.
Coming Up With a Brand Purpose
When coming up with a brand purpose, consider how your business intends to make the world improve, or at least a component of it. This can involve affecting social obligations for your target market, environment or society at large.
This will resonate with your consumers and their values and give them another reason to patronize you.
Ask yourself the following to begin finding your brand purpose:
- What does your brand stand for?
- Does your business have a mission?
- What does your business strive to do – or commit to never do?
- What values does your brand uphold or plan on upholding?
- How can you use your values as a company to strive towards a goal for the greater good?
Questions like these are at the core of brand purpose. Once you answer these, you can study your customers to probe further.
The Importance of Brand Purpose
A brand purpose goes far beyond appearing conscientious in your market.
First off, a powerful brand purpose will set you apart from the competition. Plenty of business rivals may offer similar products, services and experiences, but they are unlikely to share the same brand value of your brand — or any at all.
A brand purpose is a potent aspect of your business to use for building your reputation and strengthening your brand equity. You can do so by establishing your brand as one that is socially, environmentally, politically or otherwise conscious and caring about issues besides its own bottom line.
In turn, this humanizes your brand. Your business will no longer be seen as merely another provider or another cash cow. Instead, it will be recalled as one with a human conscious, one that cares bout a certain issue and it attempting to reach goals that ultimately benefit society in one way or another.
By improving your reputation and heightening your brand as one not solely concerned about profits, you can thus apply your brand purpose in your branding. You can do this across a wide span of campaigns, from branding to PR to advertising and beyond. Your best bet is to apply it to the main conduit of your communications: your content marketing strategy.
This involves directly mentioning your purpose and alluding to it across your blogs, resources pages, social media, landing pages, videos and any other channel that grants you the opportunity to make consumers aware of your brand purpose.
Finally and most importantly, having a brand purpose makes the brand more appealing to the customers, as they will feel that their spending is making a difference in the world. It will also make them feel like they are a part of something greater than just a customer buying journey or shopping session.
A brand purpose enables your business to connect with consumers on a personal level. This is important, as aforementioned, given that customers are becoming increasingly invested in brands that have a purpose.
In fact, 52% of customers say they are more attracted to buy from brands if they stand for something bigger than just the products and services they sell, especially if it aligns with their personal values.
Moreover, 71% of customers say they prefer to buy from a purpose-driven company over another one, should the cost and quality be the same. What’s more astonishing is that despite the statistics of consumers leaving brands after one bad experience, 72% of consumers say they would forgive a company with a brand purpose if it made a mistake.
The implications of these statistics are major, pointing to higher levels of brand trust in purposeful companies. Additionally, it means that when a customer contemplates a brand with purpose, they are also more inclined to remember it, purchase from it and want to work for it.
In addition, when a customer sees a logo of a purpose-driven brand, they’ll associate it with being compassionate, responsible and ethical.
All in all, when brands exhibit a brand purpose, they are effectively standing out among competitors, improving their reputation, gaining ideas for marketing and branding and resonating with customers and their values.
All brands should therefore strive to be purpose-driven.
Examples of Companies With Brand Purpose
Companies across various sectors have taken up a brand purpose. This has given their customers a much deeper meaner to their brand and offerings.

The following lays out a few examples of companies that actively demonstrate their brand purpose:
- Dove: The personal care company aims to help women discover the value of real beauty and improve self-esteem worldwide. Their #speakbeautiful movement encouraged women to be kinder to themselves and embrace their natural bodies. The brand creates relatable and realistic marketing instead of the highly edited images common in the beauty industry.
- Muji: The Japanese retailer of household items and apparel promotes self-restraint, humility and the natural state of the environment, along with supporting simplicity and moderation. It sustains the latter by offering functional products with a simple design and are practical to use. As for the former, Muji emphasizes reducing production, recycling and packaging waste.
- Crayola: The art supply company works to help parents and teaches foster creativity within children. It enables those in children’s lives to inspire them to be “creatively alive” instead of simply using their products. Crayola had various programs dedicated to this purpose, a mission they attempt to achieve globally.
- Everlane: The American clothing retailer has a threefold brand purpose. It is bent on creating environmentally friendly products, providing high-quality products and being transparent as possible. The company sources only from ethical factories — the kinds that have fair wages and hours. It uses fine materials and brands itself as being radically transparent. When it comes to the latter, Everlane gives information on how much their clothes cost to be made, which materials they used, the labor involved and even the transporting methods.
How to Find and Build Brand Purpose with Market Research
Market research can help you discover the possible themes and nuances of your brand purpose. This is because there are various market research techniques you can use to study your target market, the group of customers most likely to buy from you.
You can begin conducting market research via secondary sources, such as trade magazines, news websites, blogs and competitor websites to see the kinds of purposes your competitors are aligning themselves with.
You can also use these sources to understand which purposes resonate the most with customers and the kinds of campaigns brands in your field and beyond have created based on their brand purpose. This will help you form the onset of your brand purpose.
Next, shift into primary market research by conducting survey research on your target market. This will give you firsthand insights into all of your customers’ thoughts in relation to current issues and popular causes.
Use a trusted online survey platform to reach the correct target market sample. This platform should allow you to extract the exact amount of respondents that you input in the screener, including quotas on various audiences.
Your survey platform should have the option of being able to incorporate multiples audiences in one survey. That way, you can observe different target market segments and customer personas under one survey study, allowing you to analyze the data via the same dashboard.
You should also be able to reach the correct respondents via demographics, behaviors, and even by their specific answers to screening questions.
Ask your respondents about various social issues, from the environment to education and all else. In your survey, you should seek out which issue and which message resonates the most with your target market, along with which elicits the strongest reactions. In this way, you may need to insert elements of emotional marketing.
You should also add A/B testing into your surveys to see which messaging or issues affect your customers the most, along with which they care most about. Remember to conduct market research beforehand, as you’ll need to know your customers before you set out to find your brand purpose.
You can continue surveying customers after you’ve decided on a brand purpose, to find the right messaging and images. Do so with A/B testing, including sequential testing.
Differentiating Your Business
Creating a brand purpose and applying it to various marketing campaigns will differentiate your business and ultimately allow it to survive. But before you insert a brand purpose into your branding, you’ll need to find a strong one that your target market deems important and compelling.
To do so, you’ll need a strong market research platform to host your survey campaigns. Such a platform should run on random device engagement (RDE) sampling, so you can reach customers in their natural digital environments, instead of pre-recruiting them. This removes social pressures in the surveys and will cut back on survey bias.
You should also use a mobile-first platform, since mobile dominates the digital space and no one wants to take surveys in a mobile environment that’s not built for them.
The online survey platform you opt for should also offer artificial intelligence and machine learning to remove low-quality data, disqualify low-quality data and offer a broad range of survey and question types.
It should also allow you to survey anyone. As such, you’ll need a platform with a reach to millions of consumers, along with one that offers the Distribution Link feature. This feature will allow you to send your survey to specific customers, instead of only deploying them across a vast network.
With an online survey platform with all of these capabilities, you’ll be able to motivate your customers into making repeat purchases.

How to Promote Repeat Purchases with Survey Research
How to Promote Repeat Purchases with Survey Research

You’ll need to cultivate repeat purchases from your customers given the weight of customer retention. Even if you operate a B2C retail establishment, your business will greatly benefit from existing customers shopping from your business continuously.
90% of customers are more likely to purchase more, and 93% of customers are more likely to make repeat purchases at companies with excellent customer service.
61% of SMBs report that more than half of their revenue comes from repeat purchases of existing customers, rather than from new customers. These statistics demonstrate how clear the value of repeat purchases is.
However, despite these perceptible benefits, 96% of customers stop doing business with a company due to poor customer service. This damaging statistic proves that almost all customers will not simply make fewer purchases with a business, but abandon it entirely.
As such, brands must elevate their CX and understand their customers to retain customers.
This article explores the concept of repeat purchases, their implications, importance and how to foster it with survey research.
Understanding Repeat Purchases
A self-evident concept, repeat purchases refer to instances of customers purchasing more than once from the same business. This behavior is usually associated with buying from a business multiple times, instead of just twice.
As such, repeat purchases result from customer retention, which is the result of consumer loyalty. There are many building blocks of loyalty, including providing a great customer experience, reasonable prices, product satisfaction, brand equity, brand trust, satisfying all of your consumer preferences and more.
When strategizing how to stimulate repeat purchases, businesses can create various campaigns, from advertising to PR, social media and various others to facilitate repeat purchases through different purchasing methods. This means that although you may have customers who purchase in-store, you can still pique online or phone orders.
For example, assume you have a customer persona who prefers buying via the brick-and-mortar way. They can still be swayed to make an online purchase, should it be compelling enough. You can achieve this by offering a special online promotion, introducing an online rewards program, or appealing to this persona in some other way that makes it tempting for them to buy online.
At any rate, you can forge repeat purchases through omnichannel communications and various purchasing options.
The Importance of Repeat Purchases
Repeat purchases are important for several reasons.
First off, when customers buy from the same company, it is a sign of customer loyalty, which means that not only will your customers continue buying from you, but they will be less inclined to shop from your competitors.
As such, you’ll be drawing in a larger customer retention rate, and as you’ve read across multiple CX, marketing and eCommerce outlets, customer retention is more profitable than acquisition. Various figures prove this, such as the fact that acquiring new customers costs five times as much as keeping existing ones and that selling to existing customers has a success rate of 60-70%, while it is only 5-20% for new customers.
High levels of repeat purchases also point to a low customer churn rate, another necessity for keeping your business afloat, given the need to retain a stream of customers. In addition, once customers churn, it is going to be difficult to bring them back to your business, as they've already made up their minds — and not from hearsay but their experience from being your customers.
If your customers didn’t like your products, they wouldn’t buy them — unless it was due to utter necessity and no other choice. As such, when customers buy repeatedly from you, not only are you lowering your customer acquisition cost due to higher retention, but you’re also building trust around your brand. The more customers buy from you, the more reliable you are perceived to be.
Customers who make repeat purchases are also important given their higher expenditures, as repeat customers spend 67% more than new customers. This isn’t surprising, as retained customers know what to expect from their favorite brand(s), therefore being more liberal with their spending.
Customers who buy from you year after year are critical, as they signify a segment that has the potential or currently carries a high Customer Lifetime Value. This metric relays the worth of customers during their entire relationship with the company. It involves both purchases and the length of a relationship customers have with businesses.
Value also increases in reverse, meaning that a brand appears to be more valuable to customers who make continuous purchases. As such, these purchases exemplify high levels of customer value, which is the perception of what a product or service is worth to a customer versus its alternatives.
All in all, when customers make repeat purchases, they are easier to sell to, improve a brand’s reputation and generate higher overall value for a company.
7 Effective Ways to Increase Repeat Purchases
Businesses can try experimenting with different methods to increase and strengthen customers by making repeat purchases.
The following enumerates 7 methods you can use to increase repeat purchases:
- Offer perks via VIP programs.
- These programs grant elite status to customers who buy more, directly leading to repeat purchases.
- Create referral programs with incentives for current customers that bring in new ones.
- This will whet customers’ interest in staying customers, as they will be rewarded.
- Create discounts and seasonal campaigns to draw in continuous purchases for special occasions.
- This will entice customers to buy repeatedly by buying more than just one kind of product. For example, various Halloween candy or Christmas decor.
- Retarget customers via email marketing.
- Target your customers directly after they make their first purchase via email marketing.
- You can give them the option of subscribing to a mailing list or suggesting similar products now and then.
- Create exclusive deals for customers through rewards programs.
- While creating seasonal promotions is useful, you can extend your deals and discounts by creating rewards programs for customers.
- This directly leads to customers buying more.
- Appeal to customers with marketing personalization.
- No one likes to be marketed to, especially in generic ways.
- Creating personalization makes customers feel seen, heard and far more special than they would as recipients of non-personalized offers and messages.
- Ask for user-generated content.
- This involves content that your consumers produce via using your products and services, which you then feature across your website and other digital properties.
- This method creates bonds between brands and customers, which gives brands an edge in that customers view them as more than just another business.
How to Stimulate Repeat Purchases with Survey Research
Market research is the underlying mechanism for increasing repeat purchases. This is because, to appeal to your customers, you’ll need to understand them at a deeper level. This way, you can properly market to and serve them.
When you understand all of your customers’ desires, needs, aversions and perceptions, you’ll be able to create marketing campaigns that compel them to interact with your brand, as you push them further down the sales funnel until they convert.
There are various market research techniques that you can apply to better understand your customers; this involves gaining insights into customer behavior and your customer’s needs, along with their reactions to your current marketing campaigns.
Wheel secondary market research is a good starting point for learning about your customers, your best bet is to gain insights that are timely and unique to your target. You can achieve this by conducting survey research, a kind of primary research.
Surveys allow you to inquire into any topic, granting you full control over your market research study. You can create surveys for several purposes, as there are various surveys and different types of survey questions you can ask.
The following lists some of the key survey types to use to increase repeat customer spending:
- The customer service survey
- Bad service can deter customers from making any further purchases from you and this survey gauges your customer service.
- The customer retention survey
- Given that repeat purchases indicate retention, use this survey to help you determine your degree of customer retention.
- The CES survey (Customer Effort Score Survey)
- This survey measures customer effort, the degree or amount of effort that a customer puts into a certain interaction with a company.
- The longitudinal survey
- You can measure the opinions your customers have on your products and services by surveying them over longer periods with this kind of survey.
- The product satisfaction survey
- Especially useful for observing attitudes and opinions of your products, this survey allows you to get direct feedback on the products themselves.
- This helps you improve your product features and innovate new ones.
Fueling Your Business
You should always aim to encourage your target market to make repeat purchases. After all, these are the lifeblood of customer retention, yielding all of its benefits. To spur this shopping phenomenon, you’ll need to understand your customers at a deeper level.
You’ll need a strong market research platform to host your survey campaigns. Such a platform should run on random device engagement (RDE) sampling, so that you can reach customers in their natural digital environments, instead of pre-recruiting them. This removes social pressures in the surveys and will cut back on survey bias.
You should also use a mobile-first platform, as mobile dominates the digital space and no one wants to take surveys in a mobile environment that’s not built for them.
The online survey platform you opt for should also offer artificial intelligence and machine learning to remove low-quality data, offer a broad range of survey and question types and disqualify low-quality data.
It should also allow you to survey anyone. As such, you’ll need a platform with a reach to millions of consumers, along with one that offers the Distribution Link feature.
This feature will allow you to send your survey to specific customers, instead of only deploying them across a vast network.
With an online survey platform with all of these capabilities, you’ll be able to motivate your customers to make repeat purchases.

The Best UX Survey Questions to Power Your Surveys
The Best UX Survey Questions to Power Your Surveys

You need to have a reliable set of UX survey questions to power your UX survey. The questions steer the direction of your entire study and campaign and should therefore be woven carefully.
This kind of survey assesses user behavior in relation to your products, services, digital experiences and other user experiences. It is meant to reveal how your consumers experience your offerings firsthand, revealing the difficulty and ease of using your products.
Achieving a good UX is critical for numerous reasons, such as the fact that top companies that lead in UX outperformed the S&P index by 35%. Good UX also has a strong ROI, as every $1 invested in UX, brings $100 in return, indicating an ROI of 9,900%.
You ought to avoid bad UX like the plague, as it even turns away the customers who love a brand. In fact, 32% of customers who love a brand will leave it after just one bad experience.
This article presents various examples of UX questions, their importance in different settings and where in the customer buying journey to use them, so that you are never at a loss of how to fill your UX survey.
The Importance of UX Survey Questions Throughout Different Touchpoints
There are various touchpoints that you should use as the basis of your UX survey questions, as the experiences your users undergo there are critical to study.
By asking questions based on different moments in the buying journey, which include pre and post-sales, you’ll paint an accurate picture of how your consumers perceive all of your UX offerings, whether they are digital or physical.

This includes understanding the difficulty and ease of interacting with your company and using your products, services and experiences. As such, you can use the insights from your UX survey questions to improve across all customer touchpoints, accelerate product innovation and ease the process of your experiences.
Additionally, by studying UX across various touchpoints, you’ll unearth your consumer preferences, see what’s driving demand in your offerings specifically, understand what’s inciting repeat purchases and much more. The key is to ask relevant and specific questions.
Where to Use and Draw Inspiration for UX Survey Questions
While it is important to look at your customer experience as a whole, there are several key moments that you should zero in on to study your UX.
These provide excellent opportunities for asking UX questions, whether they involve questioning users then and there, or following up with a UX survey that asks questions on different points in their UX.
The following lists key moments in the buying journey to pay attention to and use for UX survey questions:
- The first visit(s) to your website, mobile site, app or other digital property
- When: Pre-sales
- After an asset download
- When: Pre-sales
- This is especially useful for B2B consumers.
- Interactions with a UI element or experience
- When: Pre or post-sales
- This can involve quizzes, games, UI marketing collateral and more.
- Subscription sign-ups
- When: Pre (if free) or post-sales (if paid for)
- This can be a free or paid subscription to content.
- Trying a product via an in-home use test
- When: Pre-sales
- This involves the users trying out your products, who are usually recruited for market research purposes.
- For customer development
- When: Pre-sales
- This is a framework used to discover whether a product satisfies the need(s) of a target market, part of the lean startup concept in order to bring a product to market more efficiently.
- After a week or more of purchasing a product or digital asset.
- When: Post-sales
- This is especially necessary if you collected the customers’ email addresses.
- During present usage of service, product or app
- When: Post-sales
- Example: UX with an app, a subscription, a product, a feature, etc.
Examples of UX Survey Survey Questions to Use
Now that you understand the importance of using UX survey questions across different stages in the customer buying journey, along with the specific times to use them, let’s analyze the heart of the survey: the questions.
Aside from being able to come up with reliable UX questions, it is key to be able to organize and label them. This will help you think up and sort new questions as they arise.
The following provides examples of useful UX survey questions to use in your UX survey:
- Have you used the [new tool/feature]?
- Question type: Yes or no
- When to use: After (or during) the first visits to your website, mobile site, app or other digital property
- Follow up? If yes, go to Question 2
- How easy was it to use [new tool/feature] on a scale of 1 (very difficult) to 5 (very easy)?
- Question type: Likert scale
- When to use: As a follow-up to the previous question, during present usage of product, service or app
- Follow up? If the answer is between 3-5, follow-up with an open-ended question
- Was this [asset name] helpful?
- Question type: Yes or no
- When to use: After downloading an asset
- Follow up? Yes, with an open-ended question about how it was helpful.
- What are your first impressions of [UI element]?
- Question type: Multiple-choice, multiple selection and open-ended questions
- When to use: After interacting with a UI element
- Follow up? Yes, with an open-ended question to explain the reasoning
- Did you enjoy [UI element]?
- Question type: Yes or no, or multiple selection ranging from “not at all” to “very much.”
- When to use: After interacting with a UI element
- Follow up? Yes, with an open-ended question to explain this answer.
- How easy was it for you to sign up for this subscription?

- Question type: Likert scale
- When to use: After signing up for a content, SaaS or physical subscription
- Follow up? Yes, with an open-ended question on how to make it easier/better.
- Did this product have any glitches or things you would change?
- Question type: Multiple-choice of “none at all”, “1-3 things, but they aren’t major,” “1-3 things and they’re important,” etc
- When to use: As part of an in-home use test
- Follow up? Yes, with an open-ended question on what the problems the customer incurred or features they would like to see improved.
- What is one thing you would change about [tool/feature]?
- Question type: Multiple-choice, multiple-selection
- When to use: As part of customer development/ product innovation
- Follow up? Yes, with an open-ended question to explain further.
- What are the best / worst parts about using this [product, service, digital experience]?
- Question type: Multiple-choice, multiple-selection
- When to use: After a customer has used a product for a certain amount of time
- Follow up? Yes, with an open-ended question to explain what they like and dislike about their UX.
- Did this [UX/UI element] help you? Was it easy to use?
- Question type: Yes or no or Multiple-choice of “not at all” to “yes, completely.”
- When to use: Interactions with a UI element
- Follow up? Yes, with a multiple-choice question on the easiest and most helpful aspects or those that aren’t.
Excelling in UX
Improving your UX and keeping customers satisfied in this regard goes a long way towards providing customer satisfaction and building consumer loyalty. You should therefore strive to optimize your UX whenever possible.
To do so, you’ll need a strong online survey platform, one that offers advanced skip logic to route respondents to relevant follow-up questions based on their previous answers. It should also make it easy to form a customer journey survey to survey your respondents across their customer journeys.
The best-in-class platform uses random device engagement (RDE) sampling, for reaching customers in their natural digital environments, instead of pre-recruiting them. This removes social pressures in the surveys and will cut back on survey bias.
You should also use a mobile-first platform since mobile dominates the digital space and no one wants to take surveys in a mobile environment that’s not built for mobile devices.
Your online survey platform should also offer artificial intelligence and machine learning to remove low-quality data, disqualify low-quality data and offer a broad range of survey and question types.
Additionally, it should also allow you to survey anyone. As such, you’ll need a platform with a reach to millions of consumers, along with one that offers the Distribution Link feature. This feature will allow you to send your survey to specific customers, instead of only deploying them across a vast network.
With an online survey platform with all of these capabilities, you’ll be able to collect data on cultural awareness and virtually any topic.

Producing Customer Convenience with Market Research
Producing Customer Convenience with Market Research
Despite the generality of its name, you should never ignore customer convenience, as you’re not competing on product and price alone. Customers seek convenience wherever they can find it and they strongly value it in the age of ecommerce.
In fact, 83% of customers rate convenience while shopping as more important to them now compared with five years ago. It is clear to see why customers will choose one brand over another, given the weight of the convenience factor.
On the contrary, an inconvenient customer experience will drive customers away from your business — this isn’t an exaggeration. 97% of customers have abandoned a purchase because the service wasn’t convenient enough.
Convenience is the mainspring of the growth of ecommerce; businesses should therefore work towards developing in all parts of their business.
This article explains customer convenience, its importance, common places to include it and how you can produce it with market research.
Understanding Customer Convenience
Customer convenience may outwardly appear to be a broad term. However, despite that it comes in many forms, customer convenience is bound by the concept of easing all customer-facing activities so that it is painless for customers to do business with a company.
Customer convenience does not merely entail making it slightly easier to buy products from a business. Instead, it involves creating ultimate ease across the entire customer buying journey.
Customer convenience involves making any element in the customer experience, including the digital experience, saving customers time and effort. Although many products, services and other offerings were designed and marketed for their convenience, not all areas of business offer it.
What Determines Customer Convenience
This concept is determined by the ratio of pleasure and pain in the user experience, which in turn, affects customer behavior. The more glaring and latent obstacles customers undergo while engaging with your business, the less convenience your business offers. On the other hand, the more friction-free and seamless your processes are, the greater your customer convenience becomes.
Consider all the interactions and undertakings involved with your business that customers face. Are they all designed with ease of use, speed and general convenience? Chances are, with all the campaigns you’re running, that not every customer-facing facet of your business is optimized to save your customers time and effort.
Given that customers prioritize convenience, your brand should too.
The Importance of Customer Convenience
Customer convenience is important for several reasons.
As the intro mentioned, close to 100% of shoppers value customer convenience. This is even more pronounced by the fact that more than one-third of shoppers feel they have less free time now compared with five years ago. These shoppers seek out businesses that help them save their time and effort.
52% of those shoppers say that half or more of their purchases are influenced by convenience. As such, these statistics prove the importance of customer convenience, as it influences purchases and customer buying behavior. Customers are more inclined to buy from businesses that offer convenience, whether it is retailers offering various sizing options, or several delivery options.
As such, customer convenience affects how customers make buying decisions, including what products to buy, what services to get and with which businesses to engage with. Businesses should thus cater to any convenience-related whims and expectations that customers may have.
To achieve this end, they should remove any pain points or causes of discomfort across their customer experience. This involves digitally, physically and across various other customer touchpoints, such as on the one.
When it is easy for customers to get the information they need and to complete a purchase with you, not only will they be more inclined to buy from you, they’ll also be happier, owing to the convenience you provided. As such, convenience is a vital factor in customer satisfaction.
Satisfaction is a key factor in patronage and when customers are constantly satisfied, then you’ll earn their loyalty, which in turn yields customer retention and finally, customers with a high Customer Lifetime Value (CLV). Building up to the status of a high CLV requires the starting point of delivering customer convenience.
As such, creating customer convenience is a necessary long-term strategy for growing your business.
Common Ways to Create Customer Convenience
To reiterate, customer convenience exists in many forms. You should forge customer convenience whenever possible, not just during a transaction or a point of sale. This is because it exists in five dimensions of service: time, place, acquisition, use, and execution.
Aside from service, there are also several other key instances in the customer experience that require establishing customer convenience. These involve various marketing and UX concepts.
The following lists the various common ways you can use to create customer convenience, along with examples on how to create convenience in each category:
- Usability
- This involves the core of convenience, referring to the ease of using something.
- This can involve using the product, a service, or a digital experience,
- Digital experiences involve digital products, content and mechanisms for ordering, purchasing or subscribing to something.
- Example: Create convenience in the checkout with a one-click purchase capability
- Location
- Create products and services close to the customer or that the customer can access quickly.
- For example: advertising to a target market segment that lives near the location of your shop or where your products/services are sold.
- Create products and services close to the customer or that the customer can access quickly.
- Saving Time
- Saving time is one of the major components of customer convenience. No one likes having too much of their time taken up, not least by interacting with a business.
- Assure your website, mobile site and apps quickly load.
- Create a quick checkout and agility in all of your digital experiences.
- Personalization
- Personalize everything to show customers you understand them and don’t merely offer generic communication.
- Use marketing personalization in all of your marketing, outreach and communications practices.
- Make sure to customize your marketing content, as well as your products to your target market’s liking.
- Example: an online service or machine with menus that customers can use to personalize their experience.
- Scheduling
- This involves arranging appointments, meetings, repairs, calls with customer support and even conducting market research at times most convenient for your customers, or, in the case of market research techniques, your respondents.
- Offer various scheduling options, include custom scheduling, so that your customers choose the exact time and date of their appointments, etc.
- Delivery
- Always offer delivery services to your target market
- Ensure you offer delivery to all neighborhoods of a city, not just the main ones.
- There are various restaurants and food service businesses, for example, that only deliver to Manhattan, but not other boroughs.
- Offer various delivery options.
- This involves expedited delivery and contactless delivery options.
- Portability
- This refers to mobility and the ease of carrying items around.
- To remain competitive, create items that weigh less, are more compact and are easy to carry.
- For example, air conditioners are known for being unwieldy; you can keep your business competitive by making them portable.
- Automation
- This involves computers and software performing work that a human would otherwise do.
- When it comes to market research, this includes using a provider that runs on artificial intelligence.
- Certain products for everyday use can also be automated, for example, a dishwasher, soap dispenser, etc.
How to Create Customer Convenience with Market Research
Market research opens doors to your customers, from being able to segment your customers with market segmentation, filtering them further by creating customer personas and studying them for various campaigns.
Since customer convenience is centered on the customers, gleaning insights from the customers themselves is the most ideal way to produce it. Market research brings you these insights and the fastest and most convenient way to reach these insights is through conducting a survey campaign.
When you apply custom research, as opposed to syndicated research, you are entirely in control of your market research campaign. You’ll be able to create surveys by extracting the exact target audience you need, build your own questionnaires and qualify respondents on categories that go far beyond age and gender.
When creating your questions, you’ll be able to quiz your customers on a host of convenience-related matters. The surveys you create will uncover a host of customer intelligence, including consumer preferences on various aspects of your business.
This grants you firsthand insights into how your target market defines customer convenience for itself. By understanding your customers’ preferences, wants, needs and opinions, you’ll be able to inject convenience across all areas of your business, from the workings of your products, to customization, to UX and much more.
Here are a few key ways to create customer convenience through market research:
- Use a reliable online survey platform to complete the following steps.
- Begin by segmenting your customers via market segmentation using an online survey platform.
- You can create as many segments and subsegments as necessary for your campaigns.
- Create customer personas for granular representations of your actual customers.
- Survey your customers on customer satisfaction to discover gaps in your service, communications and overall CX.
- They will provide opportunities to improve your offerings and forge convenience.
- Create surveys with themes from the prior section on the common ways to produce customer convenience.
- To learn how difficult it is for your customers to interact with your company with the Customer Effort Score or CES survey.
- This shows the degree of difficulty a customer has experienced to try to get an issue resolved. It also refers to the ease (or difficulty) a customer had with a certain touchpoint with a company.
- Create campaigns to improve the gaps and points of friction you discovered from doing survey research in Step 3.
- You may want to conduct causal research and experimental research to determine if your changes correspond with customer happiness and truly hammer out convenience.
- Probe further by creating effective surveys on the campaigns you’ve created in Step 4.
- Here, you should assess the effects of the changes you’ve made and whether they’ve been able to foster customer convenience.
- Iterate what customers find convenient and remove all areas of difficulty that you discover from your survey studies.
- You can create follow-up surveys to continue optimizing your customer convenience.
Keeping Your Customers Comfortable at all Times
The way to stay ahead of the competition is to keep customers returning to you as opposed to patronizing your competitors. In order to stimulate customer loyalty and this kind of retention, you’ll need to produce customer convenience whenever possible.
Market research provides an avenue for creating customer convenience, as it involves studying your customers to understand them at a deep level. Given that convenience can exist in many forms, market research allows you to understand which are preferred by your customers, as well as what they find inconvenient in their customer experience.
In this way, customer convenience serves as the antidote to customer attrition, allowing you to keep more customers happy and most importantly, retain more customers. To do so, you’ll need to use a strong market research platform.
Such a platform should run on random device engagement (RDE) sampling, allowing you to reach customers in their natural digital environments, instead of pre-recruiting them. This removes social pressures and will cut back on biases.
You should also use a mobile-first platform, as mobile dominates the digital space and no one wants to take part in a difficult mobile session.
The platform you opt for should also offer artificial intelligence and machine learning to remove low-quality data, offer a broad range of survey and question types and disqualify low-quality data.
It should also allow you to survey anyone. As such, you’ll need a platform with a reach to millions of consumers, along with one that offers the Distribution Link feature.
This feature will allow you to send your survey to specific customers, instead of just deploying them across a network.
With an online survey platform with all of these capabilities, you’ll be able to extract quality customer data and forge customer convenience at every turn.

Diving Into the UX Survey to Improve User Research and UX
Diving Into the UX Survey to Improve User Research and UX

You’ll need to use a UX survey when conducting user research and all things relating to the use and functionality of your offerings. Whether you’re working towards improving the user experience (UX) of a product or a page on your website, the need to offer a superb UX is critical.
88% of users won’t return to a website after a bad user experience. Needless to say, you’ll be losing most of your website traffic and all of its implications, such as a loss of brand engagement and conversions, when your UX is less than stellar, much less when it is below par.
On the contrary, providing a good UX has substantial benefits. For every $1 you invest in UX leads to a return of $100. That is equivalent to an ROI of 9,900%.
Due to the weight UX carries and developments across various user-facing interfaces, you must always strive to improve your UX.
This article explains how to do just that, as it covers the UX survey, its importance, when to use it, how to create one and more.
Understanding the UX Survey
A UX survey is a survey designed to collect customer feedback to assess user behavior as it relates to your products, services, digital experiences and other user experiences.
The purpose of this survey is to grant you insight into how your consumers are experiencing using your offerings. This is critical given that it gives you direct access to the effectiveness, ease, difficulty and other associations your users have with your various properties.
A user experience survey can extract both quantitative and qualitative market research about a user’s interactions with a website, a digital product and all others. The data from this survey can be used to support and complement other Martech and SaaS integrations, such as website analytics and UX metrics.
As such, you can use it alongside methods such as A/B testing, heatmaps, usability testing, and more.
The feedback you receive from this kind of survey shows you exactly what customers are experiencing, what works in your UX, what needs improvement and what should be completely scrapped. This way, you’ll know directly from your users what changes you should prioritize.
There are various instances in the customer buying journey where you should study user behavior. This survey is the ideal method to use as part of your study, as it gives you timely insights into your UX.
The Importance of the UX Survey
The UX survey is important for several reasons for designers, end-users and ultimately, your business. This kind of survey is the ideal tool for using data for decision-making for various UX-related campaigns.
It gives firsthand insight into the usability of your various offerings from your consumers themselves. While it is important to give your experiences a test by your team and its designated participants, it is the experiences and opinions of your users that ultimately matter.
The UX survey is a crucial tool for the methodical study of target users, also known as user research. It provides access to your users’ needs and pain points. This way, your team becomes aware of how to improve various offerings, including what to keep as it is.
As such, this survey aids product designers, web developers, UX designers and other creatives with insights on how to establish the most sought-after designs, the kind that improves the user experience on many fronts.
User researchers can use the UX survey to expose problems they didn’t know existed in their UX and discover design solutions. In this way, this survey helps uncover various design opportunities designers can assuredly take, rather than basing their decisions on intuition alone.
Aside from aiding the design process, businesses can use the knowledge they derive from this survey to innovate product features, updates and even create new products.
The UX intelligence that business owners get from this survey allows them to make informed decisions and avoid running into past bugs and glitches.
The UX survey doesn’t simply allow businesses to unearth what their users want, need and are frustrated with. Instead, it provides these insights by first allowing you to discover who your customers are since this is a kind of consumer survey.
As such, you can use it to ask questions that contextualize their usage of your products and experiences by asking them about their customer buying behavior, lifestyle, needs and much more.
In short, the UX survey provides a window into how customers interact and experience your products, services and digital properties. It allows you to access all of their thoughts regarding your UX so you can make informed and agile improvements.
When to Use a UX Survey
There are various times in the customer journey when you should apply this survey. These include both post-sales and pre-sales periods and activities. It is evident why you should probe into your UX after your customers buy from you.
As for pre-sales interactions, these are also key instances to study your users, as they show what your potential customers in your target market need and feel in regards to their UX with your company. In this way, their UX before making a purchase is key for building brand awareness and brand equity.
It is also significant to building their brand trust— if they buy from you after their experiences. First impressions are essential, so their UX with your business can also be the deciding factor in becoming a customer or bouncing/ patronizing your competitors.

Here are the several key times to implement a UX survey:
- During their first visit(s) to your website, app, or other digital property
- Pre-sales
- After your users download one of your assets
- Pre-sales
- This is especially useful for B2B consumers.
- After your users interact with a UI element or experience
- Pre or post-sales
- This can involve quizzes, games, UI marketing collateral and more.
- After your users signed up for a subscription
- Pre (if free) or post-sales (if paid for)
- This can be a free or paid subscription to content.
- After users try your product via an in-home use test
- Pre-sales
- This involves the users trying out your products, who are usually recruited for market research purposes.
- For customer development
- Pre-sales
- This is a framework used to discover whether a product satisfies the need(s) of a target market, part of the lean startup concept to bring a product to market more efficiently.
- A week or more after customers have purchased a product or digital asset.
- Post-sales
- This is especially necessary if you collected the customers’ email addresses.
- During the present usage of a service, product, or app
- Post-sales
- Example: UX with an app, a subscription, a product, a feature, etc.
How to Create a UX Survey
Creating an insights-rich UX survey involves more than just coming up with a few questions. Instead, there is a process of best practices you should heed to reap the best results from your survey.
These will ensure your respondents stay engaged in the survey and you extract relevant UX-related data.
The following explains the key steps to take when creating a UX survey:
- Begin by focusing on a UX problem you may need to solve.
- If you don't know what the problem is yet, come up with preliminary questions to identify your users' pain points to find any UX issues they’ve experienced.
- Begin with close-ended multiple-choice questions before probing further with follow-up questions.
- For example: Have you used the [offering]?
- If yes, follow up by using advanced skip logic to ask: How easy was it for you to use [offering] on a scale of 1 (very difficult) to 5 (very easy)?
- Use the following more specific types of survey questions in your UX survey:
- Task-driven feedback questions open-ended questions. Example: Tell me about your experience using your current fitness app.
- Expectations and impressions open-ended questions. Example: What is your favorite feature?
- Follow-up questions Example: How would you rate your experience of the app?”
- Keep your survey quick to complete and focused on one area of UX.
- Too many will confuse, bore or irritate the respondents.
- It is also best to hone in on one experience as a means of dividing and conquering and providing full attention to one issue.
- Analyze your results by sharing your findings with your team.
- Improving UX is a team effort.
- Use a survey platform that makes it easy to partake in data democratization.
Giving Your Target Market the Best User Experience
Closing off, it is important to not only understand your customers, but also their particular user experience. This gives you massive insights into design, product innovation, content marketing strategy.
As such, you should conduct a UX survey, but only on a potent market research platform. You wouldn’t want to waste your time and efforts on a less-than-stellar platform.
You’ll need a strong online survey platform, the kind that runs on random device engagement (RDE) sampling, which enables you to reach consumers in their natural digital environments, instead of pre-recruiting them. This removes social pressures and will cut back on biases.
You should also use a mobile-first platform since mobile dominates the digital space and so many of your respondents will find your survey while using their mobile devices.
The platform you opt for should also offer artificial intelligence and machine learning to remove low-quality data, offer a broad range of survey and question types and disqualify low-quality data.
Most importantly, it should allow you to survey anyone. As such, you’ll need a platform with a reach to millions of consumers, along with one that offers the Distribution Link feature. This is especially important in the case of UX surveys, as you’ll need to send your survey to specific users based on what product or service they interacted with.
When you use an online survey platform with all of these capabilities, you’ll be able to perform quality user research and reach millions with your UX survey.

Using Customer Service Survey Questions to Complement Your Survey
Using Customer Service Survey Questions to Complement Your Survey

All brands should carefully construct their customer service survey questions, as the questions make up the core of any survey. Thus, the effectiveness of this survey largely depends on the questions you use.
Brands use the customer service survey to understand and improve all instances that involve their customers receiving some form of customer service. Customer service should not be a secondary concern for any organization, as the success of a business largely depends on providing good customer service.
As a matter of fact, 58% of American customers will switch companies because of poor customer service. This would be especially devastating for businesses who work towards strengthening other key aspects of their company, such as the product or UX, proving that you shouldn’t cast aside customer service.
In contrast, 89% of customers are more likely to buy from the same company again after a positive customer service experience. It’s evident that maintaining good customer service has tangible benefits.
This article observes customer service survey questions, presenting key examples of each type so that you can correctly craft them in your survey with ease.
Common Types of Customer Service Survey Questions
You can survey your customers about any touchpoint or experience relating to customer service in this survey type. At times, you’ll notice that these involve other key aspects customers face in their customer buying journey.
You should expect to deal with other matters as customers usually receive customer service in relation to some issue when they’re not using it to ask general questions.
There are several key points in the customer journey that are most apt for sending the customer service survey to your customers, whether they are loyal buyers or casual browsers. As such, you should form your survey questions around these instances.
The following sections provide examples of substantial customer service survey questions to use in your customer survey.
Customer Service Survey Questions to Use Before They Go to a Store
Sometimes customers will be in talks with customer service representatives before physically visiting a store or other establishment. You should survey them after they received this customer service that led them to take a trip to your store.
- On a scale of 1-10, how satisfied are you with the customer service you received?
- Question type: Scaled from extremely dissatisfied to extremely satisfied
- Did the representative help you find the store?
- Question type: Likert scale from Not at all to I wouldn’t have found it without the representative’s help.
- Did the representative help you get to the store?
- Question type: Likert scale from Not at all to the representative gave me sufficient assistance in getting to the store.
- Did the representative answer all of your questions about the store?
- Question type: Matrix question from No to the representative answered all of my questions.
- Which question or concern did you feel the representative didn’t fully answer?
- Question type: Open-ended question
- A follow-up question to the previous
- How else could we have assisted you in getting to the store?
- Question type: Open-ended question
Customer Service Survey Questions to Use As Customers Are Being Helped
There will be times in which it is best to survey customers as soon as they receive their customer service. Sometimes, this may be in the midst of the session (towards its end). This is important as their customer service experience will be fresh on their minds. In order to do so, preface the customer service session by mentioning the survey.
You should also tell the customers the importance of completing it ASAP. In this case, it may be useful to offer survey incentives.
- On a scale of 1-10, how satisfied are you with the customer service you received?
- Question type: Scaled from extremely dissatisfied to extremely satisfied.
- Did you receive all the information you needed?
- Question type: Yes or no
- What else did you need more information on that you didn’t receive?
- Question type: Open-ended question
- A follow-up question to the previous
- How comfortable were you speaking with the customer service representative?
- Question type: Likert scale of Extremely comfortable to extremely uncomfortable
- Rate the following statement: the customer service representative spoke with you in a polite manner.
- Question type: Matrix scale of Extremely agree to extremely disagree
- Was there anything you didn't like about your customer service experience?
- Question type: Likert scale of No, I was satisfied with everything to I didn’t like any aspect of the service
- Was the customer service representative able to resolve your issue for you?
- Question type: Yes or no
- If no, follow up with: Do you still have this issue? Or: what else can we do for you to help resolve your issue?
- What would you change about your recent customer service experience?
- Question type: Open-ended question
- Do not use this question if the answer to the previous question was NO, I was satisfied with everything
Customer Service Survey Questions to Use After a Purchase
Whether your customers make an in-store or online purchase, this is an appropriate time to survey them on customer service. After all, many customers rely on customer service before finally buying. This may have been months, weeks or even seconds leading up to customers making a purchase.

- Did you receive any help today?
- Used best in: in-store and other brick-and-mortar settings
- Question type: Yes or no
- How did you receive help?
- Used best in: in-store and other brick-and-mortar settings
- Question type: Multiple-choice and multiple-selection
- Who helped you today?
- Used best in: in-store and other brick-and-mortar settings
- Question type: Multiple-choice
- The customer service representative did a fantastic job helping me find what I needed.
- Used best in: in-store and other brick-and-mortar settings
- Question type: Likert scale from Extremely disagree to extremely agree
- Did you receive any help in making your purchase today?
- Used best in: digital purchases
- Question type: Yes or no
- How did you receive customer service leading up to this purchase?
- A follow-up question to the previous
- Used best in: digital purchases
- Question type: Multiple-choice and multiple-selection
- If they select multiple answers, follow up with questions about their preferred method of receiving customer service and why.
- How would you rate the customer service you’ve received on a scale of 1-10?
- Used best in: in-store, brick-and-mortar settings and after digital purchases
- Question type: Scaled question
- How much did the customer service you received help you in making your purchase?
- Used best in: digital purchases
- Question type: Likert scale of not at all to I wouldn’t have made the purchase without it
Customer Service Survey Questions to Use When Customers Miss a Scheduled Session
There will be times when you encounter customers who have scheduled a customer service or support session and missed it, either by opting out officially or by simply not showing up.
Showing up can refer to in-person services, as well as digital and phone services. In these cases, you should use customer service questions to get to the bottom of the situation and prevent future such cases.
- Did you miss your scheduled customer service session intentionally?
- Question type: Yes or no
- If yes, what was the main reason behind your absence?
- Question type: Multiple-choice
- A follow-up question to the previous
- Use answers specific to the nature of the appointment, along with general ones, such as:
- My issue was resolved.
- Someone else helped me.
- I do not wish to receive customer service from you.
- I figured out how to resolve this issue without getting help from you.
- I’ve gotten help in the past and used that knowledge to fix my issue.
- Would you like to schedule another [name of your customer service session]?
- Question type: Yes or no
- If no, why not?
- A follow-up question to the previous
- Question type: Multiple-choice with an open-ended answer option
- Use answers specific to the nature of the appointment, along with general ones, such as:
- My issue was resolved.
- Someone else helped me.
- I figured out how to resolve this issue without getting help from you.
- I don’t have the time.
- I do not wish to receive customer service from you due to a poor experience in the past.
- Follow up by asking about the nature of this experience with an open-ended question.
- I try to avoid unnecessary customer service sessions.
Customer Service Survey Questions to Use After They Made a Complaint
Some customer service sessions involve customers reaching out to a business — but not to get assistance, but to complain. Whether it is in-person, over the phone, or through a Voice of Customer (VoC) program, many customers won’t shy away from airing their grievances.
While this may appear negative and undesirable, this kind of feedback is valuable for avoiding any similar issues with the same or other customers in the future. No business is perfect, whether in its products or customer satisfaction. Complaints help you steer your business in the right direction.
The key is to use the proper questions.

- How well did the customer service representative help you address your issue and how to resolve it?
- Question type: Likert scale from Extremely poorly to extremely well
- What can our customer service representative do to improve your service in the future?
- Question type: Open-ended question
- This can be a standalone question, or used as a follow-up to the previous question, if the customer’s answer is on the lower end of the scale.
- Is there anything you would suggest we do to address, resolve or improve your issue?
- Question type: Open-ended question
- On a scale of 1-10, how satisfied are you with the customer service you received?
- Question type: Scaled from extremely dissatisfied to extremely satisfied.
- Do you have any other comments or suggestions about the customer service you received today?
- Question type: Open-ended question
Excelling at All Customer Service Endeavors
Excelling at customer service involves surveying your customers at appropriate times, with appropriate questions on hand. The above questions provide examples of how to survey customers during various instances in the customer service process.
However, aside from using the correct questions, you’ll also need to use a strong online survey platform to carry out all your survey research.
First, you’ll need a platform that offers advanced skip logic in your questionnaire. This feature routes respondents to relevant follow-up questions based on their answers to a preliminary or previous question. Given the nature of the questions in this article, and survey questions in general, you’ll need to have this functionality.
Additionally, such a platform should be mobile-first, since mobile dominates the digital space and many of your qualified respondents will be on their mobile phones.
Most importantly, the survey platform should allow you to survey anyone. As such, you’ll need a platform with a reach to millions of consumers, along with one that offers the Distribution Link feature. This is especially important in the case of the customer service survey, as it involves specific customers and their feedback, as opposed to anyone in your target market for a market research study.
When you use an online survey platform with all of these capabilities, coupled with these questions, you’ll be well adept at collecting customer service data and outperform all future customer service endeavors.