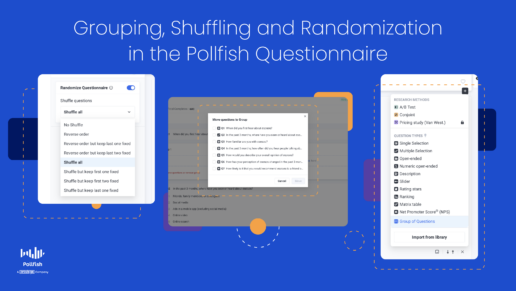
Grouping, Shuffling and Randomization in the Pollfish Questionnaire (2022 Update)
Grouping, Shuffling and Randomization in the Pollfish Questionnaire (2022 Update)
As many researchers learn early on, it can be hard to limit bias in surveys which has negative consequences on the quality of data.

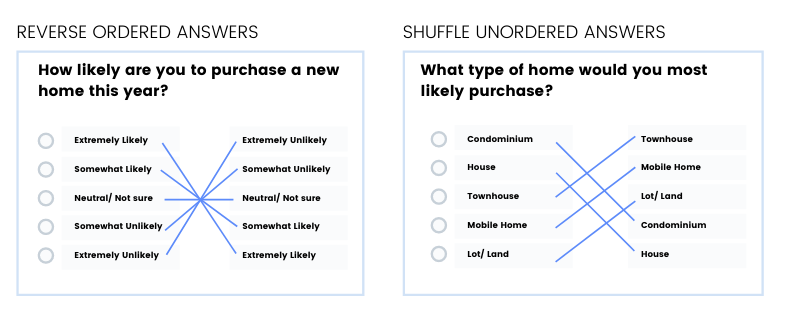
Some best practices for minimizing bias include randomization of questions and the distribution of the questionnaires themselves to reach a diverse audience. Shuffling unordered answers or reversing the order of a scale has also been shown to reduce bias by displaying clear, but differentiated answer options to respondents.
Although Pollfish has supported shuffling and grouping within individual questions, we have recently released the ability to fully randomize your questionnaire. You can shuffle groups of questions and even shuffle the questions within the group for even more randomized survey opportunities.
Here’s how to apply it in your next survey.
Grouping Questions in Pollfish
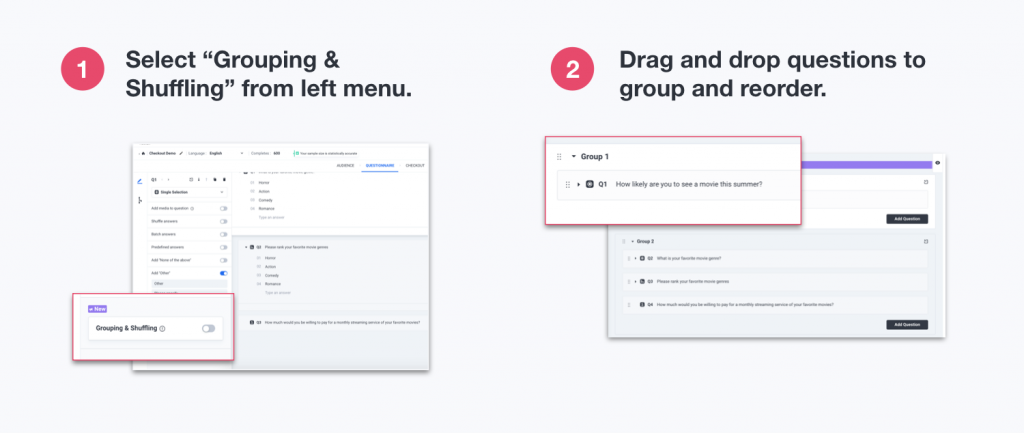
When you visit the questionnaire section of your Pollfish dashboard, you'll see we offer new randomization capabilities. Here, you’ll be able to assign questions into groups on the questionnaire.
This can be helpful for managing your survey in specific sections, for example, if you wanted to first investigate behavior before diving into specific interests.
There is no need for a group to contain any certain number of questions. A “group” can contain a single question if needed, however if Grouping is applied to the questionnaire, every question will need to be assigned to a group.
You can manually re-order the groups or the questions within the groups by dragging and dropping, adding or deleting questions as you would in a regular Pollfish survey.
Keep in mind that when you delete a group, you may also delete the questions within the group by selecting “Delete All.” If you’d like to remove the grouping feature but keep your questions, make choose the option that says “Delete Group Only.”
Shuffling and Randomizing Questions in Groups
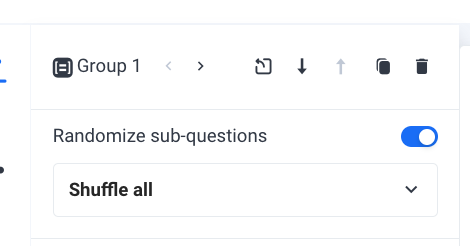
The groups themselves and the questions within the group can be shuffled randomly or reversed in order to reduce bias without disrupting the logical flow of the questionnaire.
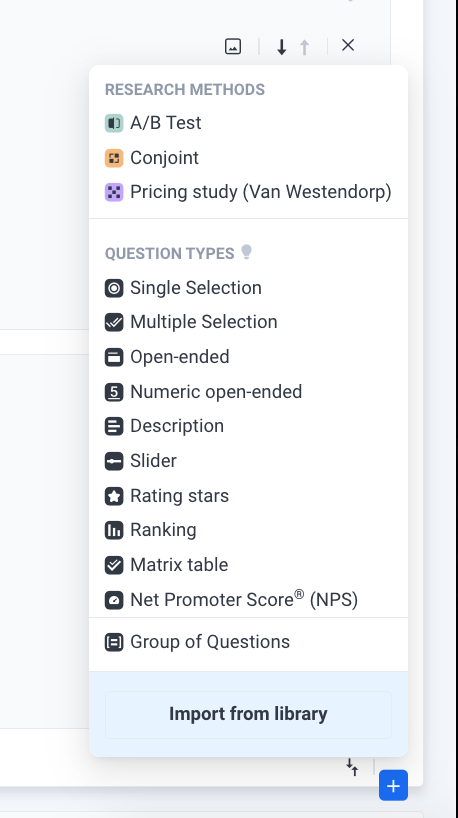
However, there is no ''Grouping and Shuffling'' as an aggregate option anymore. Instead the option has been divided into ''Randomize Questionnaire'' (located on the left side) and Group of Questions (located at the bottom of the Question type drop-down menu).
A group can also be “fixed” while other groups are shuffled. For example, perhaps you want to provide a description before a group of questions that will provide context. In this case, you can choose to put a description question-type in a group and shuffle the remaining groups in your questionnaire.
Don’t forget that you can (and should) include shuffling and reverse order options on your individual questions as well, adding to even more randomization and cleaner data.
Originally, we had 3 main ways to shuffle:
- Shuffle the answers in an individual question
- Shuffle groups of questions in your questionnaire
- Shuffle the questions within a group
But now, there are more options for randomizing questions.
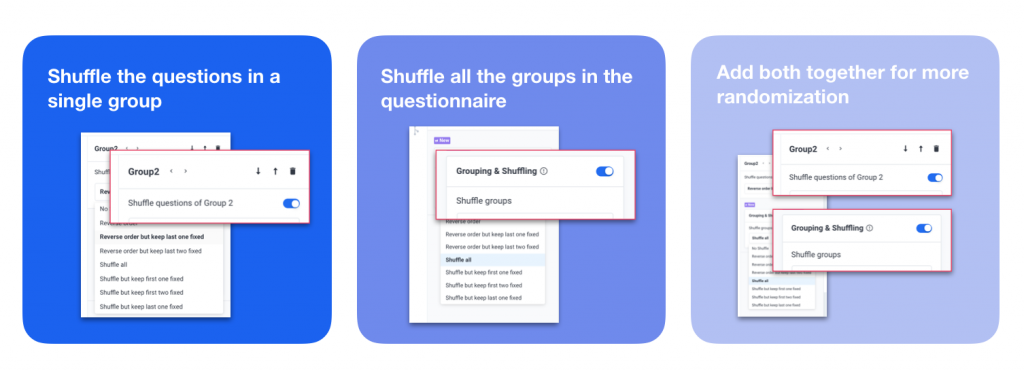
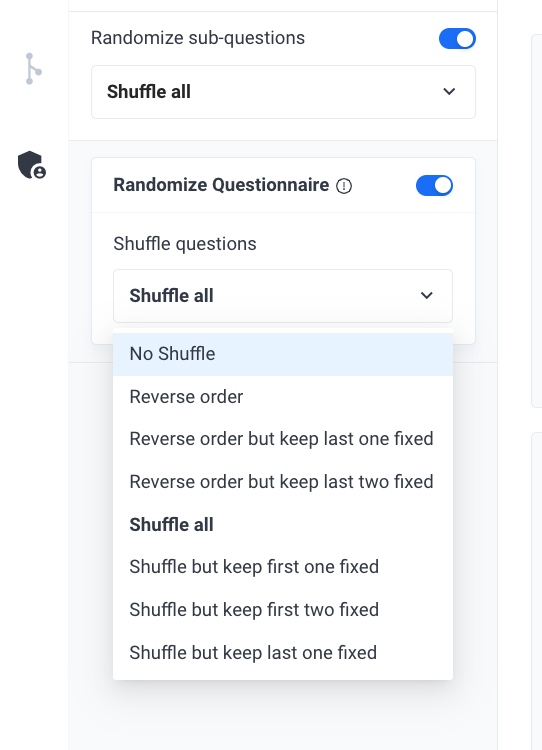
You can enable Randomize Questionnaire and select Shuffle All, to shuffle a group of questions with the rest of the questions. If you select the group, you have an additional option; you can randomize the questions within the group. When you turn off the Randomize Questionnaire toggle and shuffle the sub-questions, the platform only shuffles the questions within a particular group, the rest of the questions won't be shuffled.
Essentially, you can shuffle anything you choose while leaving certain questions fixed.
Here's how else you can shuffle on Pollfish:
- Shuffle but keep first one fixed
- Shuffle but keep first two fixed
- Shuffle but keep last one fixed
- And many other ways!
Pollfish Question Randomization Capabilities
Now, it's time to see exactly what our question randomization options look like on the Pollfish platform. To get a visual representation of the functions mentioned in the previous section, look no further.
The following images show how we're offering randomization capabilities on our platform:
Randomize Questions
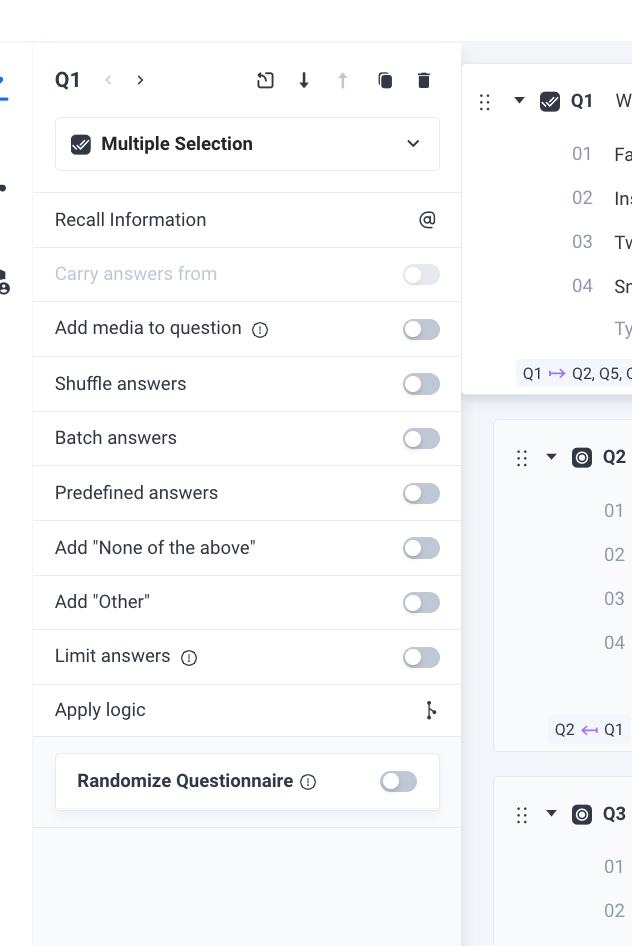
Randomize Question Options
Randomize Sub-Questions
Groups of Questions
Adding logic to groups: The Van Wesendorp Pricing Meter and A/B testing (2022 update)
Although grouped questions didn't originally include skip logic, the product team has been hard at work to include this feature. Thus, advanced skip logic will support grouped and shuffled questions, as well as allow for A/B testing, a critical and useful feature in advertising effectiveness surveys and more.
You can now use advanced skip logic when a respondent exits a group or an A/B test. You can also use it with the Van Westendorp Price Sensitivity Meter. This is a pricing model that provides data in regard to consumer price preferences. It is used to determine customers’ willingness to pay a range of prices.
This meter takes the form of a graph, which visualizes ratings on price and value from respondents. This data is presented as responses to survey questions that focus on the prices of different products and services.
Thus, when a user exits a group via the A/B testing or Van Westendorp features, you can route them to a specific question.

Closed-Ended Vs Open-Ended Questions: Everything You Need to Know (2022 Update)
Closed-Ended Vs Open-Ended Questions: Everything You Need to Know (2022 Update)
In a survey, information is collected from respondents using closed-ended or open-ended question types, which can present themselves in a variety of different ways. Oftentimes questionnaires include a healthy mix of both.

What are closed-ended and open-ended survey questions?
Closed-ended questions are those that offer a limited selection of answers to choose from, such as a single or multiple-selection question, matrix, or scaling question type.
Open-ended questions are questions that allow a freely-written response to be added. This can be anything from a single word to a short answer. Sometimes they exist within a closed-ended question as a way to provide supplemental text to an answer that doesn’t fit the given options.
Typically, closed-ended questions are used to answer “what” questions whereas open-ended survey questions are used to answer “why” questions.

Automating Text Insertion in Pollfish Surveys with the Recall Information & Carry Answers From Features
Automating Text Insertion: Using the Pollfish Recall Information & Carry Answers From Features
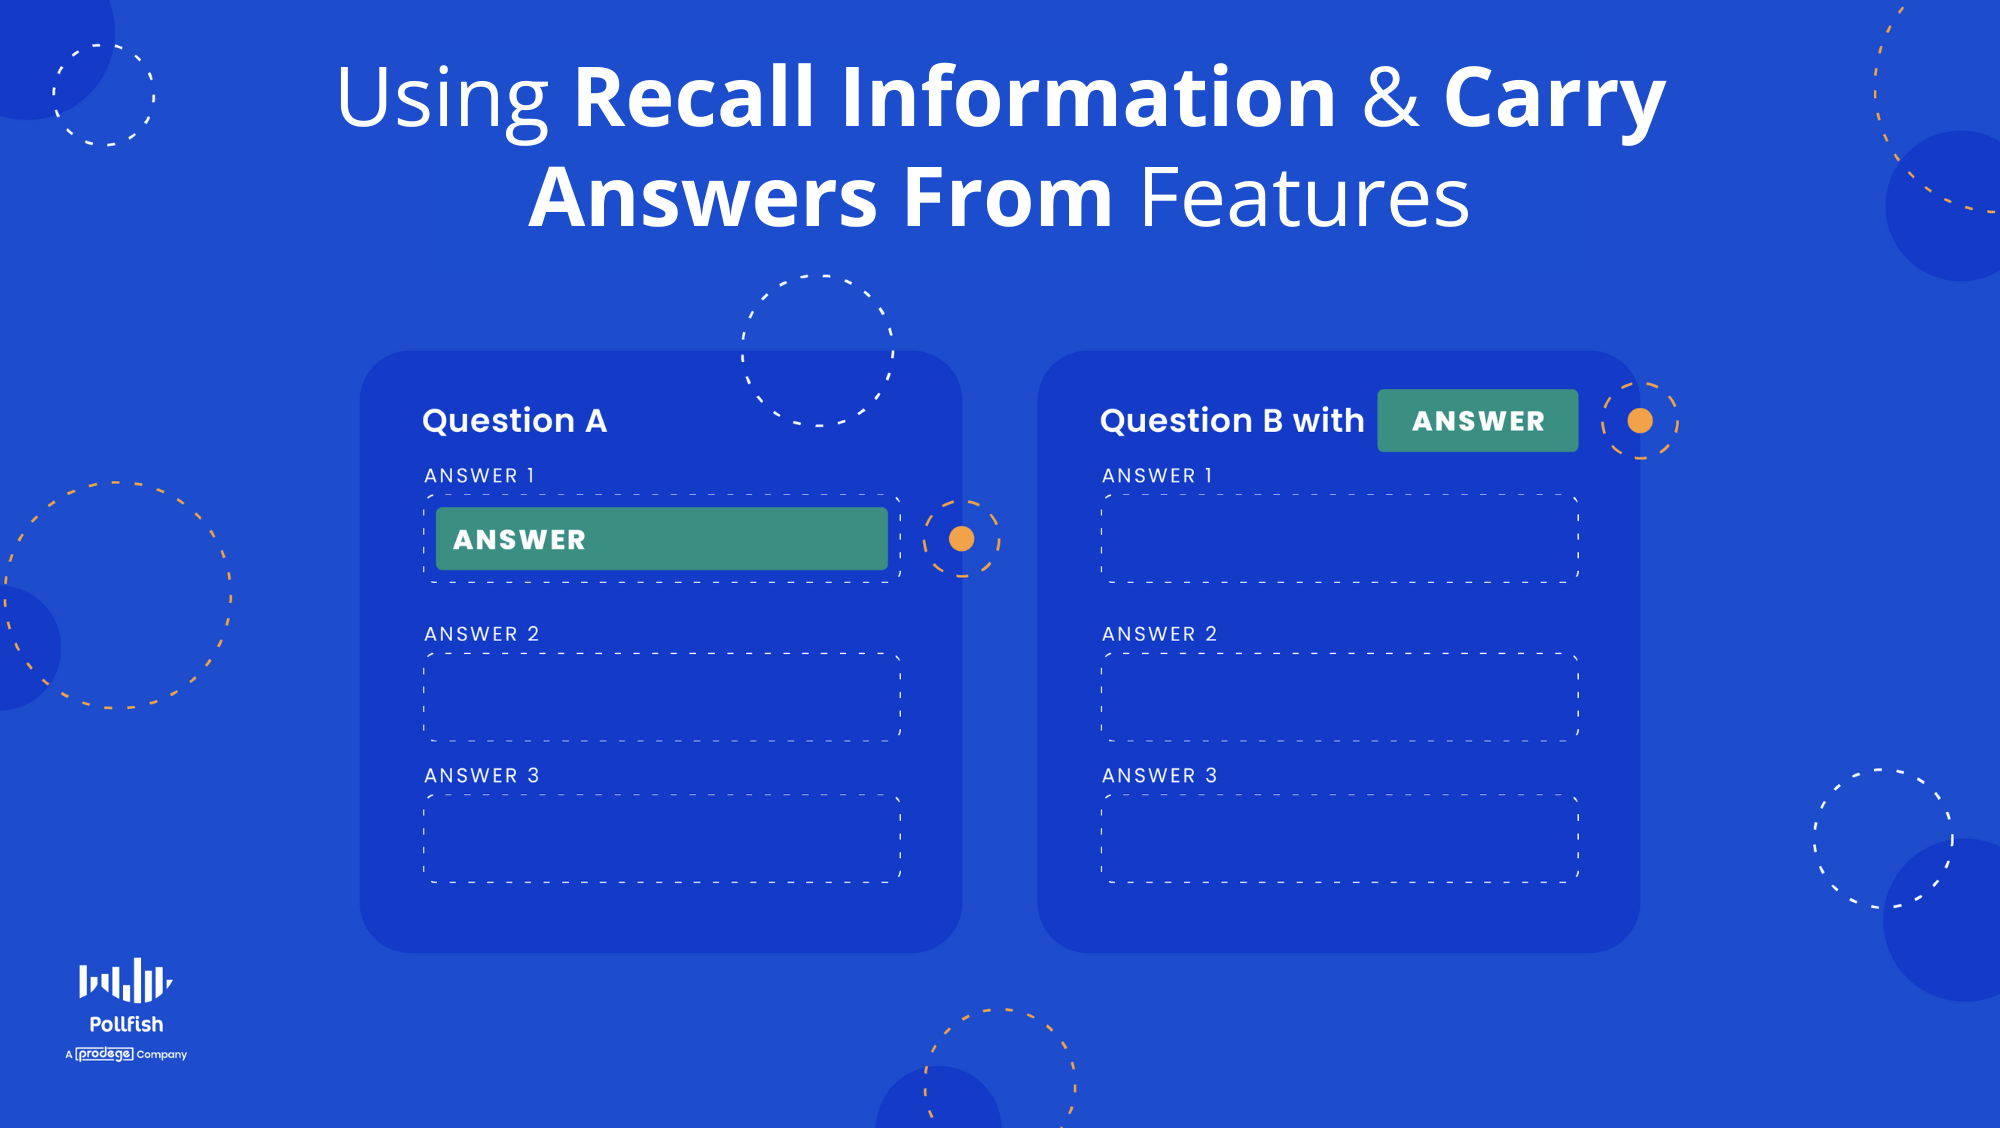
Pollfish offers powerful automation features that allow you to dynamically insert text into survey questions and answers.
These features help personalize surveys, improve respondent experience, and streamline survey creation.
This guide covers the two primary methods for automating text insertion: Recall Information and Carry Answers From.
1. Recall Information Feature
The Recall Information feature allows you to reference a respondent's previous answer within a later question. This helps create a more seamless survey experience by making questions feel more tailored and relevant.
How It Works:
- This feature pulls responses from an earlier question and dynamically inserts them into subsequent questions.
- The recalled text appears in brackets
{}where it will be inserted. - You can recall text from all question types, including:
- Open-ended questions
- Multiple-choice and single-choice questions
- Matrices such as:
- Single Matrix
- Multiple Matrix
- BiPolar Matrix
- Van Westendorp Pricing Meter
Example:
- Q1: What is your favorite beverage? (Open-ended)
- Q2: You mentioned
{Q1}as your favorite beverage. How often do you drink it?
If the respondent answered "Coffee" in Q1, the follow-up question would appear as:
You mentioned Coffee as your favorite beverage. How often do you drink it?
2. Carry Answers From Feature
The Carry Answers From feature allows you to pipe selected answers, unselected answers, or all answers from a previous question into a following question. This makes it highly flexible for customizing follow-up questions based on user selections.
How It Works:
- You can choose to carry over only selected answers, unselected answers, or all answers.
- These answers will be displayed dynamically in the follow-up question.
- This works best for single-choice or multiple-choice questions.
Example:
- Q1: Which of these snacks do you like? (Multiple-choice: Chips, Popcorn, Pretzels, Cookies)
- Q2: You liked
{selected from Q1}. Which is your favorite?
If the respondent selected "Chips" and "Popcorn" in Q1, Q2 would be displayed as:
You liked Chips and Popcorn. Which is your favorite?
Alternatively, if using {unselected from Q1}, it would display:
You didn’t choose Pretzels and Cookies. Would you consider them?
Key Benefits of These Features
- Personalization: Makes surveys feel more conversational and engaging.
- Efficiency: Reduces the need for redundant questions and manual survey customization.
- Flexibility: Supports different response types and conditions to tailor survey flows.
Where to Find These Features
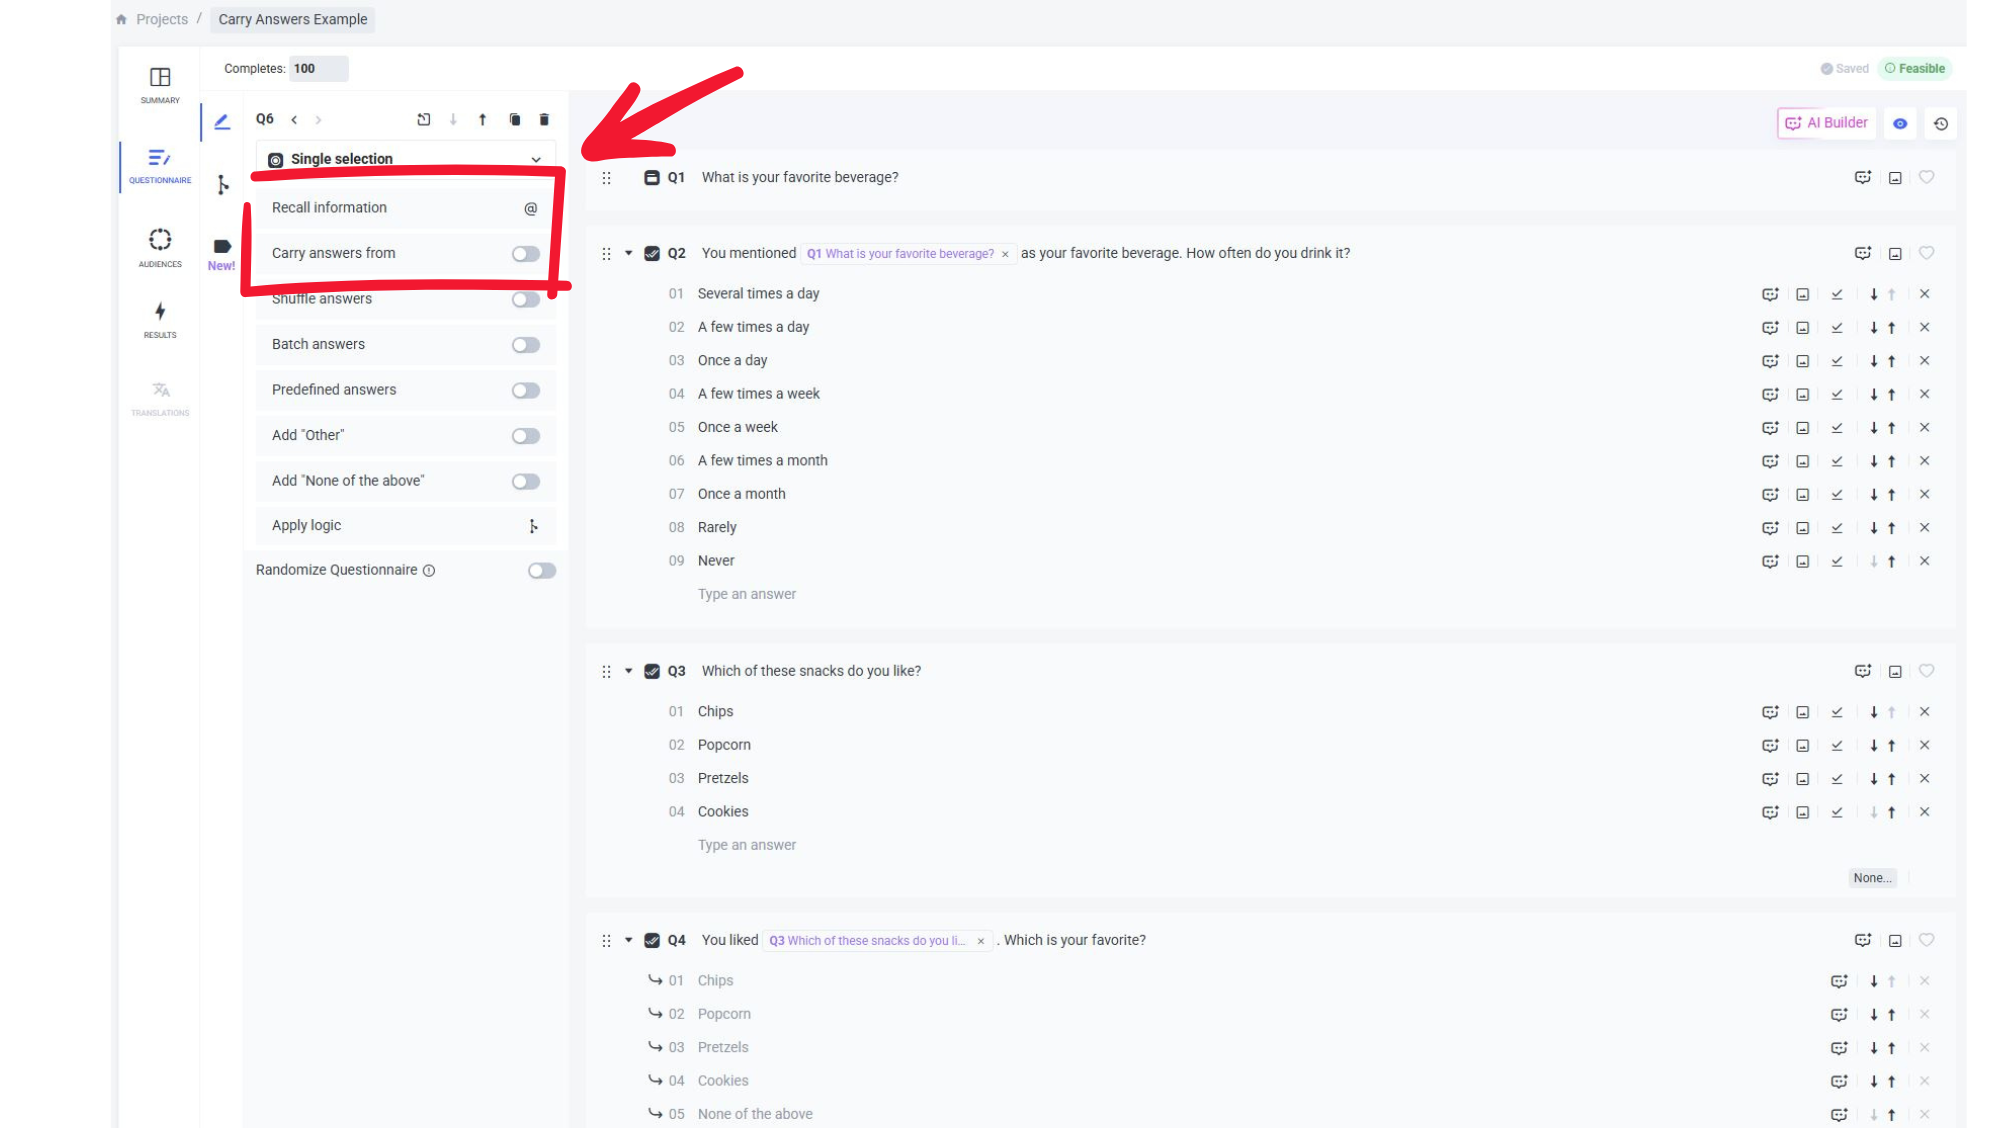
- While designing your survey, navigate to the question where you want to insert dynamic text.
- Click on the "Recall Information" or "Carry Answers From" option in the left menu bar
- Select the relevant previous question.
- Choose whether to recall specific responses or pipe selected/unselected/all answers.
- Preview your survey to ensure the logic flows correctly.
By leveraging Recall Information and Carry Answers From, you can create more interactive and customized surveys, enhancing both respondent engagement and data quality.
Related Reading
We also offer another critical feature for building your surveys: the advanced skip logic feature, which routes respondents to relevant follow-up questions based on their previous answers.

Constant Sum Question: A New Matrix Question Type to Customize Your Survey
Constant Sum Question: A New Matrix Question Type to Customize Your Survey
We’re thrilled to offer researchers yet another new question type to power their surveys: the constant sum question.
This can exist as a Matrix question type on the Pollfish market research platform. As such, this is an addition to another Matrix question we offer: the Bipolar Matrix question type.
As you know, surveys are a great tool to conduct both qualitative market research and quantitative market research. But now, with this new question type, you can create questions with quantitative elements.
That’s because constant sum questions enable respondents to enter numeric data, wherein each numeric entry is summed up and displayed to the respondent.
You can use this question type for a consumer analysis, along with researching everyone in your target market: donors, students, employees, partners and more.
This article explains what a constant sum question is, its use cases, importance, how to create one on Pollfish and more.
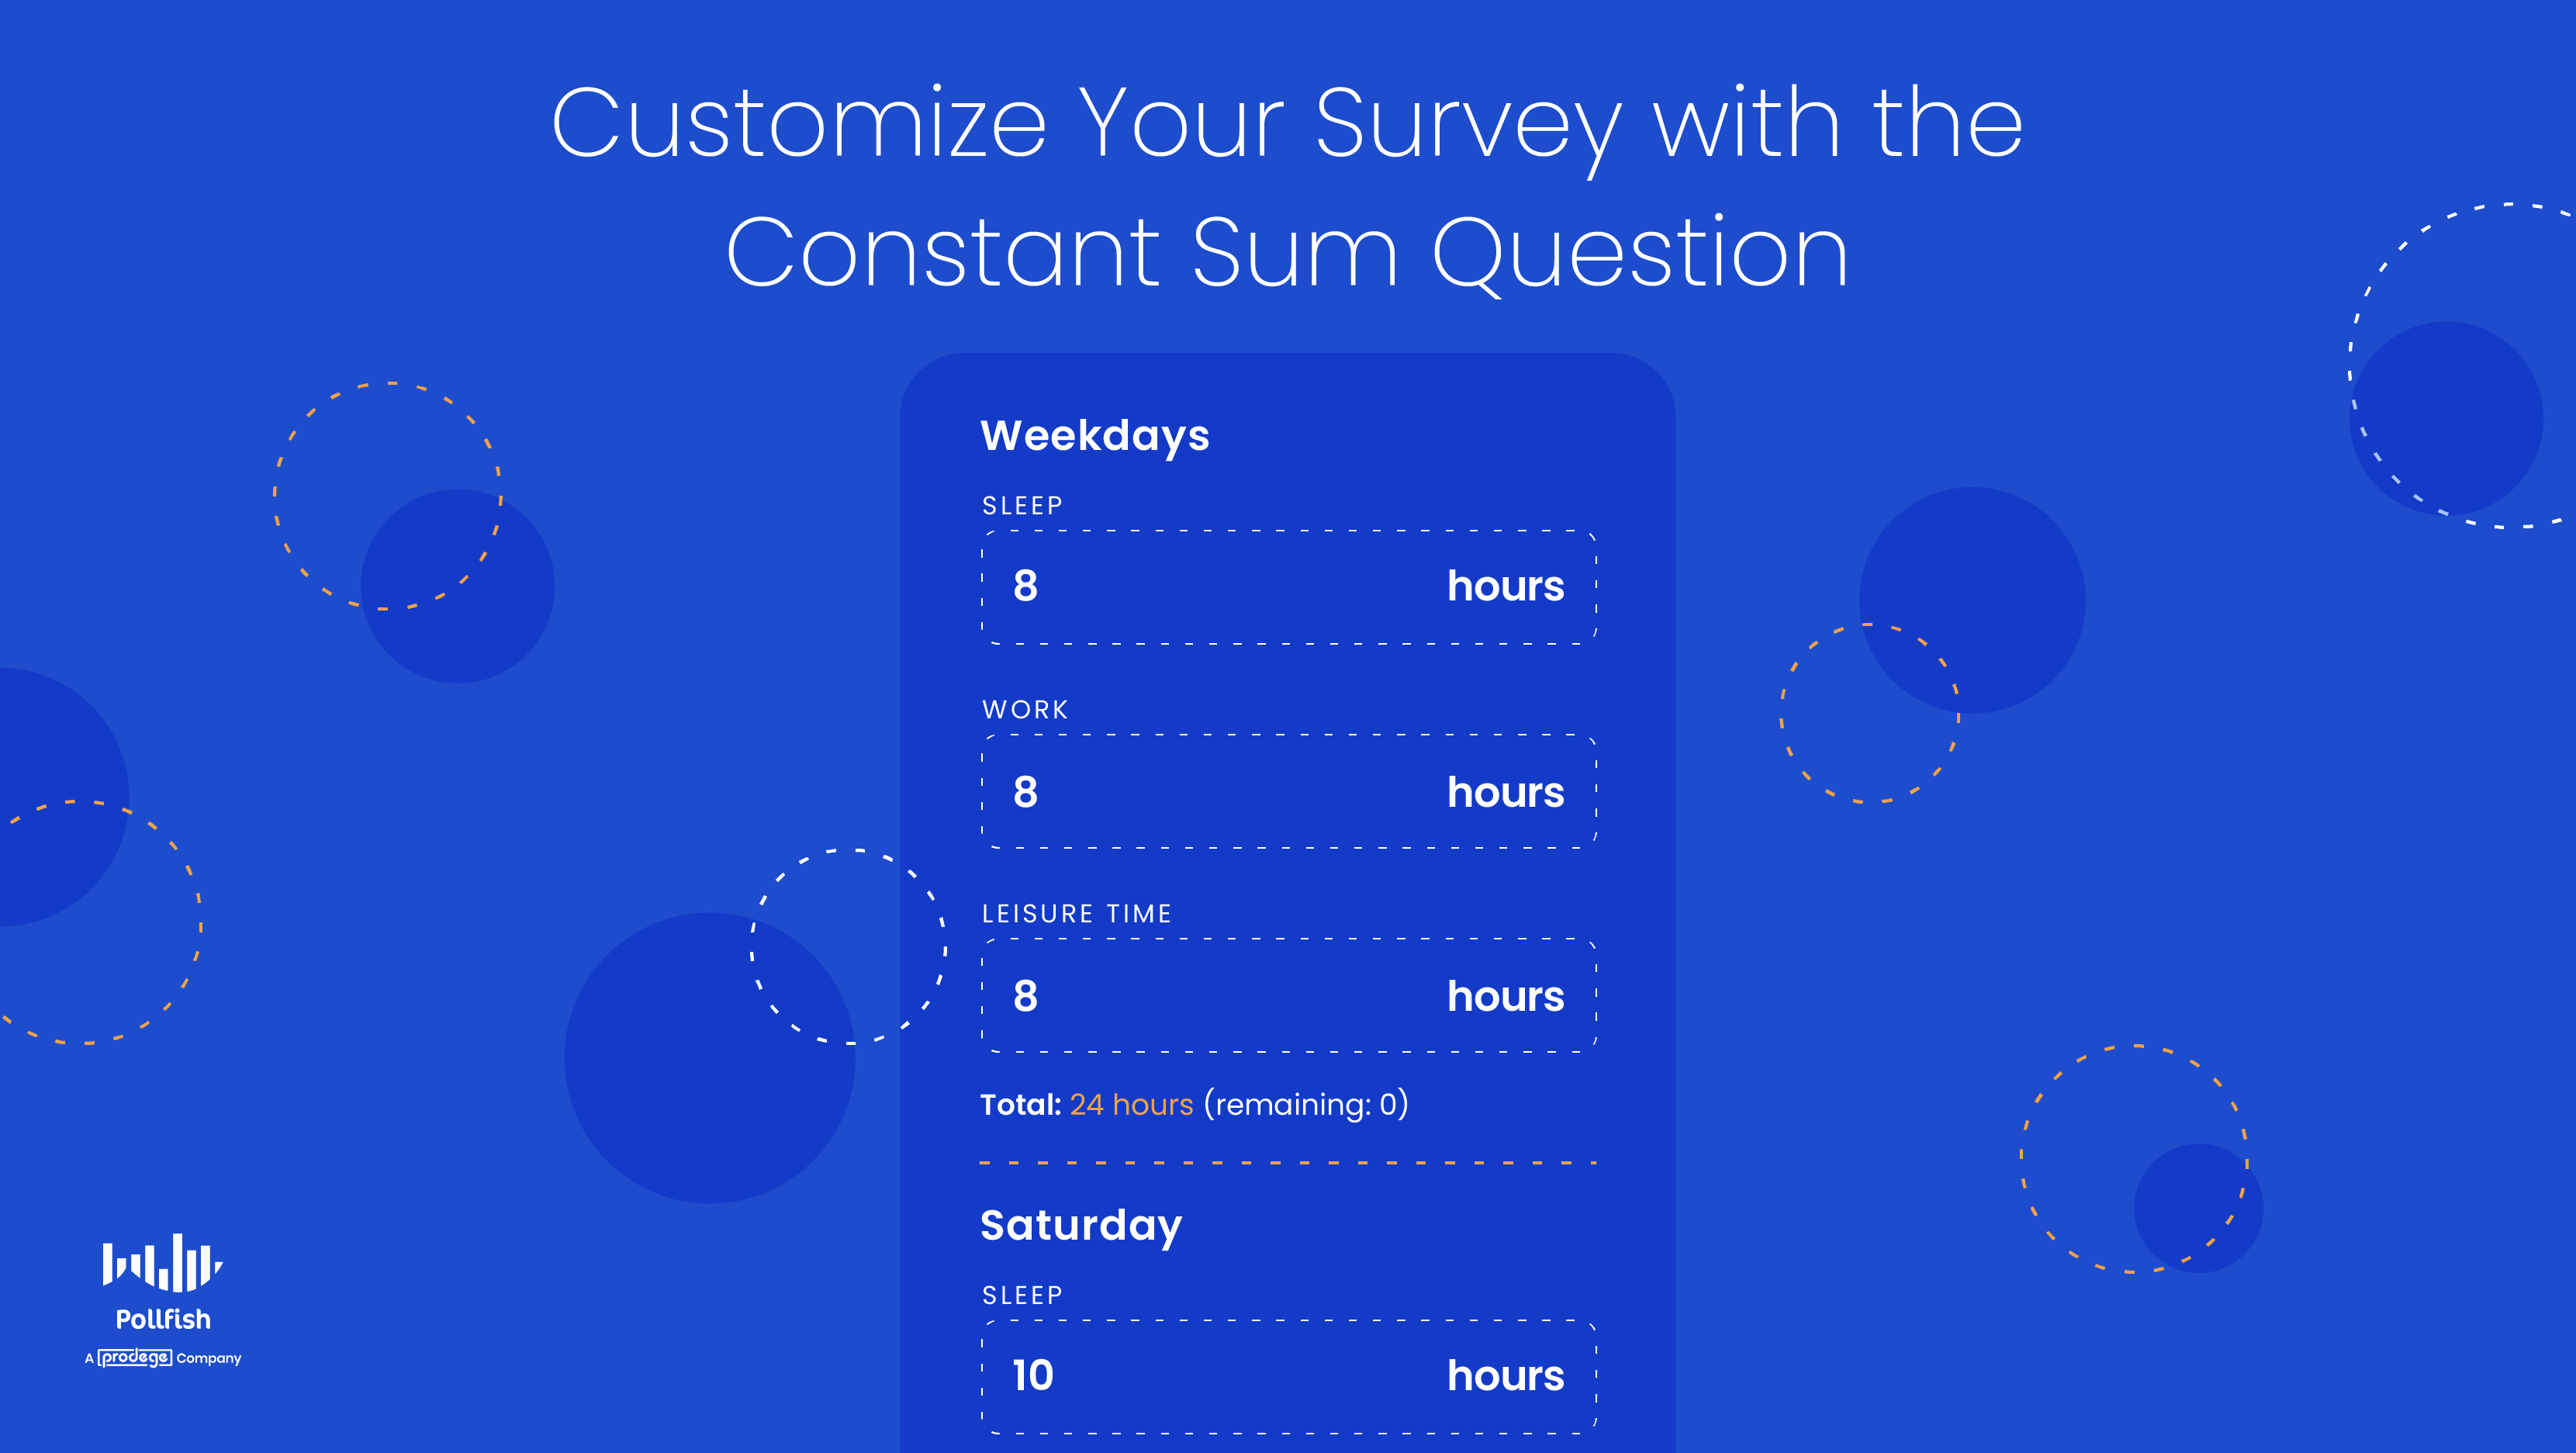
What is a Constant Sum Question?
A constant sum question is used in a market research survey; it allows respondents to assign a specific number of points to all the answer options in the question.
Thus, this is a multiple-choice question, one that requires respondents to enter a numeric value for all choices per question.
The type & total of these points can be defined by the researcher while designing the survey. When these points are defined, respondents won’t be able to answer with values that exceed the maximum points allowed.
The points can take whichever unit you wish to study, such as currency, hours, frequency, etc.
This question type allows you to calculate the numerical aspects of customers' decisions and everyday lives, allowing you to better understand their customer buying journey and virtually all else.
Let’s delve further into the usage of this question type.
Constant Sum Question Use Cases
The constant sum question type gives an understanding of how your respondents value each answer option per question.
These options revolve around a specific topic and inquiry, such as how many times within a certain time period customers buy certain products, or how they rate particular products.
Therefore, you can apply this question to a wide variety of research. The following lists key use cases of this kind of question. This is not exhaustive, as you can ask respondents to assign value to essentially all topics and issues.
- The dollar (or other currency) amount spent
- On specific items
- On certain days
- On budgets
- Amount of time
- Taking part in particular habits
- Working on a project
- Leisure time
- Taking care of responsibilities
- Percentages
- Allocating portions to various activities
- Viewpoints
- Inclinations
- Habits
- Rating systems
- Scales (1-10, etc) on products and services
- Ratings on customer service
- Easiness of a product, school or work assignments
- Ratings on overall customer satisfaction
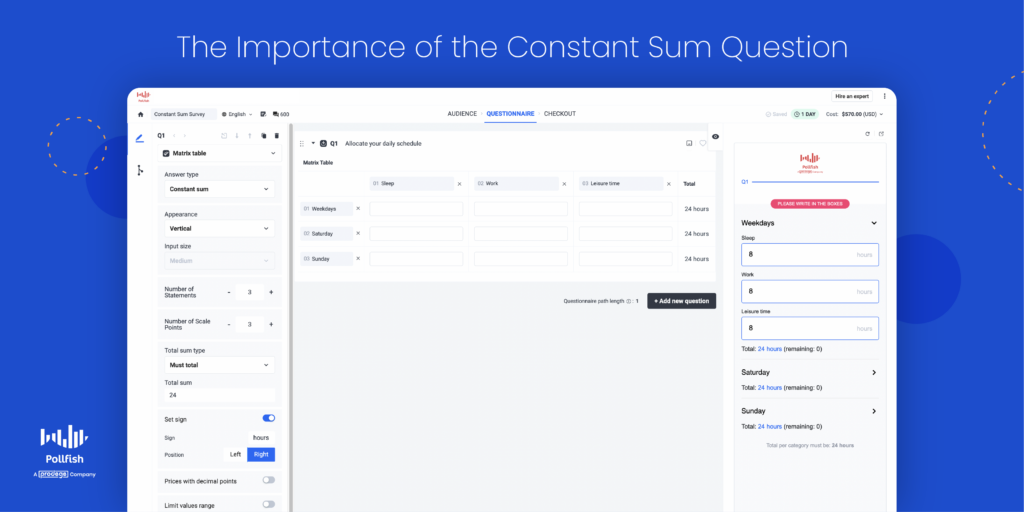
The Importance of the Constant Sum Question
This kind of question is important for various reasons.
First off, it is useful for product research. If customers feel that certain features of a product or service are more important than others, they will allot more points to those features.
Thus, researchers will get a clear indication of the products (and product features) that customers are satisfied with and not.
Using a constant sum scale is also a great way to create differentiation within a data set. It helps you determine which factors are important and which are not for your target market sample.
They are especially helpful in cases where many factors are critical and overlap in some sense. Thus, studying many factors is no longer a hindrance: you can just create an answer option for each factor.
The respondents will assign it a point or rating so you can see the nuances of each factor, especially when it comes to how your customers feel about them.
As such, this question allows you to study multiple aspects easily, as the data this question yields is straightforward and to the point.
This question is also important in a case where you seek to get purely quantitative data. Again, this is useful when dealing with larger sets of answer options. In this case, open-ended questions and other qualitative questions won’t be useful.
Additionally, this question type is especially convenient when you don’t want to form individual questions on a specific aspect.
This would require answer choices unique to the aspect in question, whereas, in a constant sum question, you can fill in various aspects per question.
You can see the sentiments on each aspect displayed in a simple numerical format. This is useful for maintaining a shorter survey, which is a common survey best practice.
In all, this type of question provides convenience for your study and a good UX for your respondents.
Examples of the Constant Sum Question
We dove into the various use cases of this question and now we’ll walk you through specific examples.
Example 1:
Ask respondents to allocate 100 points on the expenditures of their surplus goods, AKA, non-essential items. You can create your own point system or use a currency.
Provide a list of options and ask them to assign the points in order of importance.
Let’s say they spend $20 on movies, $70 on gadgets, $10 on miscellaneous expenses. With the constant sum question, you’ll find out which groceries are the most important for the respondents, as well as which they spend the most and least on.
Example 2:
Ask respondents their views on a particular digital experience with your business. Your answer options can include emails, customer service sessions, finding what they need on your site and more.
You can customize your scale to your liking. As such, you can use points via a scale of 100, or 10. You can also use percentages, especially when talking about the time spent on each.
It would be like this: rate the time you spent on the digital experiences with our company: viewing the homepage - 30%, reading a blog post - 20%, searching for products - 40%, speaking with a support rep via chat - 10%.
They can also rate how they viewed each experience; this would require a scale of 1-10, or 100, depending on researcher preferences.
Example 3:
You can discover how well your customers know and feel about certain brands, especially useful if they are your competitors.
As such, you can ask them to rate how they feel about each brand along with how much time they’ve spent engaging with it.
This can appear as such: rate how much you’ve engaged with each brand, which can include buying from them, viewing their items, reading their content, etc.: Macy’s- 30%, Old Navy -15%, Marshalls - 45%, Burlington Coat Factory - 10%.
How to Use the Constant Sum Question on Pollfish
Creating a constant sum question on the Pollfsih platform is easy and straightforward.
For respondents, it’s as simple as allocating a certain point to each answer option. See the section above with examples of how respondents can answer the question.
For researchers, it involves implementing the question in the questionnaire section, along with adding and customizing acceptance criteria.
Here is how to add it to your questionnaire:
- Go to the questionnaire section of the survey after creating a new one.
- Select a Matrix question and then the Answer type: Constant Sum.
- You can lift the Must total validation and change it to Continuous Sum.
- There are 2 appearances as well.
- You can add a sign (if you seek) and select if you accept decimals or not at responses.

 Create the survey you want
The Pollfish team is constantly working to improve your survey experience, so you can expect us to continue updating and upgrading our platform with more features.
With our vast array of question types, you can form any survey and any research campaign.
Our research platform is optimized for both the respondent and the researcher. Thus, it is a win for all parties involved.
Researchers can reap a wide breadth of information on their respondents and leverage a wide pool of insights in their survey results dashboard.
Pollfish also provides artificial intelligence and machine learning to remove low-quality data and a broad range of survey and question types to customize your surveys.
In addition, there’s the advanced skip logic feature, which routes respondents to relevant follow-up questions based on their previous answers.
With a research platform containing all of these capabilities, you’ll be able to set up any survey you want, study any group based on demographics and psychographics alike and reap high-quality data.

Create an Advanced Research Experience with Passthrough Parameters & Other URL Parameters
Create an Advanced Research Experience with Passthrough Parameters & Other URL Parameters
Learn how to pass and capture more information by using parameters - or “params” for sort - on our DIY survey platform
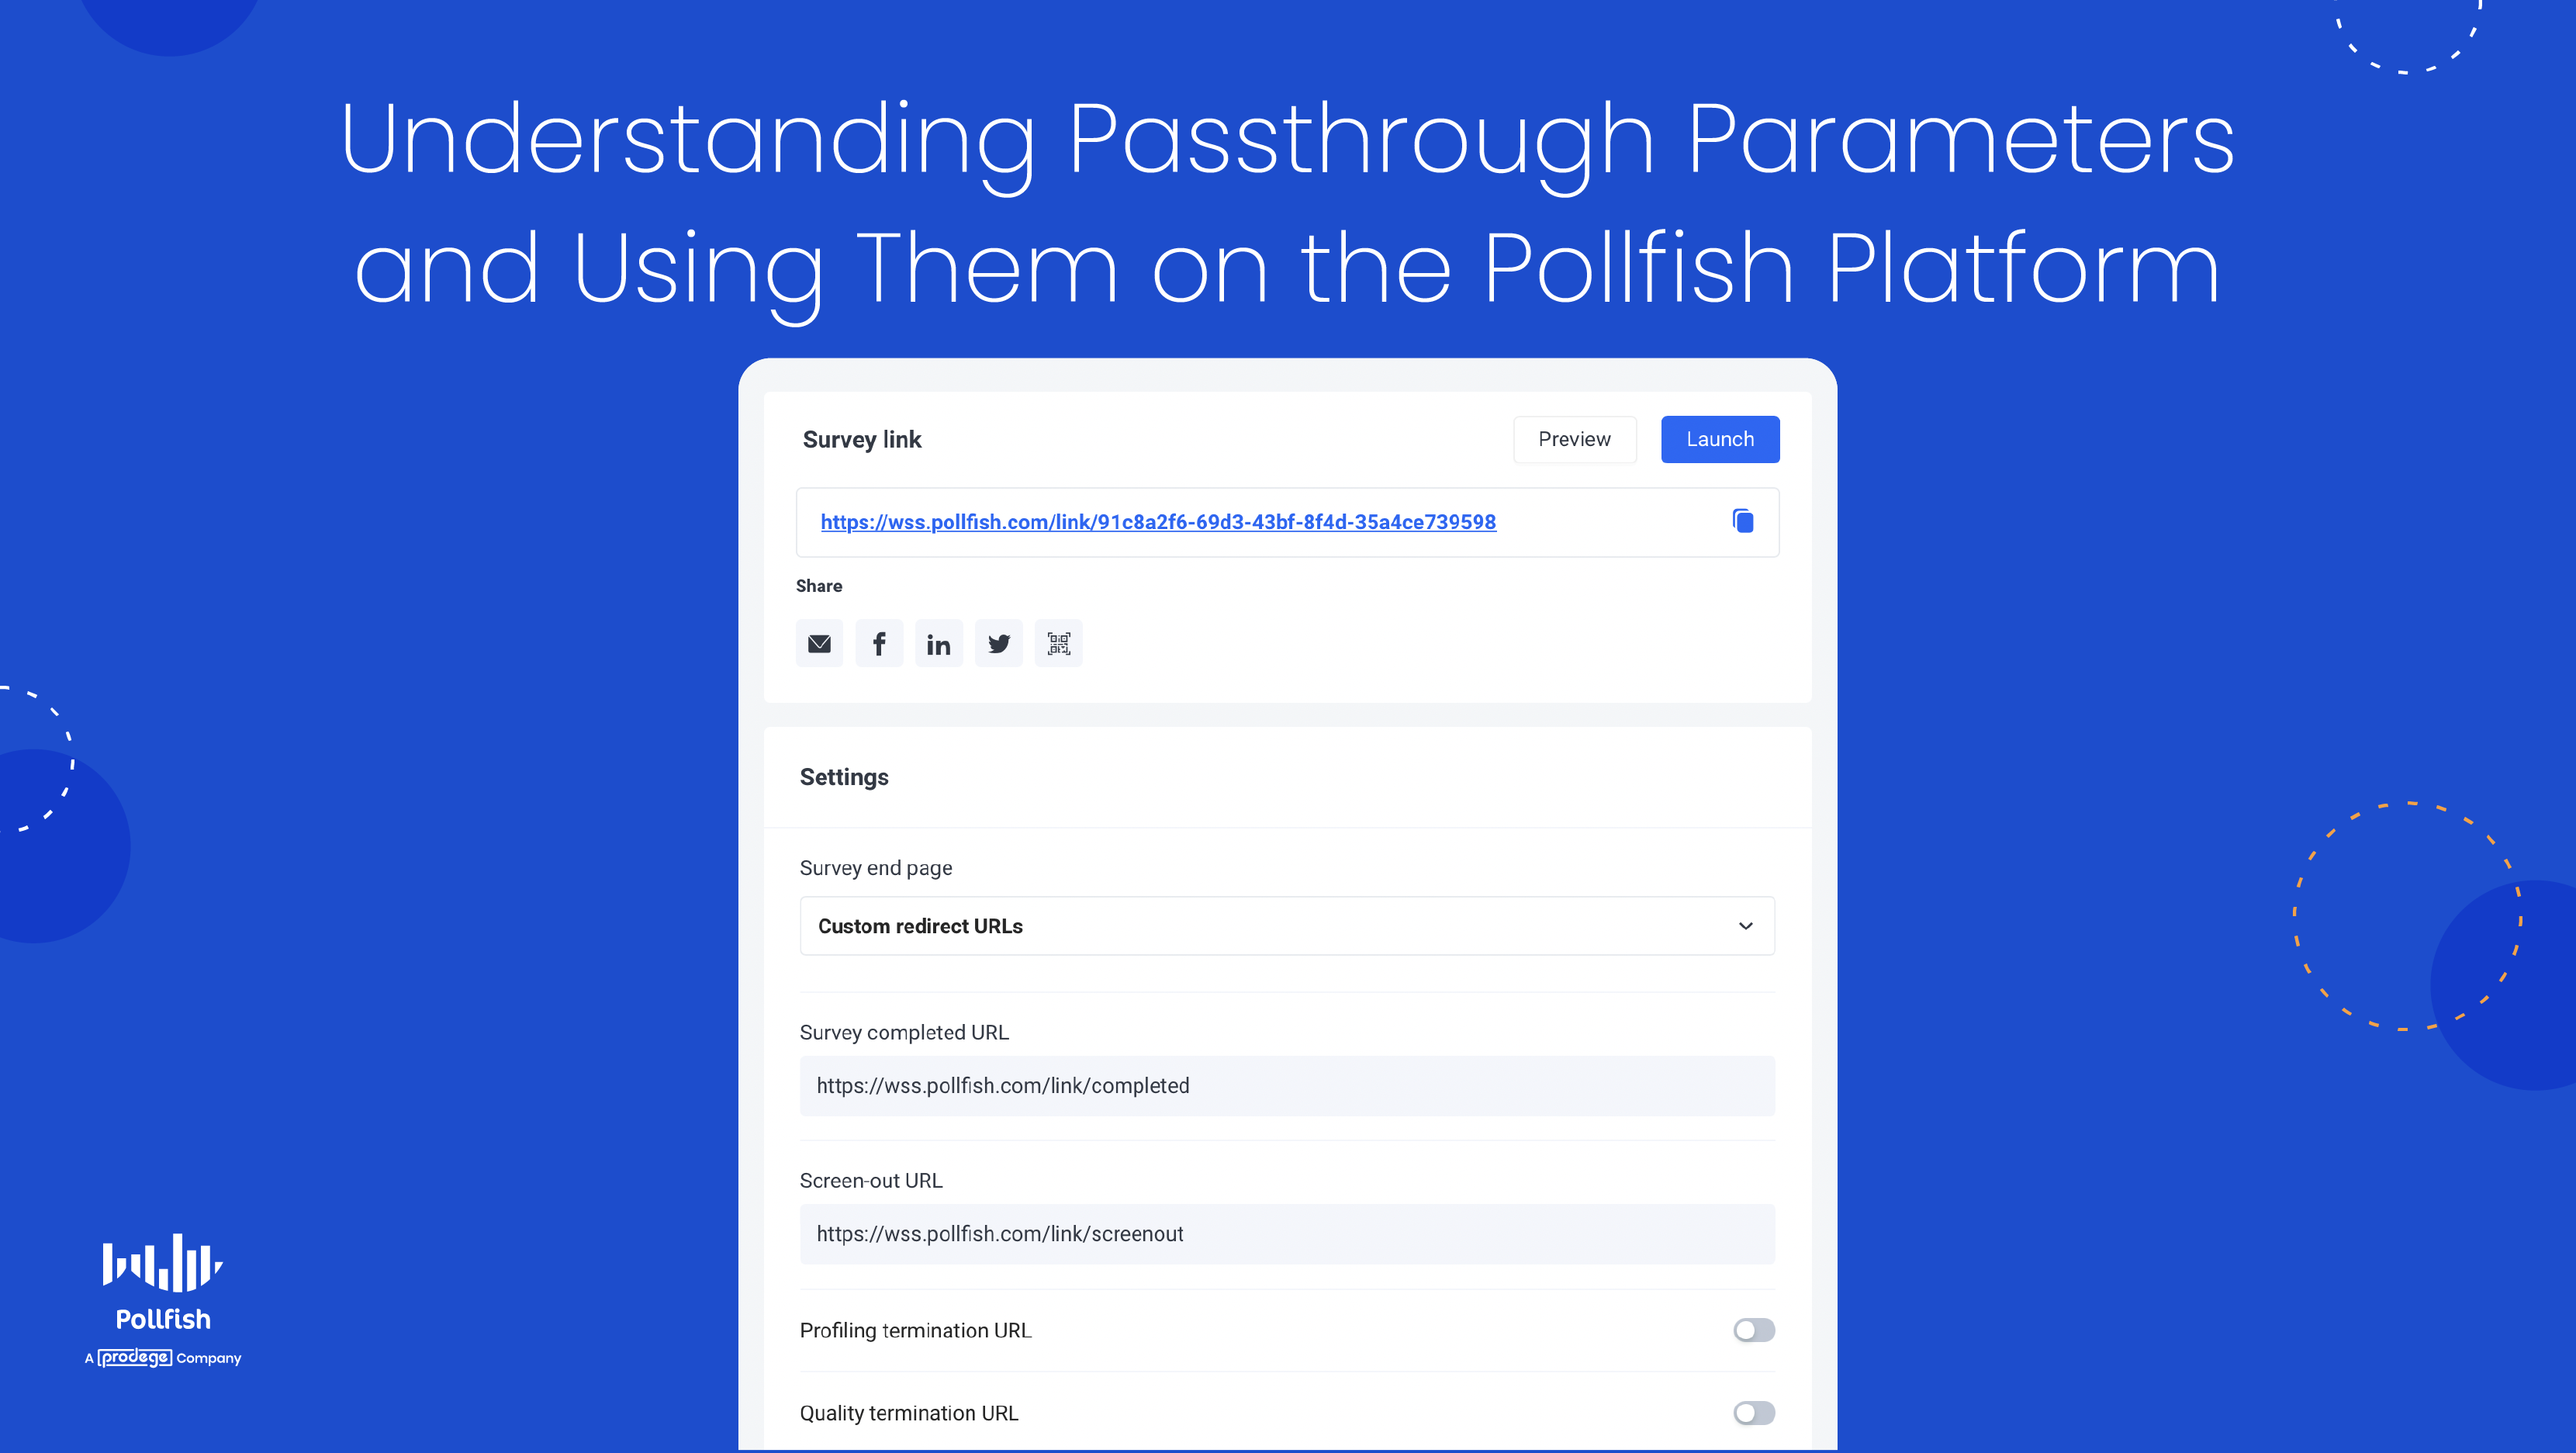
Our URL feature allows you to add passthrough parameters, also called URL parameters, along with offering redirect parameters to your survey.
These help you to append information to your respondents, as you can use params to track them and then lead them to a particular response. As such, this technical feature helps you better acquaint yourself with your target market.
This article explains these parameters, their use cases and how they work in the Pollfish online survey platform; it also provides examples.
Understanding Passthrough Parameters
Pass-through parameters are specific tags that are placed at the end of a URL. They send data to a server and creating them is optional.
These parameters are part of a URL’s query string and thus are part of the URL-forming process. They can be seen by respondents, as they appear in the URL.
You can append as many parameters as you want to your survey link.
How Passthrough Parameters are Used
They are predominantly used to track and match a respondent with a certain response. In Pollfish, you append the user ID at the entry URL and retrieve it at the redirect URL.
By doing so, you can match a respondent profile from the Pollfish respondent pool with a response on a Distribution Link survey. This is the opposite of what you would do with third-party surveys, which are the surveys that get deployed through our massive networks via our Random Device Engagement method (RDE).
Other Uses of URL Parameters
This new offering has various other use cases for your market research needs. These include technical uses and research-based ones, that is, those that focus on understanding your respondents.
Here are other uses of passthrough/URL parameters:
- Passing along demographic data, storing it and later analyzing the results with ease..
- Passing, tracking and monitoring campaign IDs.
- Inviting and tracking respondents via email
- Segmenting your audience for market segmentation
Examples of Passthrough Parameters
The following shows you how passthrough parameters appear on your Pollfish surveys. Take a look to see their components and properties and how to add them to your own survey link.
Add some more:
Add even more:
Retrieve them with redirect params:
Redirect Parameters
You can retrieve your passthrough parameters through redirect parameters, which are also part of a URL. The value in your destination URL affects where and how the URL is redirected.
Building Passthrough Parameters on Pollfish
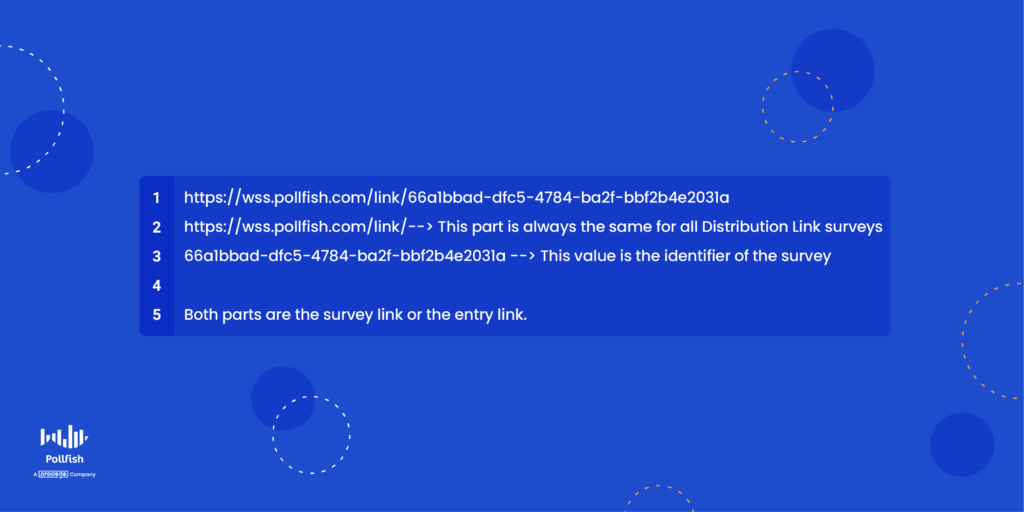
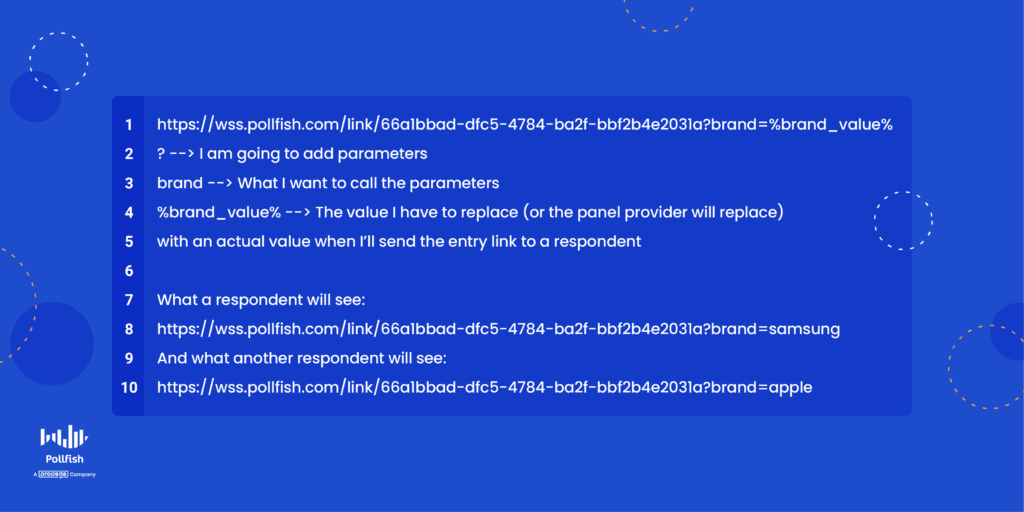
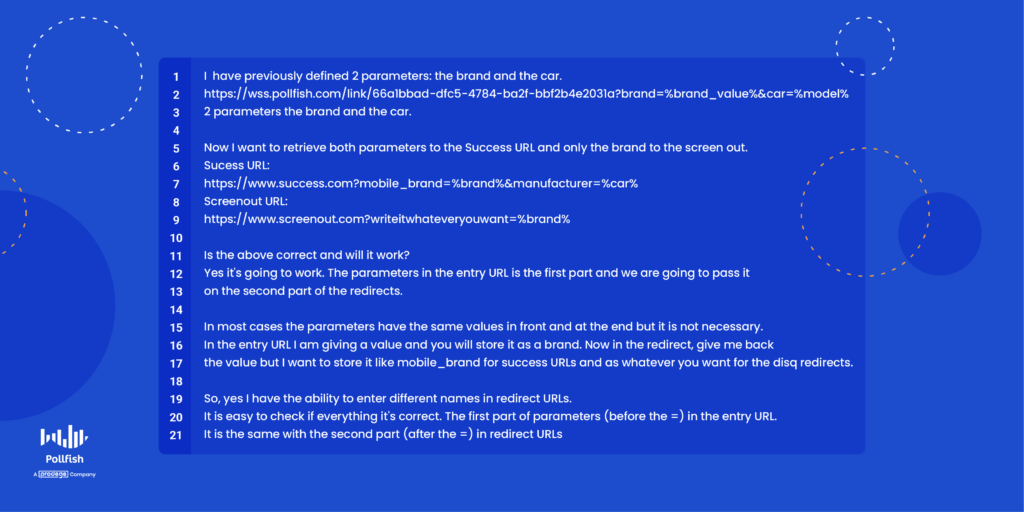
Params order and letters case doesn’t matter! You can define a parameter at the end of an entry URL by adding first the ? and then the parameter. For example:
Entry URL:
https://wss.pollfish.com/link/12345678-1234-1234-abc123456?userid=%userid%
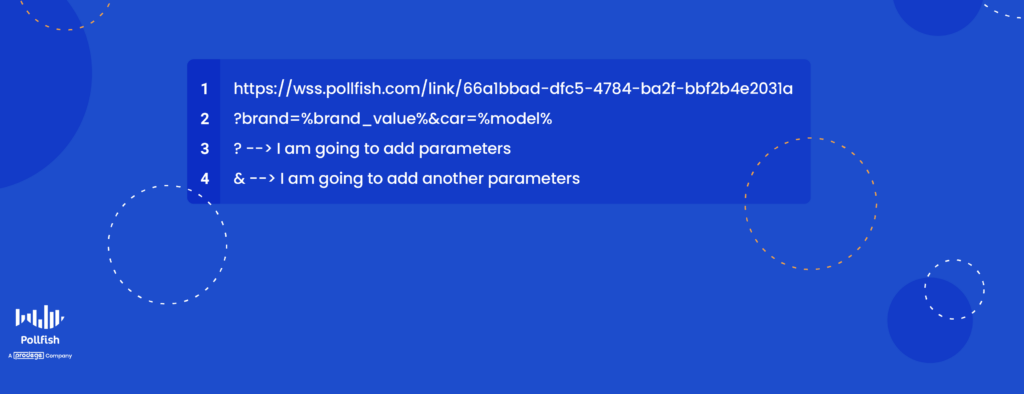
You can append another parameter by tying them with the “&” sign. For example:
https://wss.pollfish.com/link/12345678-1234-1234-abc123456?userid=%userid%&campaign_id=%campaign_id%
Retrieving parameters through redirect URLs
In case you want to pass through the information with redirect URLs then you have to include the same parameters at the redirect URLs. For example:
Survey with a completed URL:
https://thirdpartyswlink.com?user=%userid%&campaign=%campaign_id%
An easy way to check the validity of your parameters is that the parameter name in entry url is the same with the value between the % symbols at the redirect URLs. For example:
Entry URL: https://wss.pollfish.com/link/12345678-1234-1234-abc123456?user_id=%respondentid%
Survey with completed URL:
https://thirdpartyswlink.com?respondent=%user_id%
Export the stored data.
All parameters and their saved values for each respondent are available at XLS export, sheet individuals.
Will the following work?
A third party software defines parameters $param$ or [param] or [[param]].
It will not. Try to replace all other symbols with the percentage symbol (%).
Creating the Best Survey Experience
While this topic hinges on the technical side of the market research process, the Pollfish platform is otherwise extremely user-friendly and easy to navigate.
You should therefore opt for a research platform like Pollfish, which also grants artificial intelligence and machine learning to remove low-quality data and a broad range of survey and question types to customize your surveys.
It also features advanced skip logic to route respondents to relevant follow-up questions based on their previous answers.
Pollfish puts you in full control of your survey campaign — from targeting, to deployment method, to the questionnaire and how your post-survey data is presented.
With a research platform containing all of these capabilities, you’ll be able to set up research campaigns your way and retrieve quality data.

Multiple Selection Questions in Mobile Surveys (Updated)
Multiple Selection Questions in Mobile Surveys (Updated)
Multiple response, multiple selection or multiple-choice questions allow the survey respondent to choose one or more answers from set of provided responses of at least three or more options.
They are popular in survey design because of their convenience to the survey designer, as they can capture the respondent’s views and attitudes to the pre-formatted answers and provide a relative frequency or popularity of answers among a set of choices.

What should you consider about multiple choice in a mobile survey?
When designing a mobile survey, you must consider that the respondents have limited screen space before they have to scroll. So don’t overload the participant with too many answer choices in a multiple-choice question.
Answers to multiple-choice questions can be “shuffled”, or randomized in the Pollfish platform, however, remember that participants are allowed to select multiple answers. There is also the ability to anchor the last answer, by selecting “Shuffle but keep the last one fixed”.
NOTE: There are times when you do not want to shuffle answers, such as when asking for a numerical response.
You also want to limit the number of questions you ask the participant. Users tend to lose interest, “speed through” the survey or drop off completely if a survey contains lots of questions.
If you already have a list of answers, batch answers can speed the design of your survey, and avoid the hassle of typing individual answers one at a time. If you have the list on separate lines in an excel sheet, word doc, or similar, you can select "Add batch answers" to copy and paste your choices from your source document.
Advanced tip: If you want to copy the answers from a previous question you created in the Pollfish platform, select “Add batch answers” there, and the pop-up window will have your choices available to copy and paste.
2022 Feature: The Exclusive Answer Option
On August 10th, we released a new feature to enhance our DIY survey platform: the Exclusive Answer. This answer option is available only in the Multiple Selection Question type and as its name suggests, creates exclusivity in the respondent's answer.
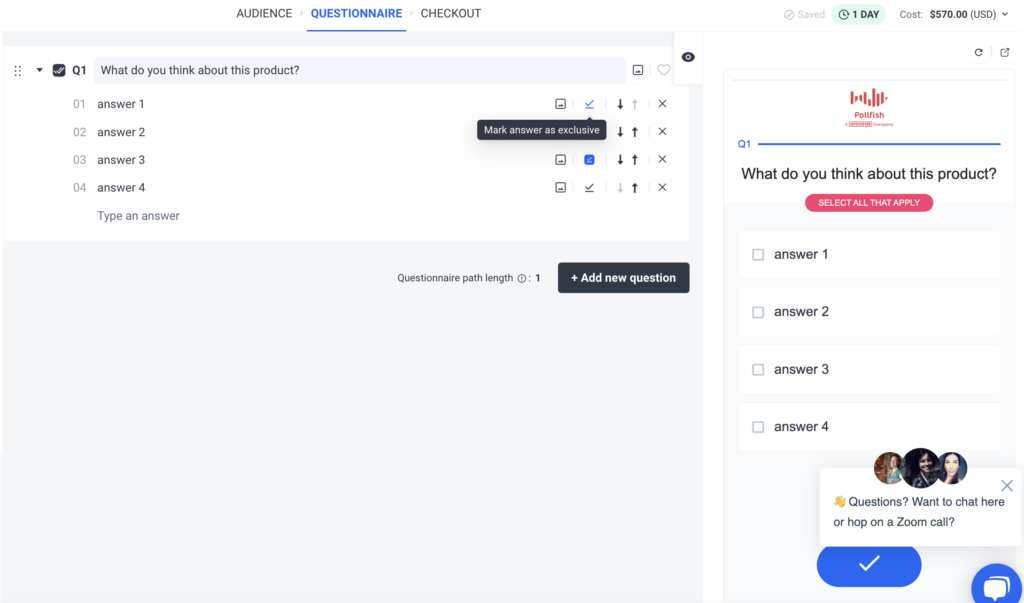
This means that if you've designated an answer as exclusive, it can be the only one chosen, despite the question being a Multiple Selection. As such, it cannot be selected with other answer options.
Exclusive answers do not have any special visual identifier in the mobile tool, they appear just like any other answer, in order not to make the user’s selection biased.
Through this new feature, you can mark answers as "exclusive" by clicking the new icon, which is situated next to the "Add Media" icon. As such, on mobile devices, when a respondent selects this kind of answer, all other answer selections will be unselected.
The “Add Other” option provides the option of exclusivity; just tick the icon next to the “Other” text box. In this way, the “other” option on the left panel works like the “none of the above” option when you click on its relevant box.
The “Limit Answers” option still works as it has worked on non-exclusive answers and thus, does not apply to the exclusive answers.
Carried forward answers cannot be exclusive.

The Pollfish Survey Results Dashboard: Understanding its Functionality and How to Use it
The Pollfish Survey Results Dashboard: Understanding its Functionality and How to Use it
You’ll find the results of the survey you launched in the survey results dashboard on Pollfish. This page is your go-to source of survey data once the data of a survey is complete — that is — once all quotas from that survey are retrieved and the questionnaire has been fully filled out.
In order to properly analyze survey data and perform any sort of market analysis, whether macro or micro, you’ll need to have access to a clear and accurate set of survey results data.
Luckily, on Pollfish, the survey results page is easy to access, view and navigate. The data itself is of high quality, given the rigorous checks that the Pollfish platform facilitates to provide quality research data and avoid survey fraud.
This article delves into the ins and outs of the survey results dashboard, the page on the Pollfish online survey platform that contains all the survey results specific to the survey you run.
Understanding the Survey Results Dashboard on Pollfish
This dashboard is a page that contains all the results from the survey you conducted on the Pollfish market research platform, whether you ran the survey via the Distribution Link feature or randomly through our vast network of publishers.
The former method allows you to send surveys to specific people and on the specific digital properties you choose to insert your survey.
The latter refers to our Random Device Engagement (RDE) approach of survey distribution, which is a kind of organic sampling method that deploys the survey across a vast network and targets users where they exist voluntarily.
Each survey will have its own results page, meaning that each survey will have its own survey results dashboard. Whenever your survey collects all of its responses, it’ll be rendered complete and you’ll be sent an email prompting you to view your survey results.
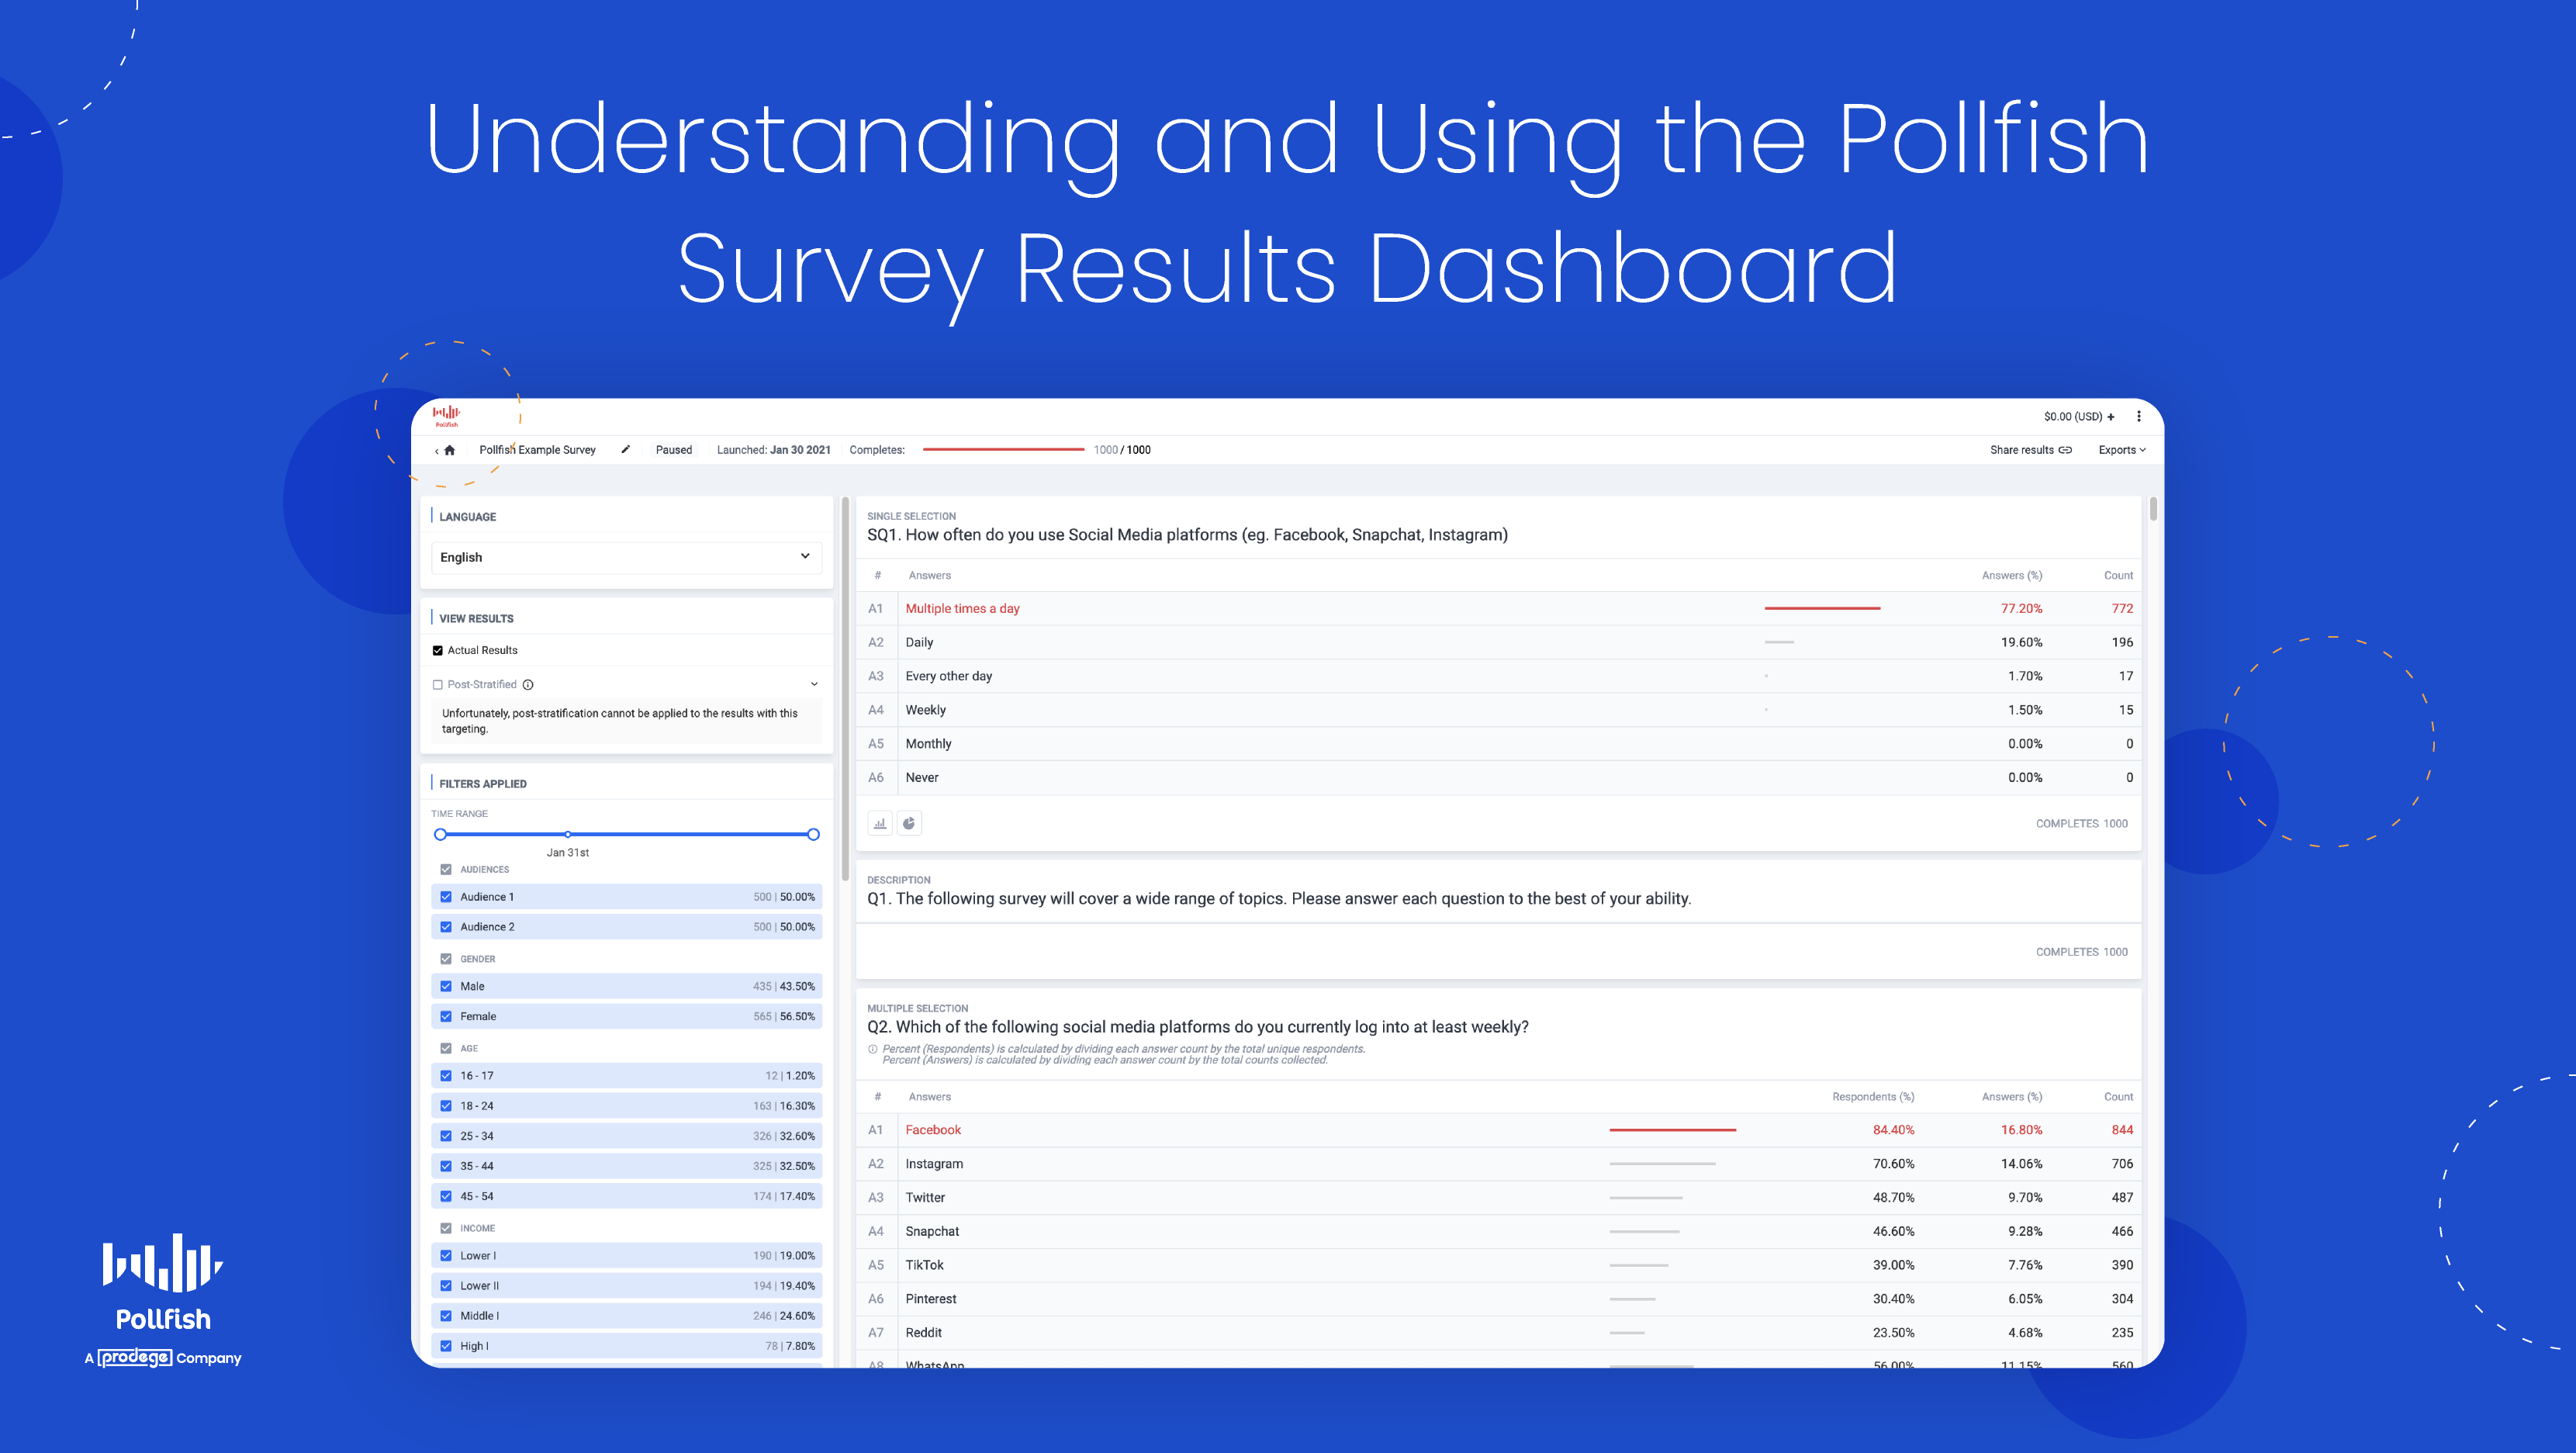
Digging into the details of the survey results
The survey results dashboard displays more than just the statistics of each question you ask. Instead, you’ll find a granular breakdown of both the answers and the audience targeting.
This dashboard contains several options to view your survey results. You can view them in basic table form, which displays the question, the answers and their respective count and percentage of respondents who selected each.
You can also view your results in more visual ways, such as by way of a column chart, filled with colorful bars, or through a pie chart, best suited for visual learners.
The survey results dashboard also provides several export options. These exports present additional ways in which you can view your survey data. Whether you want to download an Excel file with your survey data or analyze your data via Crosstabs, it can all be found on this page (on the upper right corner).
Remember, each such page displays all the data associated with one particular survey. However, there is a way to view all completed surveys in list form. (More on this in the How to Access the Survey Results Dashboard section below).
The Contents of the Survey Results Dashboard
We discussed the major aspects of the survey results page in the previous section. However, there’s more to consider, along with all the specific subcategories that come with the contents of this dashboard.
The following lists all the contents that you can find on the survey results dashboard:
- The launch date and number of completes (on the center top)
- The option to get a sharable link to the survey (on the upper right)
- Exports (on the upper right)

- Excel
- CSV
- Crosstabs
- SPSS
- The survey questions and answers
- The count of each answer & the percentage of respondents who chose it
- The ranking (if it’s a ranking question)
- Answer visualizations (aside from a table view)
- Column chart
- Pie chart
- 2 ways to view results
- Actual results
- Post stratified
- Post-stratification is a weighting method to achieve a distribution equal with that of known characteristics of a population. It can be applied to all supported categories, such as countries, ages, gender and income.
- A robust data filtering system
- Filter the results based on a wide variety of demographic/location/device filters. This allows you to learn how granular segments of the population answered your questions.
- Time range
- View results based on the time they came in
- Screening questions
- See how respondents answered based on their screening question
- Gender
- Filter by gender (male, female, nonbinary)
- Age
- Filter answers based on various age groups
- Location
- Filter results by country, county, state, US census region and more
- Employment status
- Filter answers based on respondents’ employment status
- Any other targeting filters you may have added
- Time range
- Filter the results based on a wide variety of demographic/location/device filters. This allows you to learn how granular segments of the population answered your questions.
- Visualizations based on respondent categories
- View tables, column charts and pie charts on specific categories such as ethnicity, language, marital status, income and other audience demographics.
How to Access the Survey Results Dashboard
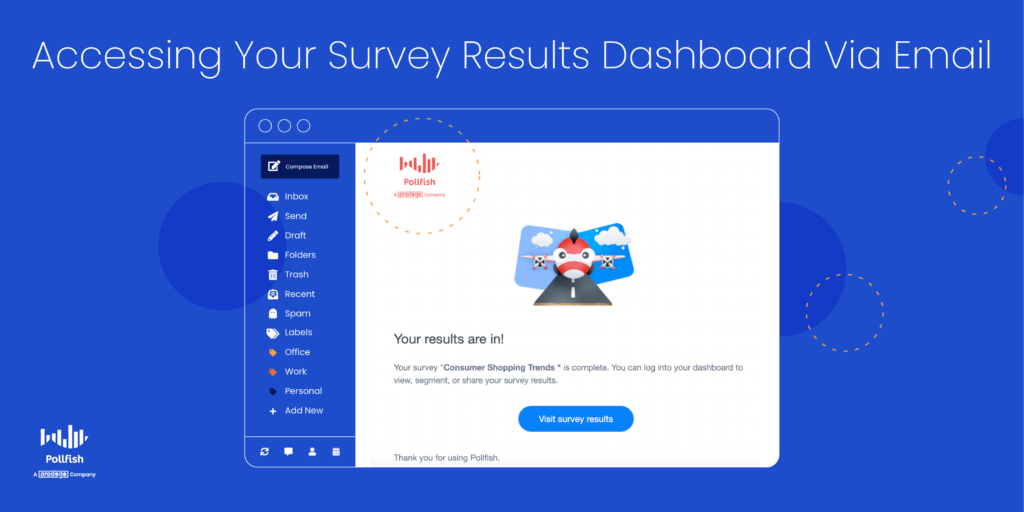
There are two ways to access your survey results. We briefly explained the first way in the section on Understanding the Survey Results Dashboard. To reiterate in further detail, once your survey is complete, you will be notified via email.
This email contains a large blue button with the call out to “View survey results.” Simply click on this button and you’ll be taken directly to the survey results dashboard for the completed survey in question.
Here you’ll find all the contents of the dashboard, as laid out in the previous two sections. You can filter the results, view them in any of the supported visualizations and export them in your file of choice.
You can also access the results dashboard by visiting the general dashboard. Just go to https://www.pollfish.com/dashboard/. Here, you’ll get a bird’s eye view of all your projects. All your surveys will appear here in list form, by way of the name of each one.
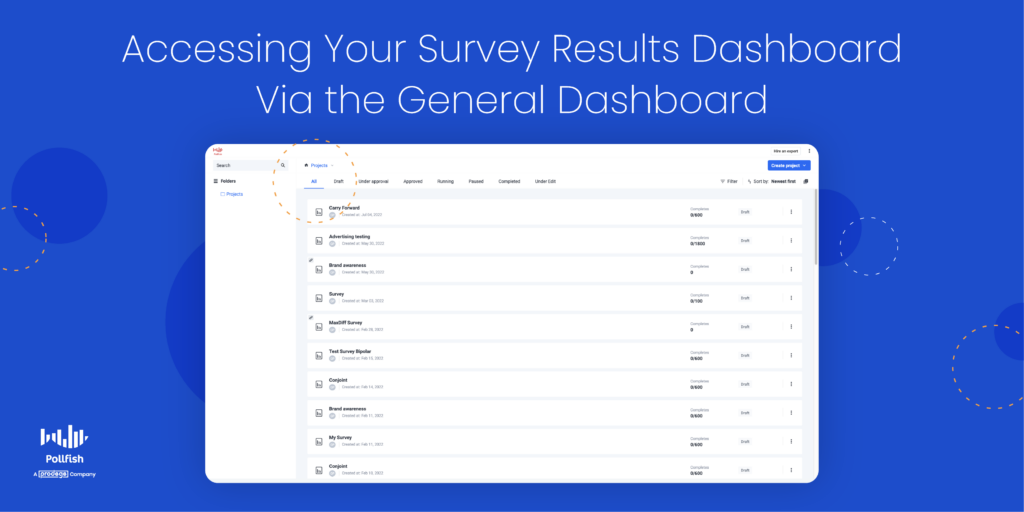
Notice that you’ll find the initials of the surveys’ creator(s) under each survey name. You’ll also see the date each survey was created, its number of completes (expressed as a number out of a preset total: 100/500), along with its status, such as draft or completed.
This page includes upper navigation in which you can view your list of surveys based on their status, for example, drafts, under approval, approved, paused, completed, etc. To view the surveys that have all their results in, click on the “Completed” tab.
This, in turn, will allow you to see a list of surveys that have been completed, meaning they have a survey results dashboard, which you can click on to view all your results data. By clicking one of these completed surveys, you’ll be taken directly to the survey results dashboard, which has all the information you’ll find by accessing it via email.
What You Can Do in the Survey Results Dashboard
By this point, we gathered that you can do five major things on this results page:
- View completed survey data
- Filter the data by demographics, time range, post-stratification and more
- Export the results in different formats
- Share the data through a link
- Quantify answers and draw conclusions
But there’s much more you can do with the survey results dashboard.
First off, you can conduct a survey data analysis and make observations with researchers, analysts and non-researchers and nonanalysts alike. After all, viewing and studying the data across tram members fosters a culture of data democratization.
You can conduct a market segmentation of your customers to categorize them into separate groups. Since your target market contains all the customers most likely to buy from you, it is often too broad to study on its own. Thus, you should segment your customers into smaller groups and personas.
Given that you can filter by demographics and screening questions, you can detect specific groups of customers and search for patterns in their behaviors and specific answers.
If you’d like to segment your customers even further, you can use your results dashboard to create an RFM analysis. An acronym for recency, frequency and monetary value, this kind of research method segments customers via these three customer behaviors.
In turn, market researchers and business owners can identify which customers are regulars, big spenders and which make one-time purchases. This allows you to distinguish between your customers, assign each customer numerical scores based on the three measures and grant an objective analysis of their value to your company.
Additionally, you can use the results dashboard to conduct research on your own organization, performing an internal assessment such as a SWOT analysis.
An acronym for strengths, weaknesses, opportunities and threats, this analysis allows you to identify these four aspects of your company, department or project, ideal for strategic planning and reducing any negative qualities.
It’s easy to do since all questions and answer data are clearly laid out and available to view in different formats.
Moreover, you can use your results dashboard to complete a market trend analysis, an important overview of your industry. Specifically, it is used to analyze trends in a niche market or an industry at large.
A market trend analysis is a method of analysis of past and current market behavior, featuring dominant patterns of a market and its consumers. It relies on examining statistical data and recorded market behavior over a defined period of time.
Your results dashboard is easy to access and view in different visualization, making it easy to compare market trends over a long period of time.
Finally, you can use your survey results dashboard to form a general customer behavior analysis.
This grants you insight into a swath of customer behaviors and their motivations, allowing you to understand how they tick and the reasons behind their purchases. You can delve deeper by studying their preferences among brands, brand loyalty and much more.
All in all, you can partake in numerous market research projects and perform various analyses thanks to the data filtering and visualization options available on the Pollfish results dashboard.
Getting the Most from Your Survey Results
Having access to a robust dashboard of survey results is key to performing a market research campaign and understanding your customers, or any population you seek to study, whether its your employees, students, readers, etc.
The Pollfish online survey platform is keen on optimizing both the respondent and researcher experience. Thus, it is designed to satisfy and ease the use of both parties.
Researchers can leverage a wide pool of insights in their survey results dashboard, which they can view in any way they please, whether it’s by studying the answers of certain demographics or viewing them in specific formats.
You should therefore opt for a platform like Pollfish, which offers artificial intelligence and machine learning to remove low-quality data and offer a broad range of survey and question types.
It also features advanced skip logic to route respondents to relevant follow-up questions based on their previous answers.
As a DIY survey platform, Pollfish puts you in full control of your survey campaign — from targeting, to deployment method, to the questionnaire and how your post-survey data is presented.
With a research platform containing all of these capabilities, you’ll be able to set up research campaigns your way, reap quality data and gauge consumers of any audience via a granular dashboard of survey results.
Discover the robust survey results dashboard on the Pollfish platform, a results page allowing you to view, filter and export survey results as granularly as you wish for a sublime research experience.

New Question Type: Drill Down Questions to Improve Respondent Experience and Data Quality
New Question Type: Drill Down Questions to Improve Respondent Experience and Data Quality
Drill down questions are useful for instances in which you want to ask your target market or target population a question that includes multiple options. This does not necessarily entail a large number of multiple choice answers, but rather multiple prompts that relate to one question topic.
This allows you to include various inquiries into one question, without needing to worry about the relevance of the questions. As such, you can dig deeply into one topic with one question, by adding multiple relevant follow-up questions.
This method is not simply useful to collect better data, but to improve the survey respondent experience. 49% of consumers have left a brand in the past year due to poor customer experience. You should therefore always strive to provide a good CX for your customers.
Given that you’ll be largely studying your customers, surveys grant you an opportunity to give your customers a good CX on yet another touchpoint.
This article explains drill down questions, their importance, examples and how they appear on the Pollfish online survey platform.
Understanding the Drill Down Question
The drill down question is used to help respondents choose from a list of options, with each option existing as a kind of prompt. Usually, respondents answer the prompt by selecting from a drop-down menu.
That is to say that the drill-down is not a primary question with follow-up questions, but a set of dropdown selection menus hierarchically defined.
As such, the drill-down question is a question type used to narrow down a respondent’s choice from a broad to a specific answer. Therefore, it involves multiple prompts, which exist as relevant follow-up questions, each presented with its drop-down menu.
With each following question (or prompt), the topic under investigation, i.e., the one that is originally asked about, gets more and more narrow. In this way, the researcher gets to drill down on the topic, hence the name of this question type.
First, your respondents choose from a general drop-down list. Then, based on their answers, they are presented with specific follow-up prompts with lists as a means to “drill down” their answer. In this way, the respondent is providing data that starts at the general level and becomes more specific with each follow-up prompt or list.
For example, you could first have respondents select a car brand, then they would select a car model and finally, they would choose the year of the car’s manufacture.
The Importance of the Drill Down Question
This kind of question is important for a variety of reasons.
First off, the drill down question type should be used when you need your survey participants to respond to multiple interdependent questions. This is important as it not only organizes and sets up your questionnaire in a more logical (and relevant) way, but it also allows you to ask multiple relevant follow-up questions right under one question.
This will ward off boredom and frustration from repetition, as some respondents may grow tired of seeing what’s essentially the same topic being asked of them continually in the questionnaire.
Instead, you can group that topic under one question, by setting up different follow-up drop-down lists (or prompts) in it.
In addition, you’ll be able to evade different types of survey bias, namely the survey scope error. This bias arises when a survey does not include important items required to fully answer the topic of study. Failing to ask important questions on certain aspects or sub-topics will result in respondents giving incomplete or inaccurate answers.
This will tarnish your survey campaign and your overall research study. While the survey scope error may appear daunting to avoid, it can be done with drill down questions, as they allow you to include a variety of follow-up questions relevant to the main topic at hand and its various subtopics.
This makes it easy to include all essential survey questions while curbing the length of the survey. Regarding the latter, this is possible, as these follow-up prompts exist as drop-down lists, which are easy to select.
What’s more, is that these questions are essentially another major way to include relevant follow-up questions. Thus, they can be used as an alternative to advanced skip logic. This survey method routes respondents to proper follow-up questions, based on their answers to a previous question.
Drill down questions grant you the same capability, the only difference being adding follow-up lists per a single major question. Skip logic instead redirects respondents to new questions, those that are not bound under one main question.
The drill down questions also make for a more engaging survey experience for your respondents, who, as aforementioned, are usually going to be your customers.
Rather than setting up questions in a boring multiple-choice setup, drill down questions to create a more visual and simple way to answer a question.
They are also more inclusive in terms of answer options, as you can add a long list of answers per each drop-down menu in each follow-up prompt. Because of this, these questions help you build customer convenience while gathering critical data on consumer preferences.
All in all, this new question type will provide you with a strong means to collect relevant survey data and improve your survey respondent experience.
Drill Down Questions on Pollfish
This question type brings a new interface to the Pollfish platform. That’s where drill down questions can play a pivotal role.
To reiterate, the drill down question type helps you gain more in-depth data from your respondents. An advanced question type, it is powered with built-in logic to allow you to retrieve answers quickly.
Instead of presenting respondents with a long list of options, drill down questions include a functionality that lets you narrow down the options through a step-by-step way, or rather, by way of multiple prompts.
How to Use Drill Down Questions on the Pollfish Platform
To use this kind of question, you must first go to the questionnaire section of the dashboard. On the left-hand panel or by using the “Add new question” button, choose the Drill Down question option.
Pollfish offers 2 ways to add the drill down values, either by uploading from an Excel/CSV file or by adding the values manually. Pollfish demands the values to be added in a row-like format delimited by columns (in the Excel) or by commas (in CSV or manual).
Importing via Excel or a CSV file
- In the Excel editor, add a column for each dropdown to add to the question. The 1st row must contain the dropdown labels, which you can later edit if needed on the questionnaire page. In the following example, the drill down question will contain 3 dropdowns, narrowing down from the country level to the city one.


- Then, include rows that represent each possible combination of the dropdown values. Some of the values can be repeated, eg. in the following screenshot. For example, since we need to add different states and cities of France, the country category “France” is repeated 4 times.

- (Important) Consider checking the structure of the file before uploading, as any malformed rows (containing a fewer number of values than the number of labels) will result in an error.


- You can save the file as an Excel or CSV and then upload it to the Pollfish questionnaire. Click on the drill down question.


- Select to upload via the “Upload a file with pre-filled options of drill down” and proceed with uploading the file you previously created.


- Once uploaded you can both check the number of different unique values added per dropdown and preview the flow of the question.


- Once the survey has gone running, the drill down question dropdown values cannot be edited, only the labels are editable.
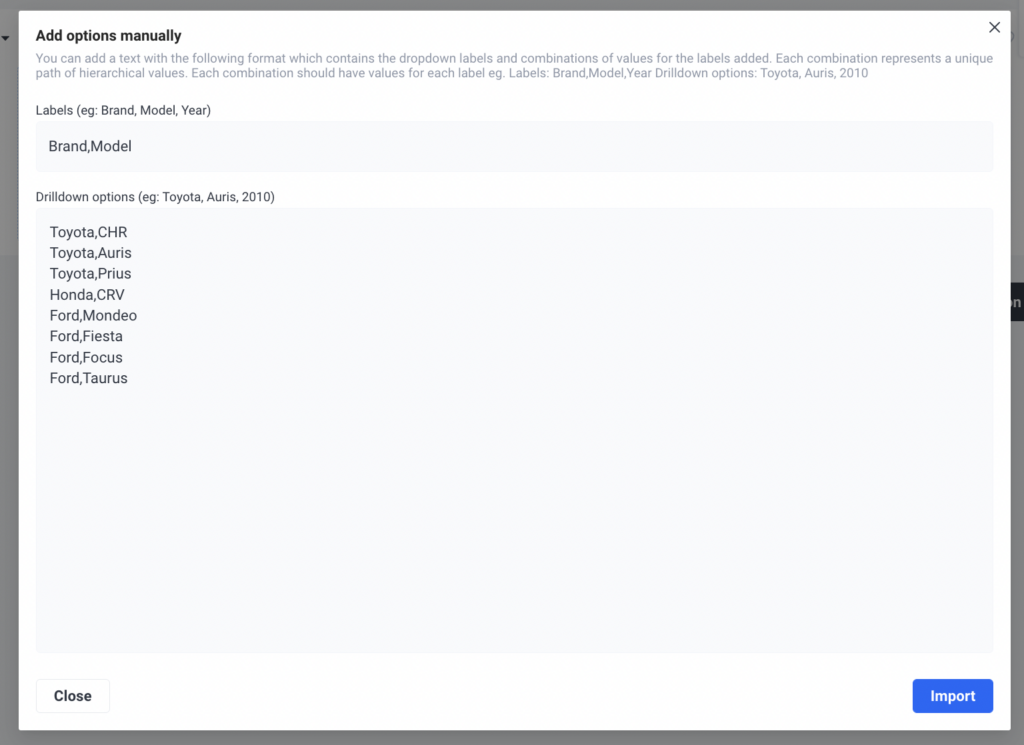
Manually adding values
You can also manually add all the possible combinations for the hierarchy of dropdown levels. In the screen opened you should enter the labels of the dropdowns and the values that they will contain.
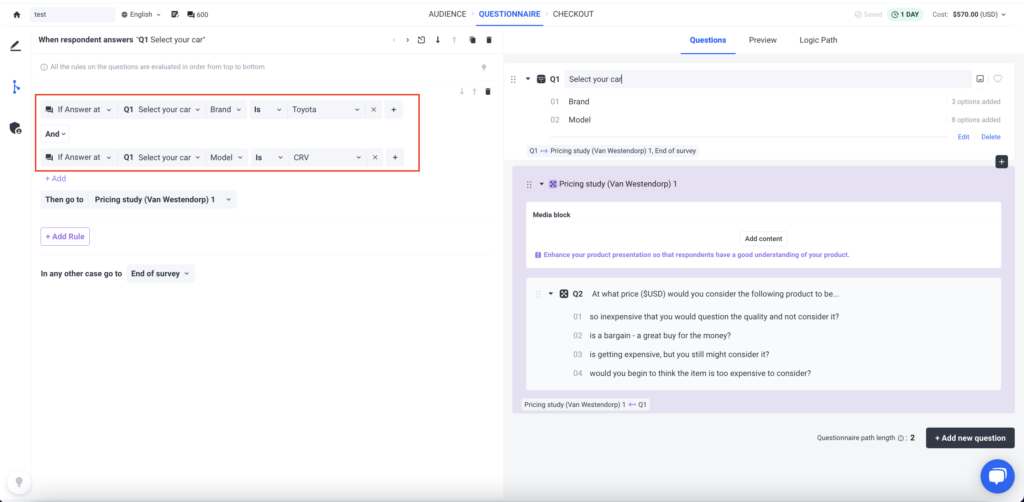
Using logic and recall with the drill down question
Display logic based on a drill down question allows you to hide or display questions based on any level or combination of levels, for example, create a logic rule based on the exact car brand and model type to display a follow-up question, like in the example below.
You can also recall the drill down answer in a following question.
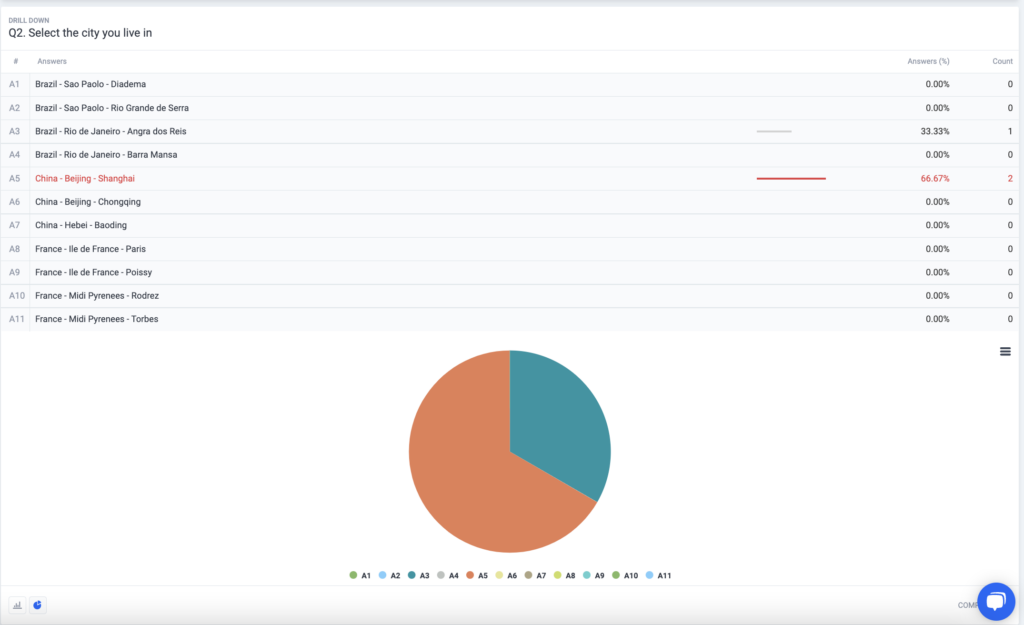
Drilldown results & exports
Once responses have been collected at the survey, the drill down question has the format of a single selection question, where the count and percentage of responses are displayed for each combination of levels provided. You can also switch between the tabular, bar chart view, or pie chart view for the answers.
Curious about how to build your ideal survey? You can learn how to make your own survey in just three easy steps on the Pollfish online survey platform.
The Benefits of Drill Down Questions
This new question type has various advantages along with their aforesaid importance. Take your survey to the next level by applying this question type to one or more questions. But first, let’s learn about its specific benefits.
The following lays out the advantages of using drill-down questions:
- Allows you to get very specific customer data under just one question
- This is because each follow-up prompt gets more specific, based on the answer to the previous one.
- Easy to answer
- It aids the respondents in selecting their answer option without going through a long list of answers.
- Great for those with short attention spans
- This question avoids using long and highly detailed answers.
- Garners highly refined responses
- It allows you to add multiple follow-up prompts, allowing you to get to the nitty-gritty of any subtopic or aspect you’d like to explore.
- As the respondents get to select every option based on previously listed questions, the drilled down answers come out to be highly refined.
- Creates an engaging survey experience
- This question provides more stimulation by getting respondents to answer in a kind of step-by-step way that’s slightly more visual.
- Uncovers more customer personas
- Given that interrelated questions occur at every level, you can use this question type to uncover your customer personas in further detail.
- Speeds up the survey process
- With built-in logic, this question type allows you to reap answers more quickly from respondents and avoid having to apply logic yourself.
Forming the Ideal Survey
Virtually no respondent wants to answer long and detailed questions. That’s where the drill down question comes in, allowing you to collect drilled down information without boring or tiring your respondents with long-winded questions.
Instead, you can quicken the process of answering surveys by helping respondents find the relevant answers they’re looking for, without going through a single endless list. As such, form your ideal survey by opting for an online survey platform that offers this question type.
But there’s more when it comes to choosing the right online survey provider. You should go for a platform that enables you to survey anyone. As such, you’ll need a platform with a reach to millions of consumers, along with one that offers the Distribution Link feature.
The former works by way of Random Device Engagement, which targets and gathers respondents where they voluntarily exist in different digital channels. It distributes surveys randomly, across a wide network of digital properties. This includes websites, mobile sites and mobile apps, making for a randomized survey deployment.
The latter feature (Distribution Link) empowers you to send your survey to specific customers, instead of only deploying them across a vast network. Thus, you can target respondents you know to be your customers via email and social media or drop your link across digital channels of your choosing, such as landing pages, homepages, etc.
It is also important to use a mobile-first platform, as mobile dominates the digital space and no one wants to take surveys in a shoddy mobile environment.
The online survey platform you opt for should also offer artificial intelligence and machine learning to remove low-quality data, offer a broad range of survey and question types and disqualify low-quality data.
With an online survey platform with all of these capabilities, you’ll be able to form your ideal survey, one that garners key customer data while providing a good CX.

The New Bipolar Question: A Matrix Question Type
The New Bipolar Question: A Matrix Question Type
We’ve recently released a new version of the Matrix question type called the Bipolar Question, which is a specialized variation of this question type. With this new functionality, you can help respondents answer by including dual-labeling, as this variation includes a scale — the Bipolar Scale.
Each end of the Bipolar scale is marked to show its two extremes. This way, respondents will quickly determine which side has the more positive answers and which leans on the negative ones. In addition, they'll understand how each side of the scale of answer options differs by understanding which extreme it falls under.
A variation of the Matrix question, it too relies on a table or grid when asking about the same set of characteristics for multiple items, just like you would expect with a Matrix question.
However, this version is distinct in that it displays two extremes of a scale that are set by the researcher. This variation is a more advanced version of the Matrix questions you’re used to seeing and the opposite of the Likert Scale Matrix variation.
This article explains the new Bipolar variation of the Matrix question type, its importance, examples, how it differs from the Likert variation and how to use it on the Pollfish platform.
Understanding the Bipolar Question Variation
The Bipolar question is a kind of variation of a Matrix question, which is also called a Matrix table question. As such, you’ll need to have a firm understanding of this main question type before undertaking any of its variations.
What is a Matrix Question?
This question type utilizes a table or grid as a means to present the questions and answer options. It is typically used to ask about the same set of characteristics for multiple items, such as how often a respondent uses a product or service.
The question itself is set up as a table or a grid to bring the information together for the respondent in an easily understandable way.
Matrix table questions allow you to combine a set of questions with the same answer options. This is especially useful when you seek to ask multiple questions that can be rated on the same scale, meaning, they can all be measured with the same answer options that are displayed on a scale. For example, on a scale of extremely rarely to extremely frequently.
The Bipolar Matrix Question Type
As aforesaid, this question type is a variety of the Matrix question. It takes essentially the same layout as a Matrix question and has one defining characteristic: a marked display of two extremes of the table or scale.
Given the emphasis on the two opposites of the scale, this scale is called the Bipolar Scale, granting this variation to its name.
The researcher (or platform user) is in charge of setting the two extreme ends of the scale and making them noticeable. This is done by assigning each end with a name. For example:
in the following question: “How would you rate this sneaker?” the two extremes would be marked by the words: “extremely painful” and “extremely comfortable.”
Each descriptive word would be displayed at the opposite ends of the scale. This shows respondents where each answer option is relative to the two extremes.
How the Bipolar Question Works
Respondents select a point between the two extremes, with the point being an answer option in the scale. These points can also be labeled as a means of further helping guide respondents through the Bipolar Scale. They can have labels that match the type of intensity of the point.
For example, they can be labeled as “very little” to “none at all.” Other options include using the same labels on each side of the scale, with a single point for neither or neutral, such as “very little” and “very much” or “highly unlikely” and “highly likely” on each side.
The Importance of the Bipolar Question Variation
This Matrix question variation is important for several reasons.
First off, it is useful to include in your survey if you seek to measure consumer preferences and opinions based on intensity. It is especially important if you want to measure your respondents’ views on something regarding your brand based on two opposite extremes.
This is crucial, as many times, shopping habits, sentiments and customer behavior can all be whittled down into two main categories, or fall somewhere in between two main categories. These often exist as two opposites that you can study your customers with, based on what they choose in between or at the polar ends of the two extremes.
Secondly, this question type is important, as it helps guide your respondents on how to answer the question, based on how each option is oriented. As such, they’ll better understand which extreme their answer is associated with.
They’ll also understand how neutral their answers are, or whether they slightly gravitate towards one end or the other. By helping your respondents better understand under which extreme their answer lies, you’ll also reap more accurate responses, which will provide you with key data for decision-making.
Lastly, this kind of question variation creates a more visual and engaging survey experience. Due to its helpful nature in helping your respondents choose an answer, it makes a more lively and enjoyable survey experience.
Not only will this speed up the survey process, which will bring you faster insights, but it will also improve your brand reputation if you include your brand name or specific product or service in the question itself, or somewhere else in the survey.
All in all, the Bipolar question variation is critical for various reasons concerning survey user experience, providing more accurate answers, getting speed to insights and improving your overall brand experience.
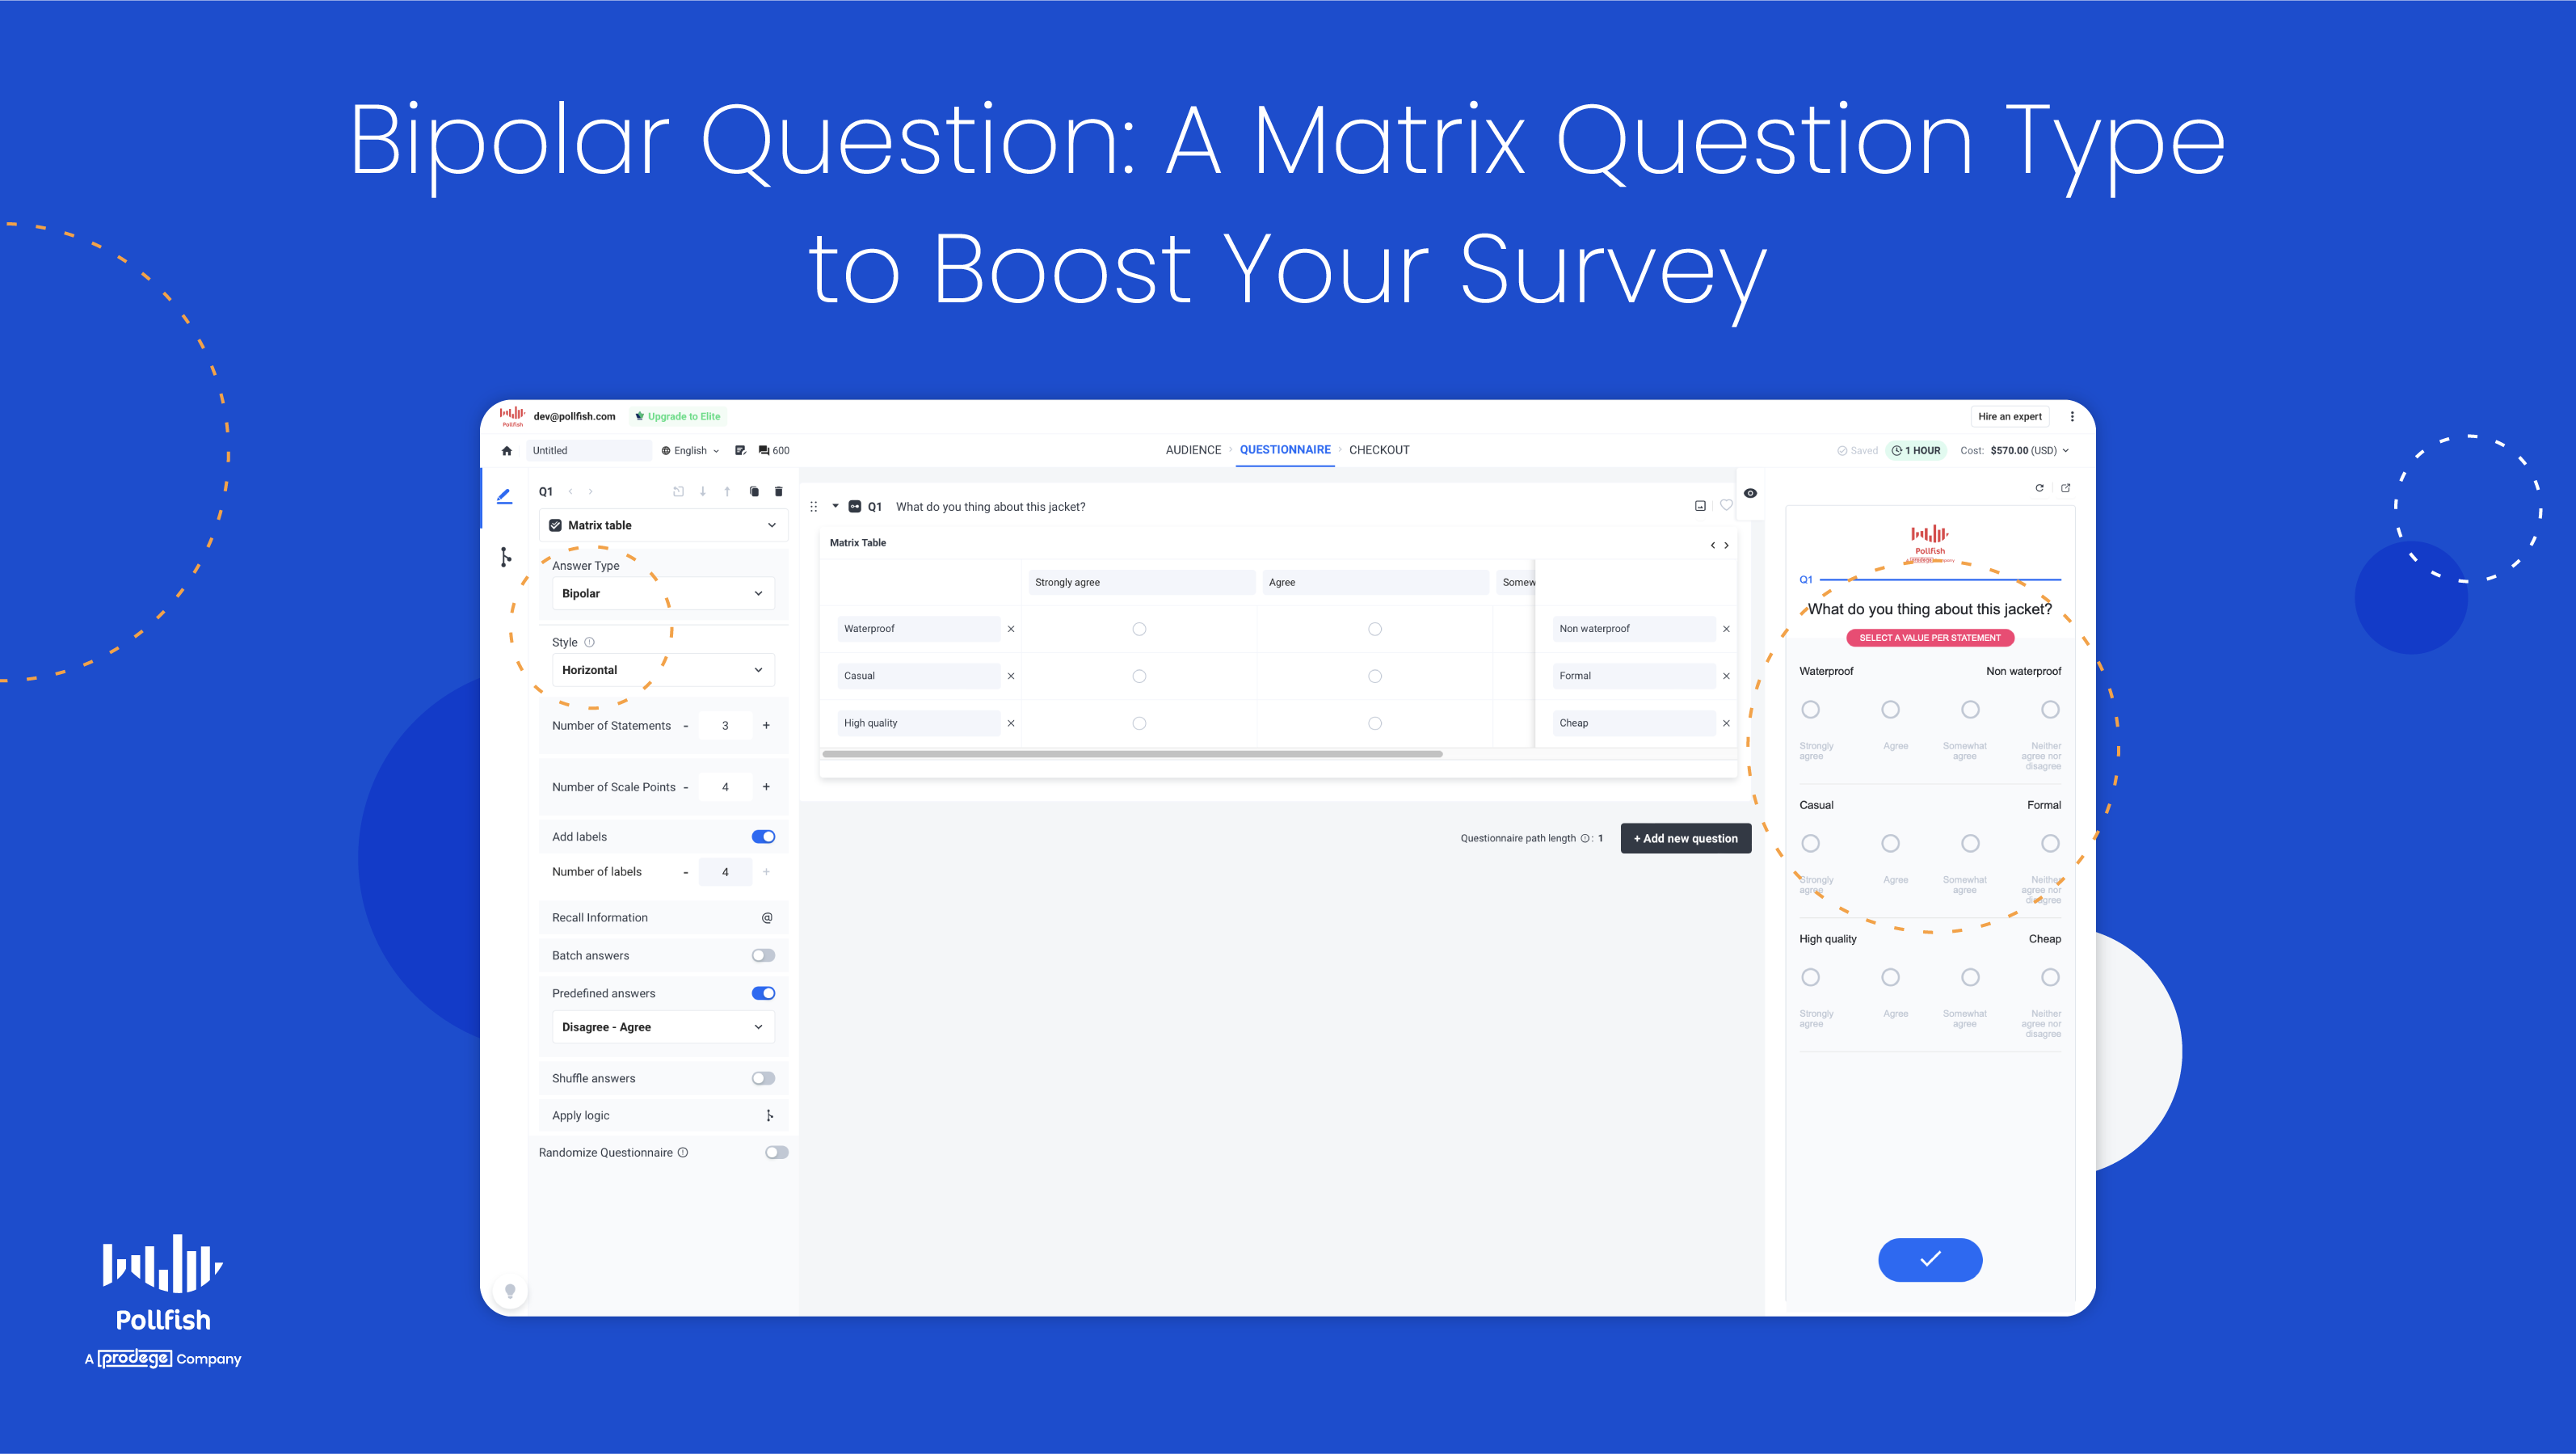
The Bipolar Question Type on Pollfish
You can set up the Biopolar Scale to your liking by choosing how you label the two extreme ends and the points on the scale.
The following displays how this new question type looks on the Pollfish platform:
How the Bipolar Question Type Differs from the Likert Question Type
Both of these question types are variations of the Matrix question. As such, the Matrix question type exists as the parent question category, while Bipolar and Likert Scale variations are the more granular child categories.
Both categories therefore can use a scale of 5-7 questions and both use a Matrix table, but their distinct version of it.
Let’s explore how they differ from each other in the following table:
| Bipolar Scale Matrix Question | Likert Scale Matrix Question | |
| What’s displayed | Two extremes of a scale in a table format. | A list of statements as rows and scale points as columns in a table format. |
| Question options | Respondents select a point between the two extremes. | A single answer, a multiple answer, a drop-down list, or a drag and drop. |
| Answer Labeling | Because the two extremes are marked, labeling individual points is optional. | Each option always has a label. |
| Answer Options | Respondents can provide just one answer. | Respondents can provide more than one answer. |
How to Use the Bipolar Matrix Question Variation on Pollfish
Creating this question type and using it on the Pollfish market research platform is easy to do. First, go to the questionnaire section of your survey. Then, select your question type in the lefthand panel.
Then choose from the following options to set up your Bipolar Scale:
- There are 2 extreme-scale values for each statement.
- Select the length of the scale points and add the number of labels, as you will have to choose how to represent the Bipolar question to your respondents.
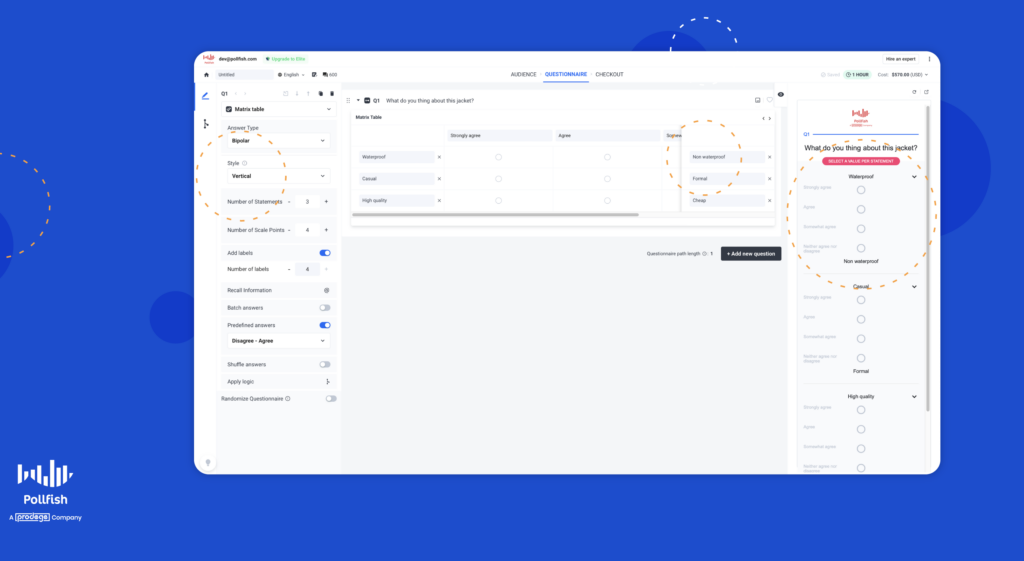
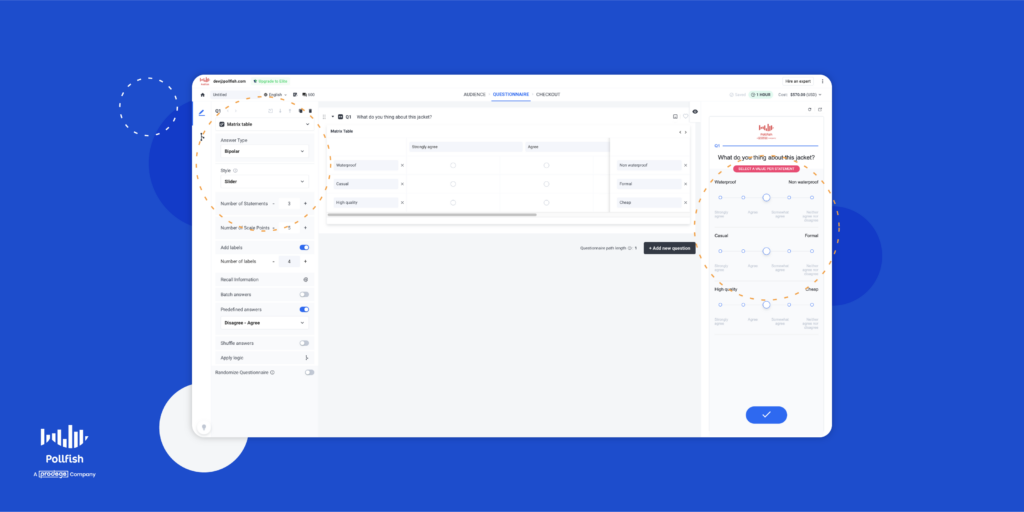
- Use rows and columns( horizontal and vertical cells or use the Sliders.
Afterward, choose from the available settings for your Bipolar Matrix question:
- The number of statements, AKA, rows has no restriction.
- Scale points, the radio buttons available also have a few restrictions and conditions:
- Include up to 20 for Horizontal and Vertical cells.
- Use up to 11 for the slider.
- Use up to 20 statements for all forms.
- Labels, which are optional and go above the scale points. They do not have to be the same number as the scale points.
Don’t forget to type in your question and have your answer options (the points) you seek to fill in.
Next, consider how we implement this question type:
- In the questionnaire
- Using advanced skip logic
- On mobile and desktop versions
- On the results page
- In exports, BQ and file exports
- With Survey Translations
Finally, review your question and answer options (the points) and add more Bipolar or other questions to your questionnaire.
Curious about how to build your ideal survey? You can learn how to make your own survey in just three easy steps on the Pollfish online survey platform.
Setting Up the Ideal Matrix Table
You can now use the Pollfish platform to create a specialized Matrix question: the Bipolar question type. A variation of the Matrix question, it helps you create a more custom question format that guides respondents on which extreme their answer falls under.
Giving you the chance to fish out more accurate answers while creating a more engaging survey experience, using this question variation is a must. That’s why it is equally important to select a strong online survey platform that facilitates creating this question type.
But there’s more when it comes to choosing the right online survey platform. You should choose a survey provider that enables you to survey anyone. As such, you’ll need a platform with a reach to millions of consumers, along with one that offers the Distribution Link feature.
The former method works via Random Device Engagement, which targets and gathers respondents where they voluntarily are across different digital channels. Thus, it distributes surveys randomly, across a wide network of digital properties. This includes websites, mobile sites and mobile apps, making for a randomized survey deployment.
The latter method, which uses the Distribution Link feature empowers you to send your survey to specific customers, instead of only deploying them across a large network. This enables you to target respondents you know are your customers via email and social media as well as adding your link across digital channels, such as landing pages, homepages, etc.
It is also important to use a mobile-first platform, as mobile dominates the digital space and no one wants to take surveys in a shoddy mobile environment.
The online survey platform you opt for should also offer artificial intelligence and machine learning to remove low-quality data, offer a broad range of survey and question types and disqualify low-quality data.
With an online survey platform that offers all of these capabilities, you’ll be able to form your ideal survey and easily set up and use the Bipolar Scale question variation.

Sending and Targeting Surveys to Anyone With the Distribution Link
Sending and Targeting Surveys to Anyone With the New Distribution Link

The Pollfish platform just got much more powerful. We now offer another major way to deploy surveys so that researchers can target the exact people they seek to study for all of their research needs.
We’re thrilled to introduce the Distribution Link, a feature that completes the Pollfish survey distribution and deployment functionality. It is currently FREE to use this DIY market research tool.
With this latest feature, you can target respondents in the most precise way: via their identities instead of their demographics, location, and other screening filters you’ll find on our platform.
This feature fortifies your survey outreach process, arming you with the knowledge of specific respondents. As such, it provides a powerful addition to market research techniques and gives you the full Pollfish experience.
This article explains the Pollfish Distribution Link feature, so that you can apply it to all your unique respondent targeting needs.
Understanding the Pollfish Distribution Link Product Feature
The Distribution Link is a new product feature for distributing your surveys to the exact targets you seek to complete them. It serves as an alternative to our current survey deployment method: that of random device engagement sampling or RDE sampling.
With RDE sampling, the Pollfish platform launches your survey to hundreds of thousands of highly-trafficked websites, mobile sites and apps, prompting random internet users to take your surveys. Of course, only those who qualify to take it based on your screening section are granted entry into the survey.
This way, only members of your targeted population will participate in your survey and they are targeted in a completely randomized way. While this strategy is useful and efficient, bringing you quality data and speed to insights, it was rather incomplete.
This is not to say that you couldn’t extract high-quality data from the Pollfish platform through its survey fraud protection and quality checks system or that you couldn’t target people based on demographics, psychographics, location, etc via the RDE approach. In fact, that is exactly what the RDE method was built for: quick insights from a vast and random sampling pool.
While this is an innovative approach, it was incomplete in that it didn’t allow you to send your survey(s) yourself to specific individuals. But now you can with the Distribution Link feature.
The Distribution Link allows researchers to send their survey(s) themselves to their exact targets, actual individuals rather than a random pool. But it can do much more.
Since this feature is a link, you can send it through various means and reap various benefits.
Distribution Link Facts, Cost and How to Add it to Your Survey Campaign
The researcher can create a draft and instead of distributing it via the Pollfish network, they can generate a link that potential respondents can click on to reach the survey. As such, there will be no checkout page, but a link that researchers can share across mediums.
The first release is available for all accounts for free.
The following explains how to apply the Distribution Link feature to your survey:
- Click on ‘’Create new survey’’ on the Pollfish platform.
- Then, select the option of “create a link” to share the survey.
- Select to start through a template or from scratch.
- You’ll then be directed to the Questionnaire page, where you can select your intended respondent demographics and other qualifications.
- You can also add screening questions that will allow or bar entry to the survey to respondents who answer them in a particular way.
- After filtering options in the Questionnaire page, Then you’ll be taken to the Questionnaire page, where you can design your questionnaire or alter the template.
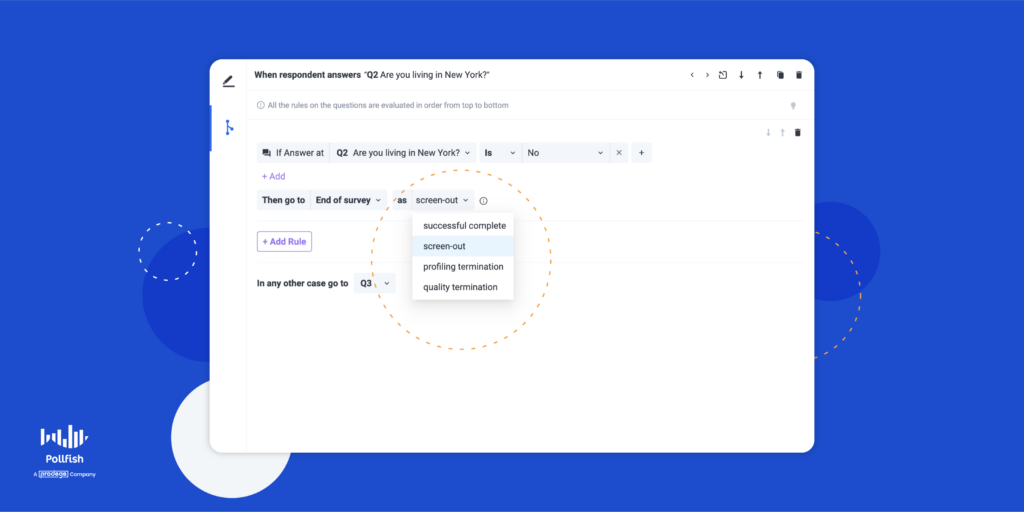
- If you want to screen your audience do so through the ADL tab.
- When you send a user to the end of a survey through the ADL tab, this is due to:
- A successful survey completion
- Screen out termination
- Profiling termination
- Quality termination
Please note the following changes we’ve made in 2022:
Quality termination is replacing the Disqualification rules feature in the Distribution Link feature. Additionally, screenout and profiling terminations through ADL are replacing the Audience page and screening questions in this feature.


Capabilities and Benefits of the Distribution Link Feature
This feature presents a potent way to collect survey responses; as such, it is another means of survey sampling methods. It has a slew of various capabilities and benefits. The following lists all that researchers can do with the Distribution Link feature:
- Appears as an easy-to-access, sharable link.
- Allows you to hyper-target your target market sample.
- Permits you to reach specific individuals.
- Grants you the power to survey consumers and leads at key moments in their customer journey.
- Enables you to gain consumer opinions about events in their customer experience (CX) while they’re fresh on their minds.
- Allows you to understand what customers don’t like or where you went wrong as these events are still occurring.
- Gives you access into the minds of specific people, at specific times in their CX.
- Makes it possible to ask consumers about your company, specifically, their experience with it, as opposed to more general questions about their thoughts about your niche and cultural climate.
- Brings you insights from key stakeholders and players in your industry and certain companies.
- Provides an alternative survey sampling approach you can use alongside RDE sampling, allowing you to conduct comparative analyses between the two sets of data.
Methods and Campaigns to Use with the Distribution Link Feature
The Distribution Link feature opens doors to conducting several key market research campaigns. It also augments your survey deployment by providing more methods of sending your surveys. This means you are not limited to sending the surveys to specific people through a single channel.
Instead, this feature offers far more options to carry out your research campaigns and reap critical data for decision making. As such, it diversifies your options for distributing your surveys, along with enabling you to carry out and refine critical business campaigns.

The following lists the different methods and campaigns you can use with the Distribution Link feature:
- Email Specific Targets
- This serves as the classic method for inviting targeted people to take your survey.
- You ought to email consumers at specific times in their customer buying journey.
- There are various points in the customer journey and sales funnel that are opportune to survey your target market, such as: post-purchase, cart abandonment/ lack of purchase, bounces, email list sign-ups, a discussion with a representative, etc.
- There are several best practices you should use to increase your survey completion rate if you choose to email your targets.
- Social Media survey invitations.
- With the Distribution Link feature, you can copy/paste the link to the survey you want to deploy across any social media channel.
- This way, you can compare visitors from social media with other means of extracting data, whether it is with other Distribution LInk methods or via RDE sampling.
- B2B Feedback via B2B surveys
- You can gain critical insights with your business clients, vendors and partners to smooth various contracts, processes, integrations and other business dealings.
- With this feature, you can contact these entities directly, so you’ll know exactly who has provided answers to your survey.
- Create this survey type with the correct B2B survey questions.
- Content Marketing Strategy campaigns
- With RDE sampling, you cannot reach out to specific site users that visited and interacted with your website and its content.
- With the Distribution Link feature, you can survey people who have interacted with your content, are subscribed to your newsletter, visit your site regularly, have signed up for a mailing list, etc.
- The link allows you to attach your brand and its experience to the survey, which is also useful for brand visibility.
- Demand Generation campaigns
- If you do not want to directly mention your survey in social media or email messages/campaigns, you can still use the Distribution Link in your landing pages.
- This provides a more indirect way to access your survey, however, a landing page can provide an in-depth explanation, or a bulleted list describing your survey.
- Use CTAs in your landing pages to link to your Distribution Link survey.
- Employee Feedback Survey Campaigns
- Send surveys to your team only, or even specific departments with various employee-facing surveys.
- Use the employee satisfaction survey or the eNPS survey to gauge employee fulfillment, happiness and how likely they are to recommend working at your organization.
- Keep burnout at bay with the employee burnout survey.
- Recognize high-performing and hard-working employees with the employee recognition survey.
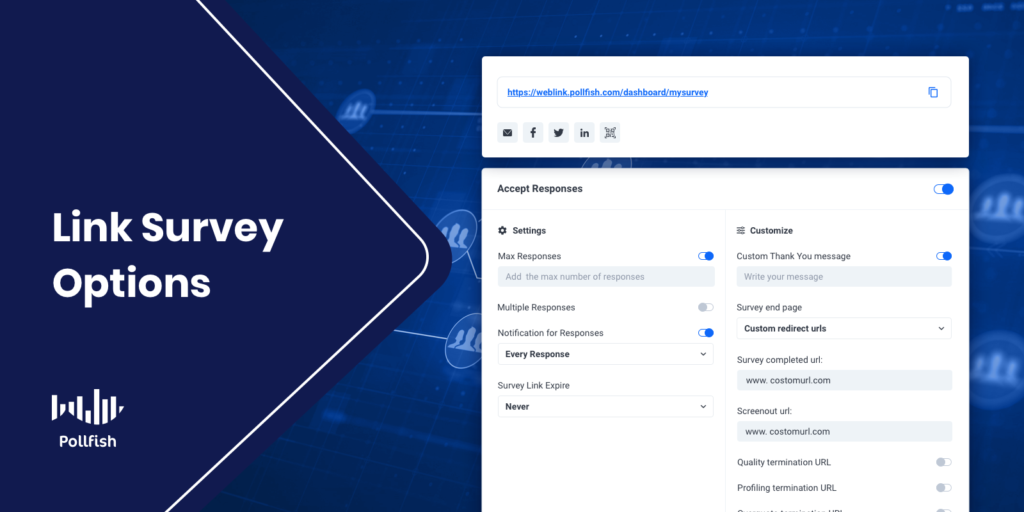
How to Use the Feature
- Create your questionnaire
- Select if you want to ask a question and screen the respondents (for profiling, quality, or screener) through the ADL.
- The Link Settings page is combined with the Share page title :
- Set up maximum responses if need be.
- Allow multiple responses from the same respondent.
- Select if you want to be informed of new responses.
- Set an expiration date for your survey.
- Add a custom “thank you” message.
- Select what will occur when a respondent adds a complete
- Send them to the Pollfish homepage.
- Send them to the results.
- Add custom redirect links.
- The results will be the same as regular ones, with the ability to delete a response.
Passthrough Parameters
This is a new implementation for 2022. In conjunction with the redirect URLs, we now support passthrough parameters. This feature allows researchers to pass different identifiers and parameters through the distribution entry link and redirect URL’s for each respondent or a batch of respondents. All parameters are also saved and are available at the XLS export.
Passthrough parameters allow you to pass information to and from a website by simply adding, or appending, specific information to the end of a URL.
You can append as many parameters as you want to your survey link.So what is their purpose in the context of market research? They enable researchers to pass different identifiers, AKA, parameters through survey URLs. The respondents then retrieve them through the redirect URLs.
They are predominantly used to track and match a respondent with a certain response. In Pollfish, you append the user ID at the entry URL and retrieve it at the redirect URL.
By doing so, you can match a respondent profile from the Pollfish respondent pool with a response on a Distribution Link survey.
Personalizing Your Survey Campaigns
Personalization is crucial in marketing and market research and with the Distribution Link feature, you have the option of personalizing your survey to its targeted respondents. You may know exactly who you seek to target if you’re setting up a B2B survey with a client, vendor or partner.
Or, if a customer on your website provides their key identifying details, such as their name, location, email address and more, this also gives you an avenue for personalization. You can then set up a personalized survey and send it to specific individuals with the Distribution Link.The key is to use a strong online survey platform like Pollfish, which now arms you with this link feature that makes it easy to make your own survey in only three steps. With the Distribution Link feature, Pollfish empowers your market research and general research campaigns more than ever before.